
INTRODUCTION
Type 1 diabetes (T1D) is the most common metabolic disorder in children, and it has serious short-term and long-term implications [1]. T1D increases dramatically in children aged 0-4 years [2], and more than 500,000 children developed T1D in 2015 (www.idf.org). The cause of T1D is not fully understood. In 1974, Nerup et al. [3] first identified the associations between human leukocyte antigen (HLA) variants and T1D. Recent studies have found that T1D clusters within families and twins [4, 5]. These studies have indicated that T1D is one of the most heritable types of common diseases.
T1D is an organ-specific autoimmune disease that results from the T cell-mediated destruction of pancreatic β cells [1]. The cytotoxic T-lymphocyte associated protein 4(CTLA-4) gene, which has been mapped to the insulin-dependent diabetes mellitus (IDDM) 12 locus (2q33), encodes a T-cell-specific transmembrane co-receptor [6]. The CTLA-4 gene is known to contain multiple single nucleotide polymorphisms (SNPs): -318C/T in the promoter, +49A/G in exon 1, and a multiallelic dinucleotide repeat in the 3'untranslated region (UTR) of exon 4 [7]. The SNP of CTLA-4 +49A/G locus (rs231775) has a gene dosage effect on the levels of sCTLA-4 [8]; therefore, CTLA-4 +49A/G polymorphism has been widely studied in autoimmune diseases, and it has been reported to be involved in the development of Graves’ disease (GD) [9], systemic lupus erythematosus (SLE) [10], and diabetes mellitus [11]. Nistico et al. [12] first found a strong association between T1D risk and CTLA-4 +49A/G polymorphisms in 1996, but this was not further confirmed by Yanagawa T et al.[13] in 1999. In addition, several meta-analysis studies [14–17] did not stratify by age, so the association between CTLA-4 +49A/G polymorphisms and the risk of T1D in children is still not confirmed. Since children are a group that is relatively unaffected by confounders (e.g., environment and diet), the association between CTLA-4 +49A/G polymorphisms and the risk of T1D in children can more realistically reflect genetic susceptibility to T1D.
Although Luo et al. [18] conducted a meta-analysis of this topic in 2012, that analysis did not include seven suitable studies [19–25]; moreover, recently other studies with adequate power have been published [26, 27]. Therefore, this present study conducted an updated systematic review and meta-analysis of studies describing the association between CTLA-4 +49A/G polymorphisms and the risk of T1D in children. Furthermore, trial sequential analysis (TSA) was used to determine whether the currently available evidence was sufficient and conclusive.
RESULTS
Study characteristics
Figure 1 shows the flow diagram of the literature selection process. A total of 17 articles were included for qualitative synthesis based on the inclusion and exclusion criteria, and two articles [21, 23] were further separated into four studies because they examined different racial groups (Table 1, S1 file); therefore, a total of 19 case-control studies, amounting to 3,797 cases and 3,981 controls, were finally pooled into the meta-analysis.
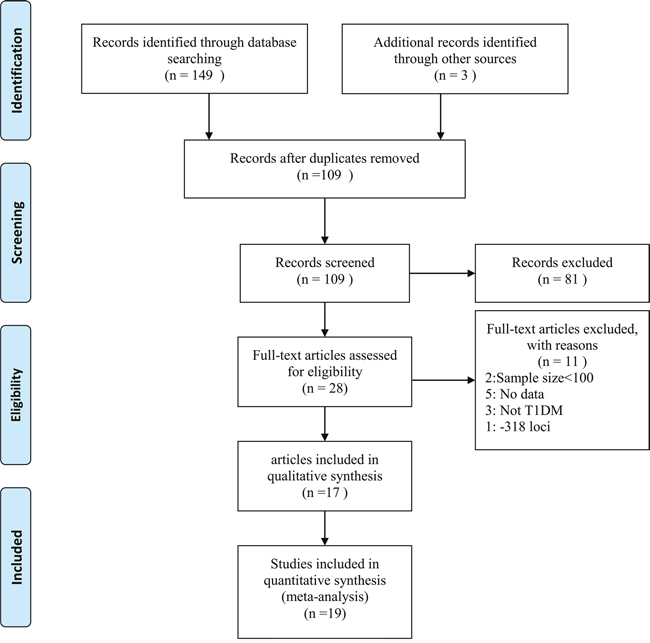
Figure 1: Flow diagram of included studies for this meta-analysis.
Table 1: Characteristics of the included studies
Study |
Year |
Country |
Diagnosis criteria |
Sample size |
Age |
Genotyping method |
P* (HWE) |
||
|---|---|---|---|---|---|---|---|---|---|
Cases |
Control |
Cases |
Control |
||||||
Lee |
2000 |
China |
The National Diabetes Data Group (1979) |
253 |
91 |
7.1±3.7 |
adults |
RFLP |
0.378 |
Takara |
2000 |
Japan |
anti-GAD antibody (GAD65) and a urinary C-peptide level of <20 μg/day |
51 |
107 |
10.9±7.7 |
- |
RFLP |
0.044 |
Cinek |
2001 |
Czech |
WHO glycaemic criteria |
305 |
289 |
7.6±3.8 |
8.5±3.9 |
PCR-ARMS |
0.458 |
Kamoun |
2001 |
Tunisia |
- |
74 |
49 |
<15 |
- |
RFLP |
0.316 |
Kikuoka |
2001 |
Japan |
WHO Study Group(1985) |
125 |
200 |
0.5-16 |
- |
RFLP |
0.287 |
Osei-Hyiaman |
2001 |
China |
The National Diabetes Data Group (1979) |
350 |
420 |
0.3-15 |
0.3-15 |
SSCP |
0.741 |
Osei-Hyiaman |
2001 |
West African |
The National Diabetes Data Group (1979) |
182 |
201 |
0.3-15 |
0.3-15 |
SSCP |
0.295 |
Mochizuki |
2003 |
Japan |
The Japan Diabetes Society and the American Diabetes Association |
97 |
60 |
<16 |
matched |
RFLP |
0.539 |
Genc |
2004 |
Turkish |
the National Diabetes Data Group |
48 |
80 |
13.45±0.47 |
11.93±0.91 |
RFLP |
0.233 |
Dallos |
2008 |
Slovak |
Hyperglycemia and development of ketoacidosis |
150 |
136 |
7.5± 4.0 |
matched |
RFLP |
0.079 |
Dallos |
2008 |
Slovene |
Hyperglycemia and development of ketoacidosis |
170 |
95 |
9.7±4.3 |
matched |
RFLP |
0.579 |
Saleh |
2008 |
Egypty |
ketoacidosis or ketosis and continuous dependence on insulin |
396 |
396 |
6.7±0.4 |
32.5±3.7 |
RFLP |
0.501 |
Balic |
2009 |
Chile |
American Diabetes Association diagnostic criteria |
300 |
310 |
10.8±4.1 |
11.0±2.2 |
RFLP |
0.267 |
Jung |
2009 |
Korea |
WHO(1999) |
176 |
90 |
7.5±4.0 |
- |
RFLP |
0.053 |
Momin |
2009 |
Chile |
the WHO diagnostic guidelines, clinical symptoms, absolute insulin-dependency, and pancreas-specific autoantibodies |
261 |
300 |
9.47±3.32 |
10.66±3.05 |
RFLP |
0.434 |
Douroudis |
2009 |
Finnish |
American Diabetes Association diagnostic criteria |
404 |
725 |
9.8±3.4 |
- |
RFLP |
0.232 |
Perez |
2009 |
Spanish |
- |
260 |
255 |
13.8±5.3 |
11.3±1.7 |
RFLP |
0.115 |
Celmeli |
2013 |
Turkish |
WHO |
91 |
99 |
11.7±5.1 |
9~30 |
RFLP |
0.161 |
Mosaad |
2013 |
Egypty |
- |
104 |
78 |
12.03±3.44 |
12.74±2.83 |
RFLP |
0.01 |
Abbreviations: RFLP, restriction fragment length polymorphism; PCR-ARMS, polymerase chain reaction-amplification refractory mutation system; SSCP, polymerase chain reaction-single-strand conformation polymorphism; HWE, Hardy-Weinberg equilibrium.
Table 1 lists the characteristics of the included studies. Among the included studies, 13 case-control studies were conducted in Caucasian groups [8, 21-24, 26-32], and six in Asian groups [19-21, 25, 33, 34]. Most of the studies used the restriction fragment length polymorphism (RFLP) method for genotyping [8, 19, 20, 23–34]. Only one used a novel polymerase chain reaction-amplification refractory mutation system (PCR-ARMS) assay [22], and one used a polymerase chain reaction-single-strand conformation polymorphism (SSCP) assay [21]. Only two of the studies did not use HWE [26, 34].
Risk of bias assessment
As described in Table 2, the answers for the ascertainment of the controls, population stratification and selective outcome report were “Yes” for all the included studies; therefore, the risk of bias was less likely. However, the risk of bias was highest in quality control for genotyping (68.4%, unclear for 13 studies). The other risk of bias comes from the diagnosis of T1D (26.3%, unclear for five studies), confound bias (31.6%, unclear for six studies), and HWE (10.5%, two studies out of HWE).
Table 2: Determination of risk assessment bias by included studies
Study |
Ascertainment of T1D |
Ascertainment of controls |
Confounding Bias |
Quality control for genotyping |
HWE In control |
Population stratification |
Selective outcome report |
|---|---|---|---|---|---|---|---|
Lee |
Yes |
Yes |
Yes |
Yes |
Yes |
Yes |
Yes |
Takara |
Yes |
Yes |
Unclear |
Unclear |
No |
Yes |
Yes |
Cinek |
Yes |
Yes |
Yes |
Yes |
Yes |
Yes |
Yes |
Kamoun |
Unclear |
Yes |
Yes |
Yes |
Yes |
Yes |
Yes |
Kikuoka |
Yes |
Yes |
Yes |
Unclear |
Yes |
Yes |
Yes |
Osei-Hyiaman |
Unclear |
Yes |
Unclear |
Unclear |
Yes |
Yes |
Yes |
Mochizuki |
Yes |
Yes |
Yes |
Unclear |
Yes |
Yes |
Yes |
Genc |
Yes |
Yes |
Yes |
Unclear |
Yes |
Yes |
Yes |
Dallos |
Yes |
Yes |
Yes |
Yes |
Yes |
Yes |
Yes |
Saleh |
Yes |
Yes |
No |
Yes |
Yes |
Yes |
Yes |
Balic |
Yes |
Yes |
Yes |
Unclear |
Yes |
Yes |
Yes |
Douroudis |
Yes |
Yes |
Unclear |
Unclear |
Yes |
Yes |
Yes |
Jung |
Yes |
Yes |
Unclear |
Unclear |
Yes |
Yes |
Yes |
Momin |
Yes |
Yes |
Yes |
Unclear |
Yes |
Yes |
Yes |
Perez |
Unclear |
Yes |
Yes |
Unclear |
Yes |
Yes |
Yes |
Celmeli |
Yes |
Yes |
Yes |
Unclear |
Yes |
Yes |
Yes |
Mosaad |
Unclear |
Yes |
Unclear |
Unclear |
No |
Yes |
Yes |
Abbreviations: T1D, Type 1 diabetes; HWE, Hardy-Weinberg equilibrium.
Allele frequencies in different ethnicities
To assess the allele frequencies in different ethnicities, the allele frequencies in the controls were calculated based on the original data presented in the included studies. The G and A allele frequencies were 43.7% and 56.3%, respectively, in the Asian population, and 37.8% and 62.2%, respectively, in the Caucasian population. The GG, GA, and AA frequencies were 21.5%, 44.5%, and 34.1%, respectively, in the Asian population and 15.9%, 43.8%, and 40.3%, respectively, in the Caucasian population. A statistically significant difference was found between the two ethnicities (χ2=23.7, P<0.001 for allele frequency and χ2=22.7, P<0.001 for genotype frequency).
Meta-analysis results
Table 3 shows the meta-analysis results of the association between CTLA4 +49A/G polymorphisms and T1D risk. Significant heterogeneity was observed in the allelic model (I2=43.9 and P=0.001); therefore, a random effects model was used and the overall OR was 1.33 (95%CI=1.19-1.48). After the model was stratified by ethnicity, heterogeneity decreased significantly in the Asian population (I2=24.7 and P=0.249), but not in the Caucasian population (I2=53.4 and P=0.012). The ORs were 1.60 (95%CI=1.39-1.83) for the Asian population and 1.24 (95%CI=1.10-1.40) for the Caucasian population. These results did not significantly change after excluding the two studies that did not use HWE (Table 3).
Table 3: Associations between CTLA4 +49A/G polymorphism and T1D risk in children
Comparison |
Group |
No. of studies |
Test of association |
P |
Model |
Heterogeneity |
||
|---|---|---|---|---|---|---|---|---|
OR |
95%CI |
I2% |
P |
|||||
Allele G vs allele A |
overall |
19 |
1.33 |
1.19-1.48 |
<0.001 |
R |
44.0 |
0.001 |
Asian |
6 |
1.60 |
1.39-1.83 |
<0.001 |
F |
24.7 |
0.249 |
|
Caucasian |
13 |
1.24 |
1.10-1.40 |
0.001 |
R |
53.4 |
0.012 |
|
HWE |
17 |
1.30 |
1.16-1.46 |
<0.001 |
R |
60.9 |
0.001 |
|
Age matched |
11 |
1.24 |
1.06-1.46 |
0.008 |
R |
67.1 |
0.001 |
|
GG vs GA |
overall |
19 |
1.35 |
1.18-1.54 |
<0.001 |
F |
21.1 |
0.392 |
GG vs AA |
overall |
19 |
1.75 |
1.37-2.24 |
<0.001 |
R |
57.5 |
0.001 |
Asian |
6 |
2.46 |
1.85-3.27 |
<0.001 |
F |
39.7 |
0.141 |
|
Caucasian |
13 |
1.55 |
1.18-2.03 |
0.002 |
R |
52.4 |
0.014 |
|
RFLP |
16 |
1.77 |
1.38-2.27 |
<0.001 |
R |
45.6 |
0.024 |
|
HWE |
17 |
1.68 |
1.31-2.16 |
<0.001 |
R |
58.8 |
0.001 |
|
Age matched |
11 |
1.51 |
1.07-2.13 |
0.019 |
R |
64.0 |
0.002 |
|
GA vs AA |
overall |
19 |
1.26 |
1.09-1.46 |
0.002 |
R |
40.4 |
0.036 |
Asian |
6 |
1.58 |
1.24-2.01 |
<0.001 |
F |
37.6 |
0.156 |
|
Caucasian |
13 |
1.19 |
1.06-1.34 |
0.003 |
F |
35.3 |
0.100 |
|
RFLP |
16 |
1.26 |
1.11-1.42 |
<0.001 |
F |
26.9 |
0.153 |
|
HWE |
17 |
1.25 |
1.07-1.47 |
<0.001 |
R |
46.0 |
0.020 |
|
Age matched |
11 |
1.21 |
1.01-1.45 |
0.039 |
R |
44.8 |
0.053 |
|
Abbreviations: OR, odds ratio; CI, confidence intervals; HWE, Hardy-Weinberg equilibrium, RFLP, restriction fragment length polymorphism.
The overall ORs for GG vs. AA (OR1), GA vs. AA (OR2), and GG vs. GA (OR3) were 1.75, 1.26, and 1.35, respectively (Table 3). These findings indicate OR1>OR2>1 and OR1>OR3>1; therefore, a codominant model was suggested. Then, this meta-analysis estimated the gene effects for GG vs. AA and GA vs. AA. Significant heterogeneity was present for both OR1 (I2=57.5% and P=0.001) and OR2 (I2=40.4% and P=0.036). Thus, a random effects model was applied, and the overall gene effect was significant with a pooled OR1 and OR2 of 1.75 (95%CI=1.37-2.24, Figure 2) and 1.26 (95%CI=1.09-1.46), respectively. When using TSA, although the size of the samples in this meta-analysis did not reach the required sample size (17,973 for the GG vs. AA model, 12,558 for the GA vs. AA model), the cumulative Z-curve crossed the trial sequential monitoring boundary, establishing sufficient and conclusive evidence (Figure 3 and Supplementary Figure 1).
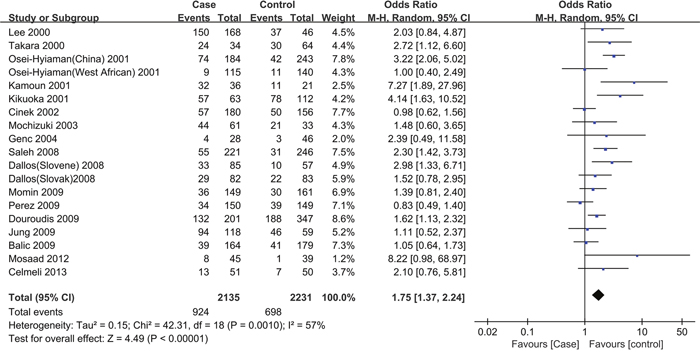
Figure 2: Forest plot for the association between CTLA-4 +49A/G polymorphisms and the risk of T1D in children (a codominant model: GG vs. AA). Using a random effect model. The squares and horizontal lines correspond to the studyspecific OR and 95 % CI. The diamond represents the summary OR and 95 % CI
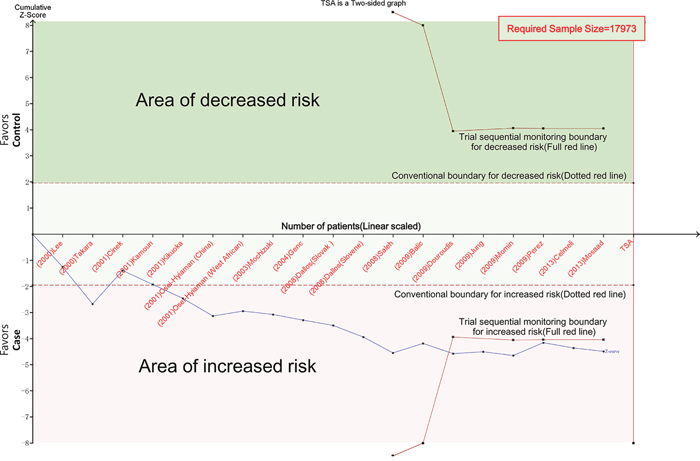
Figure 3: Trial sequential analysis for codominant model (GG vs. AA). The cumulative Z-curve (blue line) crossed the trial sequential monitoring boundary (red line), establishing sufficient and conclusive evidence. X-axis: the number of patients randomized; Y-axis: the cumulative Z-Score; α = 0.05 (two sided), β = 0.20 (power 80%), an anticipated relative risk reduction of 20%.
The results of the stratified analyses were not significantly different from the overall results (Table 3). The ORs for the Asian population (ORallelic model=1.60, ORGG vs. AA=2.46 and ORGA vs. AA=1.58) were higher than the ORs for the Caucasian population (ORallelic model==1.24, ORGG vs. AA=1.55 and ORGA vs. AA=1.19). The OR value decreased in the age-matched subgroup in comparison to the pooled results.
Heterogeneity analysis
An exploration of the sources of heterogeneity was performed using a subgroup analysis stratified by ethnicity, genotyping method, and HWE. As shown in Table 3 and Figure 4, a comparison of GA vs. AA revealed that heterogeneity was significantly reduced in the subgroup analysis stratified by ethnicity and genotyping method. This suggests that ethnicity and the genotyping method are the main source of heterogeneity. The pooled OR value did not change significantly in the heterogeneity analysis.
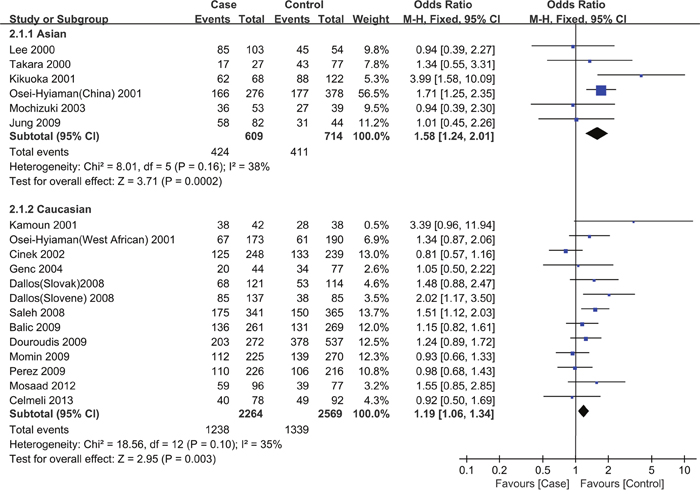
Figure 4: Forest plot for the association between CTLA-4 +49A/G polymorphisms and the risk of T1D in children stratified by ethnicity (a codominant model: GA vs. AA). Using a fixed effect model. The squares and horizontal lines correspond to the studyspecific OR and 95 % CI. The diamond represents the summary OR and 95 % CI
Sensitivity analysis
Two studies that did not apply the HWE principle were first excluded in the sensitivity analysis, and this did not change the significance of all the ORs (Table 3). Two studies with different genotyping methods were further excluded, as shown in Table 3 (the subgroup analysis for the RFLP group), and the recalculated pooled OR did not change significantly. Finally, a sensitivity analysis was performed by excluding each study, one-by-one, and no statistically significant changes in the ORs were observed (data not shown).
Publication bias
Figure 5 shows the funnel plots for GG vs. AA and GA vs. AA. The two funnel plots were symmetrical. Begg’s funnel plot and Egger’s test were also conducted, and the statistical results showed evidence of funnel plot symmetry (PEgger’s test>0.05).
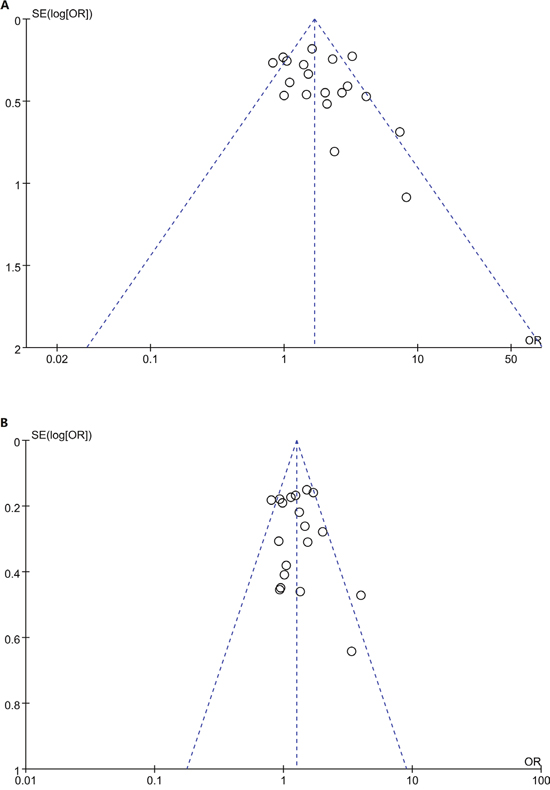
Figure 5: Funnel plot for studies of the association between CTLA4 +49A/G polymorphism and T1D risk in children in codominat model. A. GG vs. AA; B GA vs. AA. The horizontal and vertical axes correspond to the OR and 95% CI.
DISCUSSION
In this study, we found that children carrying the G allele in CTLA4 +49A/G had a 1.33-fold increased risk of developing T1D in comparison to children carrying the A allele; children who had a GG or GA genotype had a 1.75- or 1.26-fold higher risk, respectively, of developing T1D than children who had the AA genotype. These risk effects were further confirmed by TSA.
Hamzeh et al. [35] found that the alleles HLA-DQB1 *02:01 and *03:02 and the haplotypes DR3 and DR4 were significant risk factors for T1D. In contrast, HLA-DQA1*01:01, DQB1*05:03, *06:02, *06:03, and *06:04 were protective factors against T1D. It has been found that HLA-DQ- and HLA-DRB1-containing genotypes contribute to about 50% of the risk associated with developing T1D [36, 37]. Other genes, such as insulin, protein tyrosine phosphatase, non-receptor type 22 (PTPN22), and interleukin 2 receptor alpha (IL2RA), are also candidate genes that are associated with the risk of T1D [6]. Hence, current evidence supports the hypothesis that T1D is due to interactions between the environment and genetic factors, and genetic variation has a clinically important impact on the risk of T1D. Considering the sufficient evidence from the TSA results, we recommend CTLA4 +49A/G as a genetic marker to assess the T1D risk for children in clinical contexts.
Our results were partly consistent with a meta-analysis performed by Luo et al. [20] in 2012 (OR=1.21, 95%CI=1.09-1.33 for the G vs. A allele; OR=1.42, 95%CI=1.16-1.75 for the GG vs. AA genotype). In contrast, we further observed a 1.26-fold higher risk for children who had the GA genotype in comparison to those carrying the AA genotype. The inconsistent results may be due to the larger number of studies and the larger sample size in our meta-analysis (19 studies vs. 10 studies [18], and 7,778 vs. 2,422 subjects [18]). In addition, we also applied TSA to estimate the threshold for statistical significance according to the quantified strength of the evidence. The TSA results showed insufficient evidence of the effect, and they were potentially spurious in the meta-analysis performed by Luo et al. (Supplementary Figure 2. GG vs. AA); in contrast, our study established sufficient and conclusive evidence. Another difference between our study and previous meta-analysis [18] was that we used the best genetic model to avoid the problem of multiple comparisons. Therefore, we believe that our results are more robust than previous findings.
The development of T1D in children has been shown to be caused by different genetic susceptibility factors between different populations [6]. Indeed, the incidence of T1D in children varies geographically—e.g., it is lowest in China and Venezuela and highest in Finland and Sardinia; moreover, the trends estimated for continents showed a 4.0% increase in T1D in Asia, which is higher than the increase in Europe (3.2%) [38]. Chen et al. [16] found a wide variation in the risk allele frequency of the CTLA4 +49A/G polymorphism among the controls across different ethnicities. Our study also observed significant difference in the allele and genotypes frequencies in CTLA4 +49A/G polymorphisms between Asian and Caucasian children. Hence, we also conducted a subgroup analysis stratified by ethnicity. The association between CTLA-4 +49A/G polymorphisms and the risk of T1D was greater in Asian children than in Caucasian children, which is consistent with the results of a meta-analysis of all ages [14]. However, in a meta-analysis of all ages from 2005, Kavvoura et al. [15] reported that the risk of T1D associated with CTLA-4 +49A/G polymorphisms was higher in Caucasians than in Asians. These inconsistent results are understandable because these meta-analyses reviewed different studies with different sample sizes and different inclusion and exclusion criteria. Moreover, other basic characteristics, such as gender and lifestyle, should be considered when explaining the differences.
It should be noted that this present study examined significant heterogeneity. Therefore, we performed a subgroup analysis of ethnicity, HWE, and genotyping methods, and the differences between the case studies and the control studies. As expected, heterogeneity decreased significantly in the subgroup stratified by ethnicity, which not only strongly confirms that different races are the main source of heterogeneity in this meta-analysis, but also indicates the different degree of risk of T1D associated with CTLA4 +49A/G polymorphisms in different ethnicities. Therefore, because only Asian and Caucasian children were studied in this meta-analysis, further studies on other races are needed.
Our meta-analysis has several limitations. First, we detected substantial heterogeneity between the examined studies, which would influence the reliability of our conclusions, even if the corresponding pooled OR value was not significantly changed in the sensitivity analysis. Second, we restricted the research to English publications. In addition, one of the included studies focused on West African children. Therefore, potential publication bias should be noted, although a Begg’s funnel plot and an Egger’s test showed no publication bias. Third, the implementation of some of the studies was reported poorly. As shown in Table 2 and Table 3, some studies selected healthy adults as controls, and some studies did not apply the HWE principle, which could lead to false-negative or false-positive results. Fortunately, the results were not significantly changed after we excluded those studies. Finally, since approximately 50% of the genetic risk of T1D is conferred by HLA genotypes [39], theoretically, the normalization procedure used in our meta-analysis should remove any influence that HLA genotypes could have on the risk of T1D in children. However, few studies have examined HLA and CTLA4 together; thus, this should be investigated in future studies.
Despite these limitations, the present study has some advantages in comparison to previous studies. First, we used TSA to determine the association between the risk of childhood T1D and CTLA4 +49A/G polymorphisms. The TSA results demonstrate that the current evidence is sufficient, thereby suggesting that our results are reliable. Second, this study has more statistical power than previous meta-analyses, and we also selected the best genetic model to avoid multiple comparisons. Third, our study was performed using PRISMA guidelines and the recommendations of the Cochrane Collaboration, although our study was not registered with any specific protocol. In summary, our study is the most recent and the most comprehensive meta-analysis of this topic to date. CTLA4 +49A/G can be considered to be a genetic marker for T1D in children.
MATERIALS AND METHODS
This study was performed according to the Preferred Reporting Items for Systematic Reviews and Meta-analyses (PRISMA) 2009 statement [40](Supplementary Table 1). There was no registered protocol.
Search strategy
Two investigators (Bo Wang and Wei Du) conducted a systematic literature search of the EMBASE, PubMed, and Cochrane Library databases for papers related to the studied topic that were published up to March 30, 2016. The following search terms were used: T1DM or T1D or type 1 diabetes or type 1 diabetes mellitus in combination with polymorphism or polymorphisms in combination with CTLA4 or Cytotoxic T-Lymphocyte Associated Antigen-4 or rs231775 in combination with children or child or childhood. In addition, reference lists in the relevant publications were also hand-searched to identify additional records. Only English publications were searched.
Selection criteria
Two reviewers (Bo Wang and Wei Du) identified eligible articles based on a full-text review. To be included, studies had to be case-control or cohort studies describing the association between CTLA4 +49A/G polymorphisms and T1D risk in children (≤16 years); moreover, the genotype frequencies of CTLA4 +49A/G loci in the cases and controls could be extracted from these studies (or could be obtained after contacting the authors).
Exclusion criteria were: studies with a sample size <100 for limited statistic power; in addition, family-based studies, review articles, letters, case reports, editorials, and conference abstracts were also excluded. Any disagreement was resolved by consensus.
Data extraction
Two investigators (Bo Wang and Wei Du) independently extracted data from the included studies, and it was critical that the final data extracted by the two investigators be the same. Disagreements were resolved by discussion and consensus. The data included: the first author’s name, year of publication, the country and ethnicity of the cases, the age of the patients and healthy controls, the sample size, the diagnosis criteria, the genotyping method, and the genotype frequencies of the cases and controls. Hardy-Weinberg equilibrium (HWE) was calculated from the extracted data. A single article with different populations was further categorized as different studies. If the literature did not provide sufficient data, the investigators tried to contact the author by email to obtain the original data.
Risk of bias assessment
To assess the quality of each study, we used the widely-used quality assessment criteria for genetic association studies defined by Thakkinstian et al. [41], with some of the criteria modified according to the study by Dong et al.[42](Supplementary Table 2). The score consists of the following factors: ascertainment of diagnosis of T1D and controls, quality control for genotyping, population stratification, confounding bias, selective reporting (for replication studies), and HWE in the control group. Each factor was rated using the following question: Is there a low risk of bias? If the answer was “Yes”, a low risk of bias was indicated; if the answer was “No” a high risk, of bias was indicated. If the answer was “Unclear”, insufficient information was available for the assessment.
Statistical analysis
In this study, unadjusted odds ratios (ORs) and the corresponding 95% confidence intervals (CIs) were used to measure the strength of the association between CTLA4 gene +49A/G polymorphisms and T1D risk in children. Previous studies have indicated that G is the risk allele; therefore, we first calculated the ORs of GG vs. AA (OR1), GA vs. AA (OR2), and GG vs. GA (OR3), and we then selected the best genetic model based on the meta-analysis method used in molecular association studies [43].
To assess for the heterogeneity of the ORs across studies, the Cochrane Q statistic and I-squared (I2) statistic were calculated, and a fixed effects model was used if I2<50% and P≥0.1, whereas a random effects model was used if I2≥50% and P<0.1 [44, 45]. The HWE in each study was assessed using the chi-square test for goodness of fit only in the control groups, and a P-value <0.05 was considered to be out of HWE. If significant heterogeneity was found in a compared genetic model, a subgroup analysis of ethnicity, genotyping methods, and HWE was conducted.
The stability of the results was assessed using sensitivity analysis. This method omits a study, one-by-one, and then recalculates the pooled ORs. If the ORs did not change significantly, the results were considered robust. The possibility of publication bias was assessed using Begg’s funnel plot and Egger’s test [46, 47].
Analyses were performed using STATA software (version 12.0; Stata Corporation, College Station, Texas, USA) and RevMan 5.3 (Cochrane Collaboration).
Trial sequential analysis
Meta-analyses may result in type I errors due to random error from the studies included in the meta-analysis that had a small sample size, publication bias, and low quality, and studies whose conclusions tended to be changed by later studies with a larger sample size [48]. TSA can overcome these limitations and further reveal insufficient information size and potentially false positive results in a meta-analysis [48, 49]. Therefore, we performed TSA according to an overall 5% risk of a type I error, a power of 80%, and relative risk reduction of 20%. TSA software version 0.9 beta (http://www.ctu.dk/tsa) was used in this study. When the cumulative Z-curve crosses the trial sequential monitoring boundary or enters the futility area, a sufficient level of evidence may have been reached, and no further trials are needed. If the cumulative Z-curve does not cross any of the boundaries, and the required information size has not been reached, there is insufficient evidence to reach a conclusion [50].
CONFLICTS OF INTEREST
The authors declare that they have no conflicts of interest.
Author contributions
Conceived and designed the experiments: GM and BW. Performed the experiments: BW and WD. Analyzed the data: BW and WD. Contributed reagents/materials/analysis tools: YJ and XZ. Wrote the paper: BW and WD. Revised the manuscript: GM.
REFERENCES
1. Daneman D: Type 1 diabetes. Lancet 2006, 367:847-858.
2. Harjutsalo V, Sjoberg L, Tuomilehto J: Time trends in the incidence of type 1 diabetes in Finnish children: a cohort study. Lancet 2008, 371:1777-1782.
3. Nerup J, Platz P, Andersen OO, Christy M, Lyngsoe J, Poulsen JE, Ryder LP, Nielsen LS, Thomsen M, Svejgaard A: HL-A antigens and diabetes mellitus. Lancet 1974, 2:864-866.
4. Anaya JM, Castiblanco J, Tobon GJ, Garcia J, Abad V, Cuervo H, Velasquez A, Angel ID, Vega P, Arango A: Familial clustering of autoimmune diseases in patients with type 1 diabetes mellitus. J Autoimmun 2006, 26:208-214.
5. Hyttinen V, Kaprio J, Kinnunen L, Koskenvuo M, Tuomilehto J: Genetic liability of type 1 diabetes and the onset age among 22,650 young Finnish twin pairs: a nationwide follow-up study. Diabetes 2003, 52:1052-1055.
6. Polychronakos C, Li Q: Understanding type 1 diabetes through genetics: advances and prospects. Nat Rev Genet 2011, 12:781-792.
7. Ligers A, Teleshova N, Masterman T, Huang WX, Hillert J: CTLA-4 gene expression is influenced by promoter and exon 1 polymorphisms. Genes and immunity 2001, 2:145-152.
8. Momin S, Flores S, Angel BB, Codner DE, Carrasco PE, Perez-Bravo F: Interactions between programmed death 1 (PD-1) and cytotoxic T lymphocyte antigen 4 (CTLA-4) gene polymorphisms in type 1 diabetes. Diabetes research and clinical practice 2009, 83:289-294.
9. Lombardi A, Menconi F, Greenberg D, Concepcion E, Leo M, Rocchi R, Marino M, Keddache M, Tomer Y: Dissecting the Genetic Susceptibility to Graves' Disease in a Cohort of Patients of Italian Origin. Front Endocrinol 2016, 7:21.
10. Devaraju P, Gulati R, Singh BK, Mithun CB, Negi VS: The CTLA4 +49 A/G (rs231775) polymorphism influences susceptibility to SLE in South Indian Tamils. Tissue Antigens 2014, 83:418-421.
11. Khodaeian M, Enayati S, Tabatabaei-Malazy O, Amoli MM: Association between Genetic Variants and Diabetes Mellitus in Iranian Populations: A Systematic Review of Observational Studies. Journal of diabetes research 2015, 2015:585917.
12. Nistico L, Buzzetti R, Pritchard LE, Van der Auwera B, Giovannini C, Bosi E, Larrad MT, Rios MS, Chow CC, Cockram CS et al: The CTLA-4 gene region of chromosome 2q33 is linked to, and associated with, type 1 diabetes. Belgian Diabetes Registry. Human molecular genetics 1996, 5:1075-1080.
13. Yanagawa T, Maruyama T, Gomi K, Taniyama M, Kasuga A, Ozawa Y, Terauchi M, Hirose H, Maruyama H, Saruta T: Lack of association between CTLA-4 gene polymorphism and IDDM in Japanese subjects. Autoimmunity 1999, 29:53-56.
14. Chen Z, Fei M, Fu D, Zhang L, Ma Y, Wang Y, Zhang F, Xia Q, Wang X: Association between cytotoxic T lymphocyte antigen-4 polymorphism and type 1 diabetes: a meta-analysis. Gene 2013, 516:263-270.
15. Kavvoura FK, Ioannidis JP: CTLA-4 gene polymorphisms and susceptibility to type 1 diabetes mellitus: a HuGE Review and meta-analysis. American journal of epidemiology 2005, 162:3-16.
16. Si X, Zhang X, Luo Y, Tang W: Association between the CTLA-4 +49A/G polymorphism and type 1 diabetes: a meta-analysis. Genet Test Mol Biomarkers 2012, 16:1336-1342.
17. Tang ST, Tang HQ, Zhang Q, Wang CJ, Wang YM, Peng WJ: Association of cytotoxic T-lymphocyte associated antigen 4 gene polymorphism with type 1 diabetes mellitus: a meta-analysis. Gene 2012, 508:165-187.
18. Luo SY, Tan LN, Wei HY, Zhang YD, Chen YX: [Association of cytotoxic T lymphocyte-associated antigen-4+49A/G polymorphism with childhood type 1 diabetes mellitus: a meta-analysis]. Zhongguo Dang Dai Er Ke Za Zhi 2012, 14:683-688.
19. Lee YJ, Huang FY, Lo FS, Wang WC, Hsu CH, Kao HA, Yang TY, Chang JG: Association of CTLA4 gene A-G polymorphism with type 1 diabetes in Chinese children. Clin Endocrinol 2000, 52:153-157.
20. Kikuoka N, Sugihara S, Yanagawa T, Ikezaki A, Kim HS, Matsuoka H, Kobayashi Y, Wataki K, Konda S, Sato H et al: Cytotoxic T lymphocyte antigen 4 gene polymorphism confers susceptibility to type 1 diabetes in Japanese children: analysis of association with HLA genotypes and autoantibodies. Clin Endocrinol 2001, 55:597-603.
21. Osei-Hyiaman D, Hou L, Zhiyin R, Zhiming Z, Yu H, Amankwah AA, Harada S: Association of a novel point mutation (C159G) of the CTLA4 gene with type 1 diabetes in West Africans but not in Chinese. Diabetes 2001, 50:2169-2171.
22. Cinek O, Drevinek P, Sumnik Z, Bendlova B, Kolouskova S, Snajderova M, Vavrinec J: The CTLA4 +49 A/G dimorphism is not associated with type 1 diabetes in Czech children. European journal of immunogenetics 2002, 29:219-222.
23. Dallos T, Avbelj M, Barak L, Zapletalova J, Pribilincova Z, Krajcirova M, Kostalova L, Battelino T, Kovacs L: CTLA-4 gene polymorphisms predispose to autoimmune endocrinopathies but not to celiac disease. Neuro endocrinology letters 2008, 29:334-340.
24. Saleh HM, Rohowsky N, Leski M: The CTLA4 -819 C/T and +49 A/G dimorphisms are associated with Type 1 diabetes in Egyptian children. Indian J Hum Genet 2008, 14:92-98.
25. Jung MH, Yu J, Shin CH, Suh BK, Yang SW, Lee BC: Association of cytotoxic T lymphocyte antigen-4 gene polymorphisms and HLA class II alleles with the development of type 1 diabetes in Korean children and adolescents. J Korean Med Sci 2009, 24:1004-1009.
26. Mosaad YM, Elsharkawy AA, El-Deek BS: Association of CTLA-4 (+49A/G) gene polymorphism with type 1 diabetes mellitus in Egyptian children. Immunol Invest 2012, 41:28-37.
27. Celmeli F, Turkkahraman D, Ozel D, Akcurin S, Yegin O: CTLA-4 (+49A/G) polymorphism and type-1 diabetes in Turkish children. Journal of clinical research in pediatric endocrinology 2013, 5:40-43.
28. Balic I, Angel B, Codner E, Carrasco E, Perez-Bravo F: Association of CTLA-4 polymorphisms and clinical-immunologic characteristics at onset of type 1 diabetes mellitus in children. Human immunology 2009, 70:116-120.
29. Douroudis K, Laine AP, Heinonen M, Hermann R, Lipponen K, Veijola R, Simell O, Knip M, Uibo R, Ilonen J et al: Association of CTLA4 but not ICOS polymorphisms with type 1 diabetes in two populations with different disease rates. Human immunology 2009, 70:536-539.
30. Genc S, Genc K, Sercan O, Kizildag S, Gulay Z, Atay T, Dundar B, Sakizli M, Buyukgebiz A: Analysis of cytotoxic T lymphocyte antigen-4 (CTLA-4) exon 1 polymorphism in patients with type 1 diabetes mellitus in a Turkish population. Journal of pediatric endocrinology & metabolism: JPEM 2004, 17:731-735.
31. Kamoun Abid H, Hmida S, Smaoui N, Kaabi H, Abid A, Chaabouni H, Boukef K, Nagati K: [Association between type 1 diabetes and polymorphism of the CTLA-4 gene in a Tunisian population]. Pathol Biol 2001, 49:794-798.
32. Pérez B F, Codner D E, Angel B B, Balic N I, Carrasco P E: +49 A/G genetic polymorphism of cytotoxic T lymphocyte associated antigen 4 (CTLA-4) in type 1 diabetes: Association with autoantibodies and cytokines. Revista Medica de Chile 2009, 137:321-328.
33. Mochizuki M, Amemiya S, Kobayashi K, Kobayashi K, Shimura Y, Ishihara T, Nakagomi Y, Onigata K, Tamai S, Kasuga A et al: Association of the CTLA-4 gene 49 A/G polymorphism with type 1 diabetes and autoimmune thyroid disease in Japanese children. Diabetes care 2003, 26:843-847.
34. Takara M, Komiya I, Kinjo Y, Tomoyose T, Yamashiro S, Akamine H, Masuda M, Takasu N: Association of CTLA-4 gene A/G polymorphism in Japanese type 1 diabetic patients with younger age of onset and autoimmune thyroid disease. Diabetes care 2000, 23:975-978.
35. Hamzeh AR, Nair P, Al-Khaja N, Al Ali MT: Association of HLA-DQA1 and -DQB1 alleles with type I diabetes in Arabs: a meta-analyses. Tissue Antigens 2015, 86:21-27.
36. Jones EY, Fugger L, Strominger JL, Siebold C: MHC class II proteins and disease: a structural perspective. Nat Rev Immunol 2006, 6:271-282.
37. Noble JA, Valdes AM, Cook M, Klitz W, Thomson G, Erlich HA: The role of HLA class II genes in insulin-dependent diabetes mellitus: molecular analysis of 180 Caucasian, multiplex families. American journal of human genetics 1996, 59:1134-1148.
38. Group DP: Incidence and trends of childhood Type 1 diabetes worldwide 1990-1999. Diabet Med 2006, 23:857-866.
39. Zayed H: Genetic Epidemiology of Type 1 Diabetes in the 22 Arab Countries. Curr Diab Rep 2016, 16:37.
40. Moher D, Liberati A, Tetzlaff J, Altman DG: Preferred reporting items for systematic reviews and meta-analyses: the PRISMA statement. Annals of internal medicine 2009, 151:264-269.
41. Thakkinstian A, McKay GJ, McEvoy M, Chakravarthy U, Chakrabarti S, Silvestri G, Kaur I, Li X, Attia J: Systematic review and meta-analysis of the association between complement component 3 and age-related macular degeneration: a HuGE review and meta-analysis. American journal of epidemiology 2011, 173:1365-1379.
42. Dong F, Yang G, Pan HW, Huang WH, Jing LP, Liang WK, Zhang N, Zhang BH, Wang M, Liu Y et al: The association of PTPN22 rs2476601 polymorphism and CTLA-4 rs231775 polymorphism with LADA risks: a systematic review and meta-analysis. Acta diabetologica 2014, 51:691-703.
43. Thakkinstian A, McElduff P, D'Este C, Duffy D, Attia J: A method for meta-analysis of molecular association studies. Statistics in medicine 2005, 24:1291-1306.
44. Higgins J, Thompson SG: Quantifying heterogeneity in a meta-analysis. Statistics in medicine 2002, 21:1539-1558.
45. Higgins JP, Thompson SG, Deeks JJ, Altman DG: Measuring inconsistency in meta-analyses. BMJ 2003, 327:557.
46. Begg CB, Mazumdar M: Operating characteristics of a rank correlation test for publication bias. Biometrics 1994, 50:1088-1101.
47. Egger M, Davey Smith G, Schneider M, Minder C: Bias in meta-analysis detected by a simple, graphical test. Bmj 1997, 315:629-634.
48. Brok J, Thorlund K, Gluud C, Wetterslev J: Trial sequential analysis reveals insufficient information size and potentially false positive results in many meta-analyses. J Clin Epidemiol 2008, 61:763-769.
49. Wetterslev J, Thorlund K, Brok J, Gluud C: Trial sequential analysis may establish when firm evidence is reached in cumulative meta-analysis. J Clin Epidemiol 2008, 61:64-75.
50. K. Thorlund JE, J. Wetterslev, J. Brok, G. Imberger, C. Gluud: User Manual for Trial Sequential Analysis (TSA). Copenhagen Trial Unit, Centre for Clinical Intervention Research 2011:1-115.