
INTRODUCTION
Literature recording of Ganoderma lucidum (Fr.) P. Karst. (Ganodermataceae) was first found in Sheng Nong’s Herbal Classic over two thousand years ago. Since then, fungi have been used as traditional Chinese medicines for the prevention or treatment of various chronic diseases [1, 2]. As research on the chemical constituents of these medicinal or edible fungi has increased, there is pre-clinical evidence for G. lucidum in an array of settings including cancer treatment [3–6], diabetic control [7–9], hepato-protection [10–13], antiviral treatment [14], and immune-modulation [15, 16].
In particular, G. lucidum in cancer research has become more prominent over the recent decades. Triterpenoids and polysaccharides are believed to form the pharmacodyamic material basis of the demonstrated anti-cancer effects. Lanostane-type triterpenoids are typical constituents of G. lucidum. Since the first triterpenoids (ganoderic acid A) were reported by Kubota in 1982, over 150 compounds have been isolated and reported in G. lucidum [17], with the number continually increasing. In order to search for bioactive anti-tumor metabolites, we launched a systematic study of the chemical constituents extracted from G. lucidum and other members of medicinal mushrooms [18–22]. In the present study, 35 triterpenoids were isolated, including 5 novel compounds. We then performed structural elucidation and cytotoxic assays using these compounds, and built 3D-QSAR models to predict anti-cancer activity.
RESULTS AND DISCUSSION
Repeated column chromatography of the CHCl3-soluble fraction from the ethyl acetate extract of the fruiting bodies of Ganoderma lucidum resulted in the isolation of 30 known compounds (Compounds 6–35, Figure 1) and five new compounds (Compounds 1–5, Figure 2). The known compounds were identified as ganoderiol D (6) [23], ganoderiol F (7) [23], ganoderiol B (8) [14], ganoderiol E (9) [23], ganoderic acid β (10) [24], ganoderic acid A (11) [25], ganoderic acid B (12) [25], ganoderic acid C (13) [26], ganoderic acid D2 (14) [26], 12β-hydroxy-3,7,11,15,23-pentaoxo-lanosta-8-en-26-oic acid (15) [27], ganodermanontriol (16) [28], 3, 7, 11-trione-24(S), 25-dihydroxy-lanosta-8-ene (17) [29], ganoderitriol M (18) [30], lucidumol A (19) [14], lucidadiol (20) [31], ganoderiol A (21) [32], 24R, 25S, 26-trihydroxy-lanosta-7,9(11)-dien-3-one (22) [33], lucidumol B (23) [28], ganodermanondiol (24) [28], lucidenic acid A (25) [34], ganolucidic acid A (26) [35], ganoderic acid J (27) [36], methyl lucidenate A (28) [37], ganoderic acid E (29) [38], ganoderenic acid d (30) [27], ganoderic acid C2 (31) [37], ganoderic acid F (32) [38], ganoderic acid G (33) [27], ganoderic acid H (34) [38] and ganoderic acid AM (35) [39].
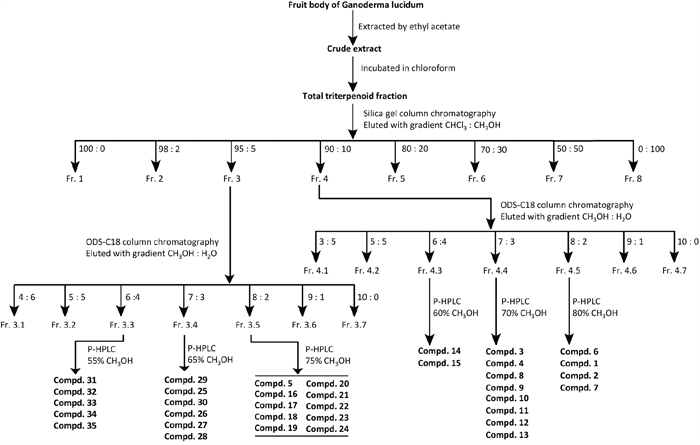
Figure 1: Purification procedure of compounds 1-35 from the fruit bodies of G. lucidum. The purification procedure was started with the fruit body of Ganoderma lucidum. Each step is indicated by one arrow. Each Fraction (Fr.) was collected separately for further purification. Each compound (Compd.) was obtained in the final step and stored at -20 °C for further analysis.
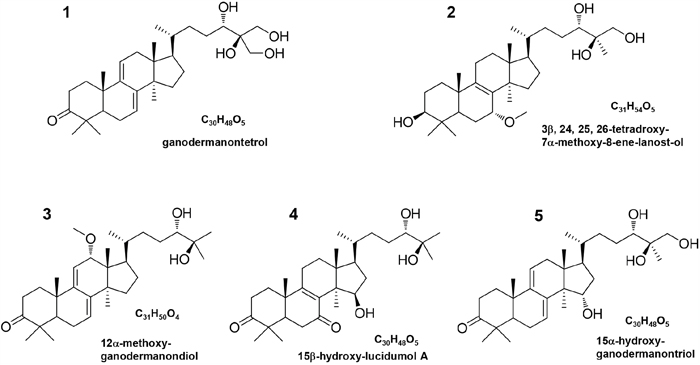
Figure 2: Structures and names of new compounds 1–5.
Compound 1 was isolated as a white powder, [α]D25 = +13.4 (c 0.20, CHCl3). Its HR-ESI-MS spectrum gave a molecular ion peak at m/z 484.3187 corresponding to the molecular formula C30H48O5. The 1H NMR spectrum of compound 1 (Table 1) was indicative of five tertiary methyls (δH 1.21, 1.12, 1.09, 0.86, 0.64) and a secondary methyl [δH 0.91 (d, J = 6.0 Hz)] group, two oxygen bearing methylene signal [δH 3.45 (m) and 3.52 (m)], and one oxygen bearing methine signal [δH 3.45 (m)], two olefinic protons [δH 5.51 (dd, J = 6.0, 1.8 Hz) and 5.40 (dd, J = 6.0, 1.8 Hz)], respectively. The 13C NMR (Table 2) and DEPT-135 spectra exhibited the presence of 30 carbons due to six methyls, ten methylenes including two oxymethylenes, six methines including an oxymethine and eight quaternary carbons including a keto carbonyl. Comparison of these spectroscopic data with those of ganodermanontriol (16) [28], it was suggested that the skeleton moiety of compound 1 was almost the same except that one methyl in the side-chain was oxidized to hydroxymethyl. The location of the hydroxymethyl group was confirmed by the analysis of its HMBC spectrum. In the HMBC spectrum, there were correlations between the proton signals at δH 3.45 (H2-26, m), 3.52 (H2-27, m) and the carbon resonance at δC 70.9 (C-24), and between the proton signals at δH 3.45 (H-24, m) and the carbon signal at δC 62.2 (C-26) and 62.8 (C-27) (Figure 3). Thus, the structure of compound 1 was determined to be ganodermanontetrol. As compound 1 was derived from ganodermanontriol (16), it would have the same absolute configuration with ganodermanontriol. Consequently, the absolute configuration of C-24 in compound 1 was assigned as 24S.
Table 1: 1H NMR spectral data of compounds 1−5a in CDCl3
1 |
2 |
3 |
4 |
5 |
|
|---|---|---|---|---|---|
1 |
2.37 (1H, m) a, 1.80 (1H, m) |
1.79 (2H, m) |
2.10 (1H, m), 1.75 (1H, m) |
2.10 (1H, m), 1.75 (1H, m) |
2.35 (1H,m), 1.80 (1H,m) |
2 |
2.75 (1H, m), 2.35 (1H, m) |
2.72 (1H, m), 2.23 (1H,m) |
2.63 (2H, m) |
2.63 (2H, m) |
2.70 (2H,m) |
3 |
3.25 (1H,m) |
||||
4 |
|||||
5 |
1.56 (1H, m) |
1.65 (1H, m) |
1.47 (1H, m) |
1.47 (1H, m) |
1.57 (1H,m) |
6 |
2.10 (2H, m) |
2.40 (2H, m) |
2.42 (2H, m) |
2.42 (2H, m) |
2.08 (2H,m) |
7 |
5.51 (1H, dd, 6.0,1.8) |
4.12 (1H, br.s) |
5.52 (1H,dd, 6.0,1.8) |
||
8 |
|||||
9 |
|||||
10 |
|||||
11 |
5.40 (1H,dd, 6.0,1.8) |
2.17 (2H, m) |
2.31 (2H, m) |
2.31 (2H, m) |
5.39 (1H,dd, 6.0,1.8) |
12 |
2.19 (2H, m) |
1.89 (2H, m) |
4.37 (1H, m) |
1.79 (2H, m) |
2.20 (2H,m) |
13 |
— |
||||
14 |
— |
||||
15 |
1.68 (1H, m), 1.41 (1H, m) |
1.57 (2H, m) |
1.79 (2H, m) |
4.37 (1H, m) |
4.28 (1H, m) |
16 |
2.05 (1H, m), 1.37 (1H, m) |
2.00 (2H, m), |
2.35 (2H, m) |
2.35 (2H, m) |
2.05 (2H,m) |
17 |
1.60 (1H, m) |
1.58 (1H, m) |
1.59 (1H, m) |
1.59 (1H, m) |
1.60 (1H,m) |
18 |
0.64 (3H, s) |
0.66 (3H, s) |
0.62 (3H, s) |
0.62 (3H, s) |
0.62 (3H,s) |
19 |
1.09 (3H, s) |
1.19 (3H, s) |
1.32 (3H, s) |
1.32 (3H, s) |
1.09 (3H,s) |
20 |
1.50 (1H, m) |
1.47 (1H, m) |
1.45 (1H, m) |
1.45 (1H, m) |
1.49 (1H,m) |
21 |
0.91 (3H, d, 6.0) |
0.94 (3H, d, 6.0) |
0.93 (3H,d, 5.4) |
0.93 (3H,d, 5.4) |
0.91 (3H,d, 6.0) |
22 |
1.58 (1H, m), 1.04 (1H, m) |
1.49 (1H, m), 1.05 (1H, m) |
1.58 (1H, m), 1.04 (1H, m) |
1.58 (1H, m), 1.04 (1H, m) |
1.55 (1H,m), 1.05 (1H,m) |
23 |
1.72 (2H, m), |
1.67 (2H, m), |
1.78 (1H, m), 1.53 (1H, m) |
1.78 (1H, m), 1.53 (1H, m) |
1.78 (1H,m), 1.53 (1H,m) |
24 |
3.45 (1H, m) |
3.52 (1H, m) |
3.29 (1H, d, 9.6) |
3.29 (1H, d, 9.6) |
3.45 (1H,m) |
25 |
|||||
26 |
3.45 (2H, m) |
3.82 (2H, d, 11.4) |
1.12 (3H, s) |
1.12 (3H, s) |
3.82 (2H, d, 11.4) |
27 |
3.52 (2H, m) |
1.20 (3H, s) |
1.22 (3H, s) |
1.22 (3H, s) |
1.20 (3H,s) |
28 |
0.86 (3H, s) |
0.83 (3H, s) |
1.10 (3H, s) |
1.10 (3H, s) |
0.86 (3H,s) |
29 |
1.12 (3H, s) |
1.06 (3H, s) |
1.09 (3H, s) |
1.09 (3H, s) |
1.12 (3H,s) |
30 |
1.21 (3H, s) |
1.12 (3H, s) |
1.16 (3H, s) |
1.16 (3H, s) |
1.21 (3H,s) |
-OCH3 |
3.38 (3H, s) |
3.34 (1H, s) |
a means multiplet or overlapped with other signals.
Table 2: 13C NMR spectral data of compounds 1−5 in CDCl3
1 |
2 |
3 |
4 |
5 |
|
|---|---|---|---|---|---|
1 |
36.6 |
35.0 |
36.5 |
35.4 |
36.6 |
2 |
34.9 |
27.7 |
34.7 |
34.4 |
34.8 |
3 |
216.6 |
78.5 |
216.4 |
215.0 |
216.9 |
4 |
47.5 |
38.6 |
47.4 |
47.2 |
47.4 |
5 |
50.3 |
48.2 |
50.4 |
49.7 |
50.5 |
6 |
23.8 |
24.0 |
23.5 |
37.2 |
23.7 |
7 |
119.8 |
76.1 |
124.1 |
198.0 |
119.8 |
8 |
142.9 |
135.7 |
142.2 |
139.6 |
142.9 |
9 |
144.5 |
139.5 |
149.9 |
162.8 |
144.5 |
10 |
37.3 |
37.5 |
38.5 |
39.3 |
37.3 |
11 |
117.3 |
21.5 |
118.2 |
23.8 |
117.3 |
12 |
37.8 |
30.2 |
79.2 |
30.2 |
37.8 |
13 |
43.8 |
45.0 |
49.0 |
45.0 |
43.8 |
14 |
50.7 |
49.7 |
52.9 |
51.5 |
52.1 |
15 |
31.5 |
31.8 |
31.0 |
73.4 |
74.2 |
16 |
27.9 |
28.5 |
27.0 |
39.7 |
40.3 |
17 |
51.0 |
49.6 |
52.5 |
50.5 |
50.2 |
18 |
15.7 |
16.3 |
11.7 |
15.9 |
15.7 |
19 |
22.5 |
17.5 |
21.7 |
17.9 |
22.5 |
20 |
36.5 |
36.4 |
35.6 |
36.2 |
36.4 |
21 |
18.6 |
18.5 |
18.4 |
18.4 |
18.6 |
22 |
31.4 |
34.5 |
34.7 |
34.7 |
34.4 |
23 |
28.9 |
28.8 |
28.7 |
28.7 |
28.9 |
24 |
70.9 |
79.5 |
79.7 |
79.7 |
79.3 |
25 |
74.9 |
73.5 |
74.5 |
73.7 |
73.8 |
26 |
62.2 |
67.7 |
26.5 |
26.5 |
67.9 |
27 |
62.8 |
22.2 |
23.2 |
23.2 |
22.0 |
28 |
25.4 |
27.4 |
27.6 |
27.6 |
25.4 |
29 |
25.3 |
15.4 |
20.2 |
20.2 |
21.2 |
30 |
21.2 |
25.2 |
25.5 |
25.5 |
25.3 |
-OCH3 |
55.5 |
55.8 |
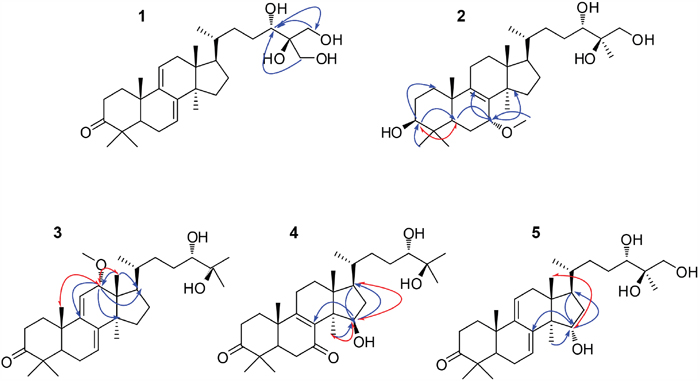
Figure 3: Key HMBC ( ) and ROESY(
 ) correlations of compounds 1−5.
Compound 2 was isolated as a white amorphous powder with optical rotation of +22.6 (c 0.20; CHCl3). The molecular formula of compound 2 was found to be C31H54O5 on the basis of a molecular ion peak at an m/z value of 505.3882 [M - H]- in the HR-ESI-MS. The 1H NMR spectrum of compound 2 (Table 1) displayed signals for six tertiary methyls at δH (1.20, 1.19, 1.12, 1.06, 0.83, 0.66), a secondary methyl at [δH 0.94 (d, J = 6.0 Hz)], an methoxyl at δH 3.38 (3H, s), one oxygen bearing methylene signal at δH 3.82 (2H, d, J = 11.4 Hz), and three oxygen bearing methine signal [δH 4.12 (1H, br.s), 3.52 (1H, m), 3.25 (1H, m)]. The 13C NMR spectrum (Table 2), combined with the DEPT-135 data, showed that compound 2 had 31 carbon signals consisting of eight methyls, ten methylenes, six methines and seven quaternary carbons. Comparison of the NMR data of compound 2 with those of ganoderiol D (6) [23] indicated that they were closely related to their structures, except of two keto carbonyl group at C-3 and C-7 in ganoderiol D being replaced by a hydroxyl and a methoxyl groups in compound 2, respectively. The difference was confirmed by the significant change of the chemical shift value for C-3 and C-7 from δC 214.6 and 198.1 in ganoderiol D to δC 78.5 and 76.1 in compound 2, which was consistent with its molecular formula. The linkage position of the hydroxyl at C-3 was further supported by significant HMBC correlations from δH 3.25 (H-3) to δC 35.0 (C-1) and 48.2 (C-5), from δH 0.83 (H-28) and 1.06 (H-29) to δC 78.5 (C-3) (Figure 3). In addition, the HMBC correlations between δH 4.12 (H-7) to δC 139.5 (C-9) and δC 49.7 (C-14), δH 1.65 (H-5) to δC 76.1 (C-7), and between δH 3.38 (H-31) to δC 76.1 (C-7) indicated the presence of a methoxyl groups at C-7. The configuration of compound 2 was determined by analyzing the NOESY spectrum (Figure 3). Key ROESY correlations were observed between H-3 and H-5, indicating that H-3 was on the α-orientation same as H-5. H-7 resonated as a broad singlet, indicating the presence of β-orientation. On the basis of the above evidence, the structure of compound 2 was identified as 3β, 24S, 25R, 26-tetradroxy-7α-methoxy-8-ene-lanost-ol.
Compound 3 was isolated as a white amorphous powder, [α]D25 = 24.8 (c 0.20, CHCl3). The molecular formula of compound 3 was found to be C31H50O4 on the basis of a molecular ion peak at an m/z value of 485.3642 [M - H] in the HR-ESI-MS. The 1H and 13C NMR spectra displayed were similar to those of compounds 1 and 16. The significant difference was the presence of a methoxyl group connecting to C-12 in compound 3 and a hydroxymethyl at C-26 in compound 16 was deoxidated to a methyl in compound 3. Location of this methoxyl (C-12) was assigned on the basis of the HMBC correlations from δH 0.62 (H-18) to δC 79.2 (C-12) and 52.5 (C-17) and the correlations from δH 4.37 (H-12) to δC 149.9 (C-9), 52.9 (C-14) and 52.5 (C-17). The relative configurations of H-7 and H-12 were assigned as α- and β-orientation, respectively, on the basis of ROESY correlations of H-12 with H3-18 and H3-19 (δH 1.32, s) (Figure 3). Therefore, the structure of compound 3 was elucidated as 12α-methoxy-ganodermanondiol.
The molecular formula of compound 4 was established as C30H48O5 by HR-ESI-MS data. Its 1H and 13C NMR spectroscopic data (Tables 1 and 2) revealed a similar structure to lucidumol A (19) [14] except for an extra hydroxyl [δH 4.37 (m); δC 73.4]. The location of a hydroxy group at C-15 was confirmed by the HMBC correlations from δH 1.16 (H3-30) to C-15, from δH 1.59 (H-17) to C-15, and from H-15 to δC 139.6 (C-8), 50.5 (C-17) and 25.5 (C-30) (Figure 3). The relative configuration of H-15 was assigned as α-orientation by the ROESY correlations of H-15 with H-17 and H3-30 (Figure 3). Thus, compound 4 was identified as 15β-hydroxy-lucidumol A.
Compound 5 was assigned the molecular formula C30H48O5 by HR-ESI-MS data. A detailed comparison of 1H and 13C NMR spectral data (Tables 1 and 2) between compound 5 and compound 16 indicated that compound 5 was a hydroxylated derivative of compound 16. The hydroxyl moiety was deduced from signals due to one more oxygen bearing methine group (δH 4.28, m; δC 74.2). The HMBC correlations from δH 1.21 (H3-30) to C-15, from δH 1.60 (H-17) to C-15, and from H-15 to δC 142.9 (C-8), 50.2 (C-17) and 25.3 (C-30) (Figure 3) confirmed the hydroxyl at C-15. The β-orientation of H-15 was assigned by the ROESY correlations of H-15 with δH 0.62 (H3-18) (Figure 3). Thus, compound 5 was identified as 15α-hydroxy-ganodermanontriol.
It has been reported that triterpenoids possess cytotoxic activity on human cancer cells. We analyzed the effect of the isolated triterpenoids on human breast cancer cells MDA-MB-231 and hepatocellular cancer cells HepG2, and the results were summarized in Table 3. Among the compounds examined, compounds 1-3 were highly cytotoxic in both types of cancers. Compounds 4, 7, 20 and 24 exhibited moderate cytotoxicity. The rest compounds showed weak inhibition against the cancer cells. Since all compounds displayed similar effects on both cancer cells, we performed cell survival assay using compounds 1-4, 8, 17, 20, 22 and 24 on MDA-MB-231 cells. Compounds 3 and 20 appeared to produce significantly stronger effect on the viability of MDA-MB-231 cells (Table 4).
Table 3: Cytotoxicity of compounds 1–35 against human breast carcinoma cell line MDA-MB-231 and human hepatocellular carcinoma cell line HepG2a
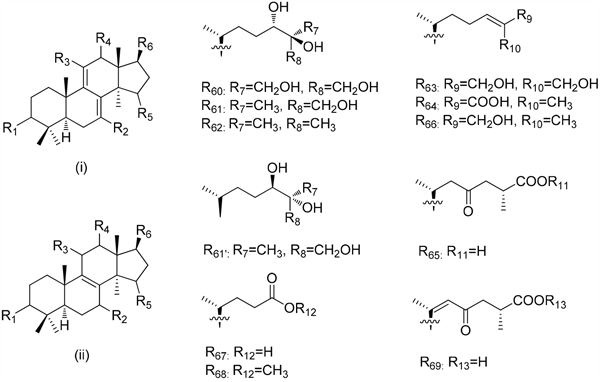
Compounds |
Unit |
R1 |
R2 |
R3 |
R4 |
R5 |
R6 |
IC50 |
|
|---|---|---|---|---|---|---|---|---|---|
MDA-MB-231 |
HepG2 |
||||||||
1 |
i |
=O |
H |
H |
H |
H |
R60 |
53.4 ± 9.9 |
43.7 ± 1.4 |
2 |
ii |
β-OH |
α-OCH3 |
H |
H |
H |
R61 |
35.9 ± 0.4 |
39.3 ± 1.3 |
3 |
i |
=O |
H |
H |
α-OCH3 |
H |
R62 |
21.2 ± 0.7 |
41.5 ± 3.2 |
4 |
ii |
=O |
=O |
H |
H |
β-OH |
R62 |
75.7 ± 1.9 |
82.6 ± 5.8 |
5 |
i |
=O |
H |
H |
H |
α-OH |
R61 |
112.1 ± 2.1 |
56.8 ± 1.7 |
6 |
ii |
=O |
=O |
H |
H |
H |
R61 |
102.3 ± 2.3 |
131.4 ± 3.1 |
7 |
i |
=O |
H |
H |
H |
H |
R63 |
77.0 ± 1.6 |
81.5 ± 2.5 |
8 |
i |
=O |
H |
H |
H |
α-OH |
R63 |
95.6 ± 2.1 |
92.6 ± 3.3 |
9 |
ii |
β-OH |
=O |
H |
H |
H |
R63 |
158.7 ± 3.2 |
>250 |
10 |
ii |
β-OH |
β-OH |
=O |
H |
=O |
R64 |
>250 |
>250 |
11 |
ii |
=O |
β-OH |
=O |
H |
α-OH |
R65 |
>250 |
>250 |
12 |
ii |
β-OH |
β-OH |
=O |
H |
=O |
R65 |
>250 |
>250 |
13 |
ii |
=O |
β-OH |
=O |
H |
=O |
R65 |
>250 |
>250 |
14 |
ii |
=O |
β-OH |
=O |
β-OH |
=O |
R65 |
>250 |
>250 |
15 |
ii |
=O |
=O |
=O |
β-OH |
=O |
R65 |
>250 |
>250 |
16 |
i |
=O |
H |
H |
H |
H |
R61 |
>250 |
>250 |
17 |
ii |
=O |
=O |
=O |
H |
H |
R62 |
92.5 ± 2.4 |
68.5 ± 2.2 |
18 |
ii |
β-OH |
=O |
H |
H |
H |
R62 |
>250 |
>250 |
19 |
ii |
=O |
=O |
H |
H |
H |
R62 |
105.8 ± 2.4 |
89.6 ± 2.0 |
20 |
ii |
β-OH |
=O |
H |
H |
H |
R66 |
76.6 ± 2.3 |
80.7 ± 1.1 |
21 |
i |
β-OH |
H |
H |
H |
H |
R61 |
158.0 ± 2.8 |
97.8 ± 1.7 |
22 |
i |
=O |
H |
H |
H |
H |
R6′ |
105.8 ± 3.1 |
169.4 ± 3.5 |
23 |
i |
β-OH |
H |
H |
H |
H |
R62 |
163.5 ± 2.9 |
146.7 ± 5.6 |
24 |
i |
=O |
H |
H |
H |
H |
R62 |
76.4 ± 0.9 |
51.8 ±1.1 |
25 |
ii |
=O |
β-OH |
=O |
H |
=O |
R67 |
>250 |
>250 |
26 |
ii |
=O |
H |
=O |
H |
α-OH |
R65 |
>250 |
>250 |
27 |
ii |
=O |
=O |
=O |
H |
α-OH |
R65 |
>250 |
>250 |
28 |
ii |
=O |
β-OH |
=O |
H |
=O |
R68 |
158.7 ± 1.7 |
>250 |
29 |
ii |
=O |
=O |
=O |
H |
=O |
R65 |
>250 |
>250 |
30 |
ii |
=O |
β-OH |
=O |
H |
=O |
R69 |
>250 |
>250 |
31 |
ii |
β-OH |
β-OH |
=O |
H |
α-OH |
R65 |
>250 |
>250 |
32 |
ii |
=O |
=O |
=O |
β-OAc |
=O |
R65 |
>250 |
>250 |
33 |
ii |
β-OH |
β-OH |
=O |
β-OH |
=O |
R65 |
>250 |
>250 |
34 |
ii |
β-OH |
=O |
=O |
β-OAc |
=O |
R65 |
>250 |
>250 |
35 |
ii |
β-OH |
=O |
=O |
H |
=O |
R65 |
>250 |
>250 |
a The activity was shown as IC50 value, which was the concentration (μM) of tested compound that resulted in 50% inhibition of cell growth. Results were expressed as the mean value of triplicate data points.
Table 4: Cell survival affected by Compounds 1-4, 8, 17, 20, 22 and 24
Compounds |
IC50 |
compounds |
IC50 |
|---|---|---|---|
1 |
42.0 ± 1.9 |
17 |
43.0 ± 0.3 |
2 |
36.5 ± 3.4 |
20 |
5.3 ± 0.8 |
3 |
4.9 ± 0.3 |
22 |
18.4 ± 3.2 |
4 |
21.7 ± 2.8 |
24 |
24.0 ± 2.5 |
8 |
14.6 ± 0.4 |
3D-QSAR was then used to investigate the structure-activity relationship for inhibiting human breast cancer cells MDA-MB-231. Illustrated in Table 5, the training and test set of the 17 compounds (1-9, 17, 19-24 and 28) with accurate IC50 ranging from 21.2 to 163.5 μM was randomly selected for correlation analysis in due proportion that ratio of training set was 0.765, and ratio of test set was 0.235 by the Diverse Molecules method of Discovery Studio 3.1. The calculated pIC50 values ranged from 3.78 to 4.71. The correlation coefficient (r2) between the observed and predicted activity of the training set was found to be 0.968, whereas that of the test set was found to be 0.317, which proved that this QSAR model was acceptable. The predicted pIC50 values and residual errors of the 17 compounds analyzed using this QSAR model were listed in Table 5. A plot of the observed pIC50 versus the predicted data is provided in Figure 4, in which the plot of the actual IC50 versus the predicted values indicated that this model was reliable in forecasting activity for G. lucidum triterpenoids. Moreover, the molecules aligned with the iso-surfaces of the 3D-QSAR model coefficients on van der Waals grids (Figure 5a) and electrostatic potential grids (Figure 5b). It was widely accepted that a better inhibitor based on the 3D-QSAR model should have strong van der Waals attraction in the green areas and a polar group in the blue electrostatic potential areas (which were dominant close to the skeleton).
Table 5: Experimental and predicted inhibitory activities of 17 compounds by 3D-QSAR model
CLompounds |
Experimental pIC50 |
Predicted pIC50 |
Residual error |
|---|---|---|---|
1 |
4.27240 |
4.24780 |
0.0245988 |
2 |
4.44473 |
4.37745 |
0.0672809 |
3 |
4.67445 |
4.70636 |
-0.0319126 |
4 |
4.12084 |
4.19534 |
-0.0745045 |
5 |
3.94868 |
3.93447 |
0.0142062 |
6a |
3.99007 |
3.97291 |
0.0171585 |
7 |
4.11364 |
4.13921 |
-0.0255712 |
8 |
4.01952 |
4.03475 |
-0.0152263 |
9a |
3.79952 |
3.99636 |
-0.196836 |
17 |
4.03403 |
4.01796 |
0.0160717 |
19a |
3.97562 |
3.99842 |
-0.022796 |
20 |
4.11556 |
4.04926 |
0.0663042 |
21 |
3.80137 |
3.87671 |
-0.0753358 |
22 |
3.97562 |
3.93744 |
0.0381821 |
23 |
3.78648 |
3.81034 |
-0.0238569 |
24a |
4.11556 |
4.04527 |
0.0702946 |
28 |
3.79945 |
3.77969 |
0.0197632 |
a Compounds were selected as the test sets while the rest ones were in the training sets.
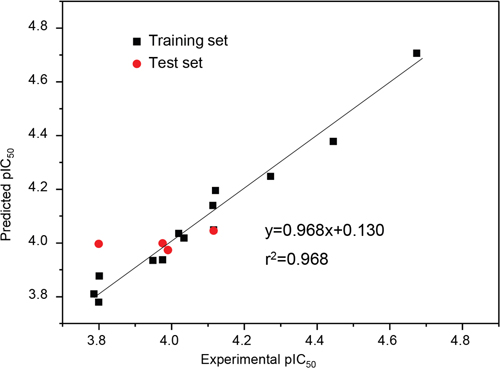
Figure 4: Experimental versus predicted breast carcinoma inhibitory activities of the training set and the test set. The well agreement between predicted pIC50 value and experimental pIC50 value for both test sets and training sets indicated that this model was reliable in forecasting activity for G. lucidum triterpenoids.
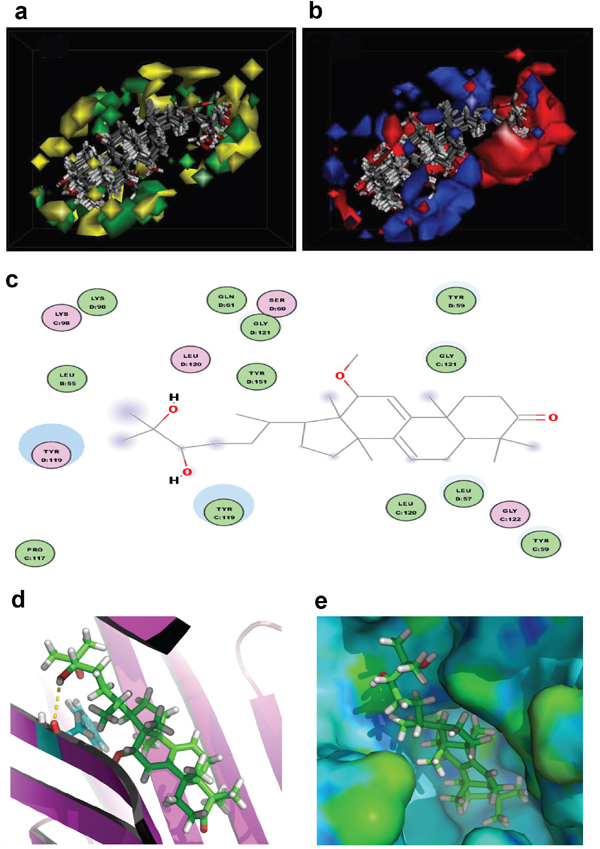
Figure 5: 3D-QSAR model and docking analysis. a. 3D-QSAR model coefficients of triterpenoids from G. lucidum on van der Waals grids. Green represents positive coefficients; yellow represents negative coefficients. b. 3D-QSAR model coefficients on electrostatic potential grids. Blue represents positive coefficients; red represents negative coefficients. c. 2D diagram of the interaction between compound 3 and the binding site of TNF-α. The H-bond (yellow dash) is displayed. d. 3D diagram of the interaction between compound 3 and the binding site of TNF-α. For clarity, only interacting residues are displayed. The H-bond (yellow dash) is displayed. e. The receptor surface model with compound 3.
According to the modeling result provided in Figure 5a-5b, introducing slight bulk and lowly negative charged groups at C-25 or C-26 may elevate the activity of compound 1. Meanwhile, introducing slightly bulk and low positive charged substitutes at C-7 and C-15 may increase the activity of compound 1. Inversely, introducing bulk substitutes at C-1, C-2, C-3, C-22 and C-24 may decrease the activity of compound 1. However, replacing C-1, C-2 and C-3 with negative charged moieties may increase the activity of compound 1, while replacing C-19, C-23 and C-24 with low positive moieties may raise the activity of compound 1. For compounds 9, 21 and 23, the introduction of methyl group of steric hindrance at C-2 and negative O atom such as carbonyl group at C-7 to replace neutral H atom may decline their activity from the IC50 of 21.2 μM for compound 3 to about 160 μM for compounds 9, 21 and 23 (approximately 8 folds).
As depicted in Table 3, compound 3 showed the highest cytotoxicity, which suggests that compound 3 may exhibit the most potent affinity for its target. Since experimentally identifying and validating a target for a biological agent is time-consuming and costly, we used Pharmaceutical Target Seeker (PTS) [40] to predict potential targets of compound 3 and found that its most possible target is tumor necrosis factor α (TNF-α; PDB code: 2AZ5). To gain better understanding on the potency of the compound, we analyzed the interaction of compound 3 with TNF-α. The molecular docking was performed by inserting the compound into the binding site of TNF-α. All docking runs were applied by Discovery Studio. The binding interaction energy (-142.896 ± 50.365 kJ/mol) was predicted. Figure 5c-5e showed the binding mode of compound 3 interacting with 2AZ5 protein and the docking results revealed that the amino acid Tyr119 located in the binding pocket of the protein played vital role in the conformation with compound 3, which were stabilized by one hydrogen bond. The hydrogen bond was formed relating to Tyr119, which connected to hydrogen atom of hydroxyl of compound 3 part with 2.8 °A. This molecular docking model suggests that compounds 3 may target TNF-α. TNF-α is an extraordinarily pleiotropic cytokine with a central role in immune homeostasis, inflammation, and host defense. TNF-α is a double-dealer. On one hand, TNF-α functions as an endogenous tumor promoter, because TNF-α stimulates cancer cell proliferation, invasion and metastasis. It also induces tumor angiogenesis. On the other hand, TNF-α functions as a cancer killer. Modulation of the activity of TNF-α will offer possibilities for cancer therapy. Since Ganoderma lucidum plays a central role in immune homeostasis, compound 3 may be developed as an agent for cancer immunotherapy.
CONCLUSIONS
35 triterpenoids including 5 new compounds were isolated from the fruiting bodies of Ganoderma lucidum. The chemical structures of the new compounds were elucidated by spectroscopy. All of the compounds were assayed for their cytotoxic activity against the human breast carcinoma cell line MDA-MB-231 and hepatocellular carcinoma cell line HepG2, and the structure–activity relationships were revealed by 3D-QASR. Compound 3 showed the highest cytotoxic activity and it may target TNF-α. Our work may provide a guideline to design and optimize more effective inhibitors for human breast carcinoma based on the triterpenoids from Ganoderma lucidum. Our next task is to chemically synthesize this compound, confirm its activity, and explore its anticancer mechanism, and develop it as an agent for cancer immunotherapy.
MATERIALS AND METHODS
General experimental procedures
The ESI-MS spectra were recorded on a 6430 Triple Quad mass spectrometer (Agilent Technologies, Santa Clara, USA). The HR-ESI-MS spectra were obtained on a Micromass Q-TOF mass spectrometer (Waters Corporation, Milford, USA). 1D and 2D NMR spectra were measured on a Bruker AVANCE III 600 spectrometer. UV data were recorded using a JASCO V-550 UV/vis spectrometer (Jasco International Co., Ltd., Tokyo, Japan). IR data were recorded on a JASCO FT/IR-480 plus spectrometer (Jasco International Co., Ltd., Tokyo, Japan). Optical rotations were measured on a JASCO P1020 digital polarimeter (Jasco International Co., Ltd., Tokyo, Japan). Analytical HPLC was performed on an Agilent 1100 with an Agilent DAD spectrophotometer and a YMC-Pack Pro C18 (5 μm, 4.6 × 250 mm), while preparative HPLC was performed on an Shimadzu LC-20A spectrophotometer and a YMC-Pack Pro C18 column (5 μm, 20 × 250 mm). Normal phase silica gel (200–300 mesh, Qingdao Haiyang Chemical Co., Ltd.) and octadecylsilanized (ODS) silica gel (50 μm, YMC Ltd., Japan) were also used for column chromatography (CC).
Fungi material
The quality of Ganoderma lucidum fruit body, collected in Dabie Moutain, Anhui, China, was inspected and analyzed by Yuewei Edible Fungi Technology Co. Ltd., Guangzhou, China. The voucher specimen (No. GL20151010) was deposited in State Key Laboratory of Applied Microbiology Southern China, Guangdong Institute of Microbiology.
Extraction and isolation
The air-dried and powdered fruit bodies of Ganoderma lucidum (6 kg) were extracted with ethyl acetate (48 L × 2, v/v). The crude extract (130 g) was then incubated in chloroform (3 L × 3) to generate the total triterpenoids fraction (78 g). An aliquot of the chloroform extract (70 g) was applied to a silica gel column (200–300 mesh) eluted successively with CHCl3–MeOH (100:0, 98:2, 95:5, 90:10, 80:20, 70:30, 50:50 and 0:100) to obtain 8 fractions (Fr. 1~ Fr. 8). Fr. 4 was subjected to a ODS silica gel column eluted with MeOH–H2O (30:70, 50:50, 60:40, 70:30, 80:20, 90:10 and 100:0) to afford 7 subfractions (Fr. 4.1~ Fr. 4.7). Fr. 4.5 was further purified by preparative HPLC (MeOH–H2O, 80:20) to afford compounds 6, 1, 2 and 7. Fr. 4.4 was further purified by preparative HPLC (MeOH–H2O, 70:30) to afford compounds 3, 4, 8, 9, 10, 11, 12 and 13. Fr. 4.3 was purified by preparative HPLC (MeOH–H2O, 60:40) to produce compounds 14 and 15. Fr. 3 was subjected to a ODS silica gel column eluted with MeOH–H2O (40:60, 50:50, 60:40, 70:30, 80:20, 90:10 and 100:0) to afford 7 subfractions (Fr. 3.1~ Fr. 3.7). Fr. 3.5 was further purified by preparative HPLC (MeOH–H2O, 75:25) to produce compounds 16, 17, 18, 19, 20, 21, 5, 22, 23 and 24. Fr. 3.4 was further purified by preparative HPLC (MeOH–H2O, 65:35) to afford compounds 29, 25, 30, 26, 27 and 28. Fr. 3.3 was purified by preparative HPLC (MeOH–H2O, 55:45) to afford compounds 31, 32, 33, 34, and 35.
Characterization of the new compounds
Compound 1 (ganodermanontetrol): White powder; [α]D25 13.4 (c = 0.20, CHCl3). UV (MeOH) λmax 254.2 nm; IR (KBr) vmax 3393, 2945, 2858, 1709, 1658, 1459, 1415, 1375, 1261, 1095 cm-1; ESI-MS: m/z 999 [2M + Na] +, 511 [M + Na] +, m/z 487 [M - H] -, 975 [2M - H] -. HR-ESI-MS: m/z 487.3429 [M - H] - (cacld for C30H47O5, 487.3423); 1H-NMR (CDCl3, 600 MHz) and 13C-NMR (CDCl3, 150 MHz): see Table 1.
Compound 2 (3β, 24, 25, 26-tetradroxy-7α-methoxy-8-ene-lanost-ol): White powder; [α]D25 22.6 (c = 0.20, CHCl3). UV (MeOH) λmax 254.2 nm; IR (KBr) vmax 3387, 2940, 2862, 1713, 1645, 1450, 1418, 1375, 995 cm-1; 3387, 2925, 2854, 1722, 1656, 1601, 1507, 1361, 1290, 1255, 1171, 1069, 1022, 929; ESI-MS: m/z 1035 [2M + Na] +, 529 [M + Na] +, m/z 505 [M - H] -, 1011 [2M - H] -. HR-ESI-MS: m/z 505.3882 [M - H] - (cacld for C31H53O5, 505.3893); 1H-NMR (CDCl3, 600 MHz) and 13C-NMR (CDCl3, 150 MHz): see Table 1.
Compound 3 (12α-methoxy-ganodermanondiol): White powder; [α]D25 24.8 (c = 0.20, CHCl3). UV (MeOH) λmax 254.2 nm; IR (KBr) vmax 3355, 2920, 2851, 1720, 1650, 1450, 1278, 1012 cm-1; ESI-MS: m/z 995 [2M + Na] +, 509 [M + Na] +, 485 [M - H] -, 971 [2M - H] -. HR-ESI-MS: m/z 485.3642 [M - H] - (cacld for C31H49O4, 485.3631); 1H-NMR (CDCl3, 600 MHz) and 13C-NMR (CDCl3, 150 MHz): see Table 1.
Compound 4 (15β-hydroxy-lucidumol A): White powder; [α]D25 18.5 (c = 0.20, CHCl3). UV (MeOH) λmax 254.2 nm; IR (KBr) vmax 3385, 2920, 2838, 1715, 1650, 1452, 1267, 1025 cm-1; ESI-MS: m/z 999 [2M + Na] +, 511 [M + Na] +, m/z 487 [M - H] -, 975 [2M - H] -. HR-ESI-MS: m/z 487.3435 [M - H] - (cacld for C30H47O5, 487.3423); 1H-NMR (CDCl3, 600 MHz) and 13C-NMR (CDCl3, 150 MHz): see Table 1.
Compound 5 (15α-hydroxy-ganodermanontriol): White powder; [α]D25 25.2 (c = 0.20, CHCl3). UV (MeOH) λmax 254.2 nm; IR (KBr) vmax 3389, 2925, 2835, 1724, 1655, 1455, 1258, 985 cm-1; ESI-MS: m/z 999 [2M + Na] +, 511 [M + Na] +, m/z 487 [M - H] -, 975 [2M - H] -. HR-ESI-MS: m/z 487.3438 [M - H] - (cacld for C30H47O5, 487.3423); 1H-NMR (CDCl3, 600 MHz) and 13C-NMR (CDCl3, 150 MHz): see Table 1.
Viability and cell death assay
The cell culturing conditions, viability, and cell death assay was performed as described [41–43]. In brief, human breast carcinoma cell line MDA-MB-231 and hepatocellular carcinoma cell line HepG2 were used in the study. The cells were cultured in DMEM supplemented with 10%FBS, 100 U/mL penicillin/ streptomycin at 37°C, 5%CO2 in an incubator (SANYO, MCO-18AIC). Cells (1 x 10⁵ cells/mL) were seeded in 24-well plates (500 μL/well). Four hours after inoculation, Compounds 1-35 were added individually into the cultured cells at different concentrations. After 48 h incubation, the cells were detached by trypsin, collected and analyzed by trypan blue staining for cell viability. Each experiment was repeated three times. Each treatment was performed with three replicates. Cell inhibition rate (IR) was expressed as follows:
IR (%) = (total cell number - living cell number)/total cell number×100%
IR and the corresponding concentrations of the compounds were inputed into SPSS and the Probit analysis was uesd for IC50 calculation. Data were expressed as mean ± SD (standard deviation).
Cell survival assay
The survival assay was performed as described [44, 45]. MDA-MB-231 cells (5 x 10⁴ cells/well) were seeded in 24-well plates with 500 μL DMEM containing 10% FBS. 24-hour after cell inoculation, cells were washed gently with PBS twice and cultured in serum-free DMEM. The compounds 1-4, 8, 17, 19, 20, 22 and 24 were added to the wells at different concentrations. The medium used to dissolve compounds served as a control. After 24 h treatment, the cells were harvested, counted using trypan blue staining. The experiments of each compound were repeated three times. Each treatment contained three replicates. Cell inhibition rate (IR) was expressed as follows:
IR (%) = (total cell number - living cell number)/total cell number×100%
IR and the corresponding concentrations of the compounds were inputed into SPSS and the Probit analysis was uesd for IC50 calculation. Data were expressed as mean ± SD.
QSAR model
A subset of 13 compounds was utilized as a training set for QSAR modeling using the procedure as described [46, 47]. Because it is essential to assess the predictive power of the resulting QSAR models on an external set of inhibitors, the remaining 4 molecules (ca. 25 % of the dataset) were employed as an external test subset for validating the QSAR models by the Diverse Molecules protocol in the Discovery Studio 3.1. The selected test compounds were compounds 6, 9, 19 and 24.
The inhibitory effect of the compounds observed (IC50; μM) was changed to a negative logarithmic scale (pIC50; μM), and then used for subsequent QSAR analyses as a response variable.
In the Discovery Studio 3.1, the CHARMm force field was used and the electrostatic potential and the van der Waals potential were treated as separate terms. A +1e point charge was used as the electrostatic potential probe and the distance dependent dielectric constant was used to mimic the solvation effect. For the van der Waals potential, a carbon atom with a radius of 1.73 °A was used as a probe. The truncation for both steric and the electrostatic energies was set to 30 kcal/mol. Standard parameters were implemented in the Discovery Studio 3.1. A partial least-squares (PLS) model was built using energy grids as descriptors. QSAR models were built using the 3D-QSAR protocol of Discovery Studio 3.1.
Target seeking and docking
For the molecular docking model, the three-dimensional X-ray structure of searched target acquired from the RCSB protein data bank (http://www.pdb.org) was selected as the template. All bound water and ligands were eliminated from the protein and the polar hydrogen was added to the proteins. The docking procedure was carried out using CDOCKER protocol for receptor-ligand interaction section of Discovery Studio [48]. Initially, the three-dimensional structures of the compound in this paper were built and energetically minimized by using MMFF94 with 5000 iterations and minimum RMS gradient of 0.10. Molecular docking of all compounds was then performed using the Discovery Studio as implemented through the graphical user interface CDOCKER protocol. CDOCKER is an implementation of a CHARMm based molecular docking tool using a rigid receptor.
ACKNOWLEDGMENTS
This work was financially supported by the High-level Leading Talent Introduction Program of GDAS (No.2016GDASRC-0102), Guangdong Province Natural Science Foundation (No.2015A030313711), Guangdong Province Science and Technology Project (No.2016A030303041, 2013A061402008) and Guangzhou Science and Technology Project (No.2014Y2-00538).
CONFLICTS OF INTEREST
The authors declare no conflicts of interest.
REFERENCES
1. Ling-Sing Seow S, Naidu M, David P, Wong KH, Sabaratnam V. Potentiation of neuritogenic activity of medicinal mushrooms in rat pheochromocytoma cells. BMC Complement Altern Med. 2013; 13:157.
2. Cheng S, Sliva D. Ganoderma lucidum for cancer treatment: we are close but still not there. Integr Cancer Ther. 2015; 14:249-257.
3. Gill BS, Sharma P, Kumar R, Kumar S. Misconstrued versatility of Ganoderma lucidum: a key player in multi-targeted cellular signaling. Tumour Biol. 2016; 37:2789-2804.
4. Boh B. Ganoderma lucidum: a potential for biotechnological production of anti-cancer and immunomodulatory drugs. Recent Pat Anti-Cancer Drug Discovery. 2013; 8:255-287.
5. Rios JL, Andujar I, Recio MC, Giner RM. Lanostanoids from fungi: a group of potential anticancer compounds. J Nat Prod. 2012; 75:2016-2044.
6. Sliva D. Ganoderma lucidum in cancer research. Leuk Res. 2006; 30:767-768.
7. Ma HT, Hsieh JF, Chen ST. Anti-diabetic effects of Ganoderma lucidum. Phytochemistry. 2015; 114:109-113.
8. Chang CJ, Lin CS, Lu CC, Martel J, Ko YF, Ojcius DM, Tseng SF, Wu TR, Chen YY, Young JD, Lai HC. Ganoderma lucidum reduces obesity in mice by modulating the composition of the gut microbiota. Nat Commun. 2015; 6:7489.
9. Pan D, Wang L, Chen C, Hu B, Zhou P. Isolation and characterization of a hyperbranched proteoglycan from Ganoderma lucidum for anti-diabetes. Carbohydr Polym. 2015; 117:106-114.
10. Wu J-G, Kan Y-J, Wu Y-B, Yi J, Chen T-Q, Wu J-Z. Hepatoprotective effect of ganoderma triterpenoids against oxidative damage induced by tert-butyl hydroperoxide in human hepatic HepG2 cells. Pharm Biol (Abingdon, U K). 2016; 54:919-929.
11. Li B, Lee D-S, Kang Y, Yao N-Q, An R-B, Kim Y-C. Protective effect of ganodermanondiol isolated from the Lingzhi mushroom against tert-butyl hydroperoxide-induced hepatotoxicity through Nrf2-mediated antioxidant enzymes. Food Chem Toxicol. 2013; 53:317-324.
12. Ha DT, Oh J, Minh Khoi N, Dao TT, Dung LV, Do TNQ, Lee SM, Jang TS, Jeong G-S, Na M. In vitro and in vivo hepatoprotective effect of ganodermanontriol against t-BHP-induced oxidative stress. J Ethnopharmacol. 2013; 150:875-885.
13. Gao Y, Lin Z-B, Huang M, Zhou S. Hepatoprotective activity and the mechanisms of action of Ganoderma lucidum (Curt.:Fr.) P. Karst. (Ling Zhi, Reishi mushroom) (Aphyllophoromycetideae) (review). Int J Med Mushrooms. 2003; 5:111-131.
14. Min B-S, Nakamura N, Miyashiro H, Bae K-W, Hattori M. Triterpenes from the spores of Ganoderma lucidum and their inhibitory activity against HIV-1 protease. Chem Pharm Bull. 1998; 46:1607-1612.
15. Wang J, Zhang Y, Yuan Y, Yue T. Immunomodulatory of selenium nano-particles decorated by sulfated Ganoderma lucidum polysaccharides. Food Chem Toxicol. 2014; 68:183-189.
16. Wang J, Yuan Y, Yue T. Immunostimulatory activities of β-D-glucan from Ganoderma Lucidum. Carbohydr Polym. 2014; 102:47-54.
17. Baby S, Johnson AJ, Govindan B. Secondary metabolites from Ganoderma. Phytochemistry (Elsevier). 2015; 114:66-101.
18. Pan H, Han Y, Huang J, Yu X, Jiao C, Yang X, Dhaliwal P, Xie Y, Yang BB. Purification and identification of a polysaccharide from medicinal mushroom Amauroderma rude with immunomodulatory activity and inhibitory effect on tumor growth. Oncotarget. 2015; 6:17777-17791.
19. Li X, Wu Q, Xie Y, Ding Y, Du WW, Sdiri M, Yang BB. Ergosterol purified from medicinal mushroom Amauroderma rude inhibits cancer growth in vitro and in vivo by up-regulating multiple tumor suppressors. Oncotarget. 2015; 6:17832-17846.
20. Jiao C, Xie YZ, Yang X, Li H, Li XM, Pan HH, Cai MH, Zhong HM, Yang BB. Anticancer activity of Amauroderma rude. PLoS One. 2013; 8:e66504.
21. Li X, Wu Q, Bu M, Hu L, Du WW, Jiao C, Pan H, Sdiri M, Wu N, Xie Y, Yang BB. Ergosterol peroxide activates Foxo3a-mediated cell death signaling by inhibiting AKT and c-Myc in human hepatocellular carcinoma cells. Oncotarget. 2016.
22. Xie YZ, Yang F, Tan W, Li X, Jiao C, Huang R, Yang BB. The anti-cancer components of Ganoderma lucidum possesses cardiovascular protective effect by regulating circular RNA expression. Oncoscience. 2016; 3:203-207.
23. Nishitoba T, Oda K, Sato H, Sakamura S. Novel triterpenoids from the fungus Ganoderma lucidum. Agric Biol Chem. 1988; 52:367-372.
24. Sato N, Zhang Q, Ma C-M, Hattori M. Anti-human immunodeficiency virus-1 protease activity of new lanostane-type triterpenoids from Ganoderma sinense. Chem Pharm Bull. 2009; 57:1076-1080.
25. Kubota T, Asaka Y, Miura I, Mori H. Structures of ganoderic acid A, B, two new lanostane type bitter triterpenes from Ganoderma lucidum (Fr.) Karst. Helv Chim Acta. 1982; 65:611-619.
26. Chen R, Yu D. Studies on the triterpenoid constituents of the spores from Ganoderma lucidum Karst. J Chin Pharm Sci. 1993; 2:91-96.
27. Komoda Y, Nakamura H, Ishihara S, Uchida M, Kohda H, Yamasaki K. Structures of new terpenoid constituents of Ganoderma lucidum (Fr.) Karst (Polyporaceae). Chem Pharm Bull. 1985; 33:4829-4835.
28. Fujita A, Arisawa M, Saga M, Hayashi T, Morita N. Two new lanostanoids from Ganoderma lucidum. J Nat Prod. 1986; 49:1122-1125.
29. Xu J, Li P, Zhang Z, Ke F, Shen C, Xiong X. (2015). Triterpenoid, preparation method and pharmaceutical application. Fujian Medical University, Peop. Rep. China.), pp. 8pp.
30. Chen M, Zhang M, Sun S, Xia B, Zhang H-Q. A new triterpene from the fruiting bodies of Ganoderma lucidum. Yao Xue Xue Bao. 2009; 44:768-770.
31. Gonzalez AG, Leon F, Rivera A, Munoz CM, Bermejo J. Lanostanoid triterpenes from Ganoderma lucidum. J Nat Prod. 1999; 62:1700-1701.
32. Sato H, Nishitoba T, Shirasu S, Oda K, Sakamura S. Ganoderiol A and B, new triterpenoids from the fungus Ganoderma lucidum (Reishi). Agric Biol Chem. 1986; 50:2887-2890.
33. Kennedy EM, P'Pool SJ, Jiang J, Sliva D, Minto RE. Semisynthesis and Biological Evaluation of Ganodermanontriol and Its Stereoisomeric Triols. J Nat Prod. 2011; 74:2332-2337.
34. Nishitoba T, Sato H, Kasai T, Kawagishi H, Sakamura S. New bitter C27 and C30 terpenoids from the fungus Ganoderma lucidum (Reishi). Agric Biol Chem. 1985; 49:1793-1798.
35. Kikuchi T, Matsuda S, Murai Y, Ogita Z. Ganoderic acid G and I and ganolucidic acid A and B, new triterpenoids from Ganoderma lucidum. Chem Pharm Bull. 1985; 33:2628-2631.
36. Nishitoba T, Sato H, Sakamura S. New terpenoids, ganoderic acid J and ganolucidic acid C, from the fungus Ganoderma lucidum. Agric Biol Chem. 1985; 49:3637-3638.
37. Kikuchi T, Kanomi S, Kadota S, Murai Y, Tsubono K, Ogita Z. Constituents of the fungus Ganoderma lucidum (Fr.) Karst. I. Structures of ganoderic acids C2, E, I, and K, lucidenic acid F and related compounds. Chem Pharm Bull. 1986; 34:3695-3712.
38. Kikuchi T, Matsuda S, Kadota S, Murai Y, Ogita Z. Ganoderic acid D, E, F, and H and lucidenic acid D, E, and F, new triterpenoids from Ganoderma lucidum. Chem Pharm Bull. 1985; 33:2624-2627.
39. Lin CN, Kuo SH, Won SJ. Steroids of Formosan Ganoderma amboinense. Phytochemistry. 1993; 32:1549-1551.
40. Yan X, Liao C, Liu Z, Hagler AT, Gu Q, Xu J. Chemical Structure Similarity Search for Ligand-Based Virtual Screening: Methods and Computational Resources. Curr Drug Targets. 2015.
41. Fang L, Li H, Wang L, Hu J, Jin T, Wang J, Yang BB. MicroRNA-17-5p promotes chemotherapeutic drug resistance and tumour metastasis of colorectal cancer by repressing PTEN expression. Oncotarget. 2014; 5:2974-2987.
42. Li H, Gupta S, Du WW, Yang BB. MicroRNA-17 inhibits tumor growth by stimulating T-cell mediated host immune response. Oncoscience. 2014; 1:531-539.
43. Chen WL, Barszczyk A, Turlova E, Deurloo M, Liu B, Yang BB, Rutka JT, Feng ZP, Sun HS. Inhibition of TRPM7 by carvacrol suppresses glioblastoma cell proliferation, migration and invasion. Oncotarget. 2015; 6:16321-16340.
44. Wu Y, Chen L, Cao L, Sheng W, Yang BB. Overexpression of the C-terminal PG-M/versican domain impairs growth of tumor cells by intervening in the interaction between epidermal growth factor receptor and beta1-integrin. J Cell Sci. 2004; 117:2227-2237.
45. Du WW, Yang W, Liu E, Yang Z, Dhaliwal P, Yang BB. Foxo3 circular RNA retards cell cycle progression via forming ternary complexes with p21 and CDK2. Nucleic Acids Res. 2016; 44:2846-2858.
46. Luo Y, Zhou Y, Fu J, Zhu HL. 4,5-Dihydropyrazole derivatives containing oxygen-bearing heterocycles as potential telomerase inhibitors with anticancer activity. RSC Adv. 2014; 4:23904-23913.
47. Sang YL, Duan YT, Qiu HY, Wang PF, Makawana JA, Wang ZC, Zhu HL, He ZX. Design, synthesis, biological evaluation and molecular docking of novel metronidazole derivatives as selective and potent JAK3 inhibitors. RSC Adv. 2014; 4:16694-16704.
48. Wu G, Robertson DH, Brooks CL, 3rd, Vieth M. Detailed analysis of grid-based molecular docking: A case study of CDOCKER-A CHARMm-based MD docking algorithm. J Comput Chem. 2003; 24:1549-1562.