
INTRODUCTION
Long noncoding RNAs (lncRNAs) are a class of RNAs greater than 200 nucleotides in length that are not translated into proteins [1]. The expression of lncRNAs is cell type- and tissue-dependent, which distinguishes them from protein-coding genes [2]. The secondary structures of the lncRNAs can dictate their functions in various cellular processes and diseases [3]. Some lncRNAs activate the oncogenic signaling pathways to drive cancer phenotypes [4]. For example, lncRNA HULC promotes the epithelial-to-mesenchymal transition phenotype and tumorigenesis in both pancreatic and gastric cancer cells [5, 6].
Single nucleotide polymorphisms (SNPs) in lncRNAs can also promote cancer development and progression. For example, the TT genotype of rs12826786 in HOTAIR was found to increase breast cancer susceptibility [7]. Expression quantitative trait loci (eQTLs) in the lncRNA CARD8 are susceptibility markers for cervical cancer [8]. The C/T genotype of rs3787016 in the lncRNA POLR2E was associated with a decreased risk of esophageal squamous cell carcinoma [9]. Collectively, these data indicate SNPs in lncRNAs have important roles in tumorigenesis and as prognostic biomarkers.
Human zinc ribbon domain containing 1 (ZNRD1) is involved in the development of multiple cancers [10]. Interestingly, three SNPs in the lncRNA ZNRD1-AS1 (rs3757328, rs6940552, and rs9261204), which lies in the upstream region of the ZNRD1 gene, were found to inhibit ZNRD1 expression and decrease the risk of cervical cancer [11]. However, several studies have demonstrated that eQTLs in ZNRD1-AS1 increased the risk of hepatocellular carcinoma (HCC) [12, 13] and lung cancer [10]. These conflicting results for rs3757328, rs6940552, and rs9261204 in ZNRD1-AS1 need to be further studied. Therefore, we investigated the effects of rs3757328, rs6940552, and rs9261204 in ZNRD1-AS1 on cancer susceptibility in this study.
RESULTS
Study characteristics
Four case-control articles [10–13], which included 5,293 cases and 5,440 controls, were included in our meta-analysis. All of the eligible studies were comprised of Asian populations. In one study, Li et al, investigated both lung cancer and bladder cancer. We therefore considered this study as two independent studies in our analysis (Table 1). The studies were all published between June 15, 2015 and June 30, 2016. The sample size range was 1,000 to 3,067. Finally, the studies investigated distinct tumor types (HCC, lung cancer, bladder cancer, and cervical cancer, Table 1).
Table 1: Characteristics of studies on the association between SNPs in ZNRD1-AS1 and cancer
Author |
Year |
Ethnicity |
Cases |
Controls |
Type of cancer |
Single Nucleotide Polymorphisms |
Genotyping Method |
Quality Score |
|---|---|---|---|---|---|---|---|---|
|
|
|
|
|
|
rs3757328 |
|
|
Liu |
2016 |
Chinese |
1507 |
1560 |
HCC |
rs6940552 |
TaqMan |
8 |
|
|
|
|
|
|
rs9261204 |
|
|
|
|
|
|
|
|
rs3757328 |
|
|
Li |
2016 |
Chinese |
500 |
500 |
lung cancer |
rs6940552 |
PCR-RFLP |
6 |
|
|
|
|
|
|
rs9261204 |
|
|
|
|
|
|
|
|
rs3757328 |
|
|
Li |
2016 |
Chinese |
500 |
500 |
bladder cancer |
rs6940552 |
PCR-RFLP |
6 |
|
|
|
|
|
|
rs9261204 |
|
|
|
|
|
|
|
|
rs3757328 |
Sequenom |
|
Guo |
2015 |
Chinese |
1486 |
1536 |
cervical cancer |
rs6940552 |
MassARRAY |
8 |
|
|
|
|
|
|
rs9261204 |
iPLEX platform |
|
|
|
|
|
|
|
rs3757328 |
Sequenom |
|
Wen |
2015 |
Chinese |
1300 |
1344 |
HCC |
rs6940552 |
MassARRAY |
8 |
|
|
|
|
|
|
rs9261204 |
iPLEX platform |
|
Abbreviations: HCC, hepatocellular carcinoma; PCR-RFLP, polymerase chain reaction-restriction fragment length polymorphism.
All studies explored the relationships between SNPs in ZNRD1-AS1 (rs3757328, rs6940552, and rs9261204) and cancer risk. The genotyping methods included TaqMan in one study, PCR-restriction fragment length polymorphism in two studies, and the Sequenom MassARRAY iPLEX platform in two studies (Table 1). The methodological quality of each study was evaluated using the Newcastle-Ottawa Scale (NOS). All the studies scored at least 6 on this scale (Supplemental Table S1).
The genotypes for rs3757328, rs6940552, and rs9261204 included AA, GA, and GG. Hardy-Weinberg equilibrium test statistics indicated that the probability of the null hypothesis for most of the genotypes was correct (Table 2).
Table 2: Genotype distributions of rs3757328, rs6940552 and rs9261204 in ZNRD1-AS1
Year |
Author |
Case |
Control |
P for HWE in controls |
||||
|---|---|---|---|---|---|---|---|---|
rs3757328 |
|
GG |
GA |
AA |
GG |
GA |
AA |
|
2016 |
Liu |
1038 |
362 |
43 |
1146 |
375 |
33 |
0.72 |
2016 |
Li |
305 |
175 |
20 |
340 |
150 |
10 |
0.16 |
2016 |
Li |
337 |
146 |
17 |
340 |
150 |
10 |
0.16 |
2015 |
Guo |
946 |
363 |
35 |
950 |
435 |
51 |
0.89 |
2015 |
Wen |
920 |
319 |
40 |
976 |
333 |
18 |
0.08 |
rs6940552 |
|
GG |
GA |
AA |
GG |
GA |
AA |
|
2016 |
Liu |
958 |
461 |
73 |
1048 |
453 |
52 |
0.72 |
2016 |
Li |
265 |
179 |
56 |
289 |
169 |
42 |
0.02 |
2016 |
Li |
274 |
175 |
51 |
289 |
169 |
42 |
0.02 |
2015 |
Guo |
872 |
413 |
61 |
867 |
495 |
86 |
0.17 |
2015 |
Wen |
819 |
404 |
58 |
884 |
402 |
36 |
0.22 |
rs9261204 |
|
AA |
GA |
GG |
AA |
GA |
GG |
|
2016 |
Liu |
853 |
521 |
88 |
976 |
510 |
67 |
0.97 |
2016 |
Li |
228 |
207 |
65 |
280 |
180 |
40 |
0.15 |
2016 |
Li |
241 |
200 |
59 |
280 |
180 |
40 |
0.15 |
2015 |
Guo |
821 |
438 |
57 |
819 |
521 |
91 |
0.51 |
2015 |
Wen |
741 |
449 |
64 |
836 |
432 |
50 |
0.53 |
Abbreviations: HWE, Hardy-Weinberg equilibrium.
Quantitative synthesis
Overall, no significant association between rs3757328 and cancer risk was observed in any of the models tested (heterozygous model: odds ratio [OR] = 1.013; 95% confidence interval [CI] = 0.887 – 1.158; P = 0.07 for the heterogeneity test, I2 = 53.9%; homozygous model: OR = 1.489; 95% CI = 0.905 – 2.449; P = 0.005 for the heterogeneity test, I2 = 72.9%; dominant model: OR = 1.050; 95% CI = 0.898 – 1.228, P = 0.012 for the heterogeneity test, I2 = 68.9%; recessive model: OR = 1.474; 95% CI = 0.925 – 2.342, P = 0.011 for the heterogeneity test, I2 = 69.2%; additive: OR = 1.077; 95% CI = 0.921 – 1.260, P = 0.002 for the heterogeneity test, I2 = 76.1%, Table 3).
Table 3: ORs and 95% CI for cancers and ZNRD1-AS1 rs3757328, rs6940552 and rs9261204 under different genetic models
Genetic models |
n |
OR (95% CI) |
P (OR) |
Model |
I-square |
P (H) |
P (Begg) |
P (Egger) |
|---|---|---|---|---|---|---|---|---|
rs3757328 |
|
|
|
|
|
|
|
|
Heterozygous model (GA vs GG) |
5 |
1.013 (0.887, 1.158) |
0.844 |
R(D-L) |
53.9 |
0.070 |
0.806 |
0.355 |
Homozygous model (AA vs GG) |
5 |
1.489 (0.905, 2.449) |
0.117 |
R(D-L) |
72.9 |
0.005 |
0.462 |
0.240 |
Dominant model (GA+AA vs GG) |
5 |
1.050 (0.898, 1.228) |
0.541 |
R(D-L) |
68.9 |
0.012 |
0.806 |
0.351 |
Recessive model (AA vs GA+GG) |
5 |
1.474 (0.925, 2.342) |
0.103 |
R(D-L) |
69.2 |
0.011 |
0.462 |
0.260 |
Additive (A vs G) |
5 |
1.077 (0.921, 1.260) |
0.352 |
R(D-L) |
76.1 |
0.002 |
0.462 |
0.340 |
rs6940552 |
|
|
|
|
|
|
|
|
Heterozygous model (GA vs GG) |
5 |
1.035 (0.907, 1.180) |
0.611 |
R(D-L) |
56.2 |
0.058 |
0.806 |
0.550 |
Homozygous model (AA vs GG) |
5 |
1.271 (0.902, 1.790) |
0.170 |
R(D-L) |
72.9 |
0.005 |
1.000 |
0.237 |
Dominant model (GA+AA vs GG) |
5 |
1.070 (0.911, 1.256) |
0.411 |
R(D-L) |
73.4 |
0.005 |
0.806 |
0.537 |
Recessive model (AA vs GA+GG) |
5 |
1.248 (0.925, 1.684) |
0.147 |
R(D-L) |
65.8 |
0.020 |
0.806 |
0.221 |
Additive (A vs G) |
5 |
1.085 (0.830, 1.266) |
0.298 |
R(D-L) |
80.3 |
<0.001 |
0.462 |
0.513 |
rs9261204 |
|
|
|
|
|
|
|
|
Heterozygous model (GA vs AA) |
5 |
1.141 (0.956, 1.362) |
0.145 |
R(D-L) |
76.6 |
0.002 |
0.221 |
0.271 |
Homozygous model (GG vs AA) |
5 |
1.346 (0.889, 2.038) |
0.161 |
R(D-L) |
83.1 |
<0.001 |
0.462 |
0.250 |
Dominant model (GA+GG vs AA) |
5 |
1.180 (0.953, 1.461) |
0.129 |
R(D-L) |
85.5 |
<0.001 |
0.221 |
0.243 |
Recessive model (GG vs GA+AA) |
5 |
1.266 (0.897, 1.788) |
0.180 |
R(D-L) |
76.6 |
0.002 |
0.462 |
0.307 |
Additive (G vs A) |
5 |
1.164 (0.955, 1.418) |
0.132 |
R(D-L) |
88.8 |
<0.001 |
0.462 |
0.250 |
Abbreviations: OR, Odds ratio; CI, confidence intervals; P (H), P for heterogeneity; n, number of included studies; R, random-effects model; D-L, DerSimonian-Laird method.
We next evaluated the effect of the rs3757328 polymorphism on the risk of cancer among the subgroups by cancer type. We observed the rs3757328 in ZNRD1-AS1 was significantly associated with an increased risk of some cancer types (HCC, lung cancer, and bladder cancer) except cervical cancer (occurs only in women) both in the recessive model (Figure 1A, Recessive model: OR = 1.79; 95% CI = 1.33 – 2.41, P = 0.569 for the heterogeneity test, I2 = 0.0%) and additive genetic model (Figure 1B, Additive: OR = 1.15; 95% CI = 1.05–1.25, P = 0.507 for the heterogeneity test, I2 = 0.0%). The A allele of rs3757328 was significantly associated with an increased risk of some cancers compared with G allele.
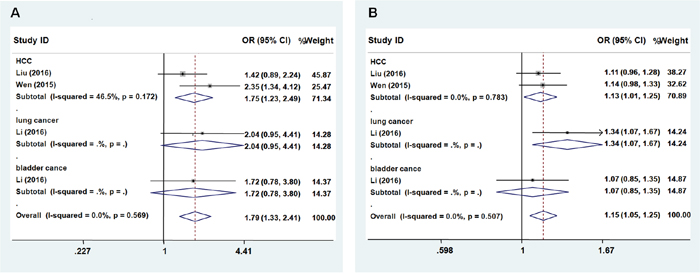
Figure 1: Forest plot of cancer risk associated with ZNRD1-AS1 polymorphism rs3757328. Models represented in A. recessive and B. allele contrast.
Similar to the results for rs3757328, no significant association was observed between rs6940552 in ZNRD1-AS1 and cancer risk (heterozygous model: OR = 1.035; 95% CI = 0.907 – 1.180; P = 0.058 for the heterogeneity test, I2 = 56.2%; homozygous model: OR = 1.271; 95% CI = 0.902 – 1.790; P = 0.005 for the heterogeneity test, I2 = 72.9%; dominant model: OR = 1.070; 95% CI = 0.911 – 1.256, P = 0.005 for the heterogeneity test, I2 = 73.4%; recessive model: OR = 1.248; 95% CI = 0.925 – 1.684; P = 0.020 for the heterogeneity test, I2 = 65.8%; additive: OR = 1.085; 95% CI = 0.830 – 1.266, P < 0.001 for the heterogeneity test, I2 = 80.3%, Table 3). We next evaluated the effects among the subgroups, and found that the A allele of rs6940552 significantly increased cancer risk (HCC, lung cancer, and bladder cancer) except cervical cancer (Figures 2A and 2B, recessive model: OR = 1.44; 95% CI = 1.18–1.77, P = 0.774 for the heterogeneity test, I2 = 0.0%; additive: OR = 1.17; 95% CI = 1.08–1.26, P = 0.972 for the heterogeneity test, I2 = 0.0%).
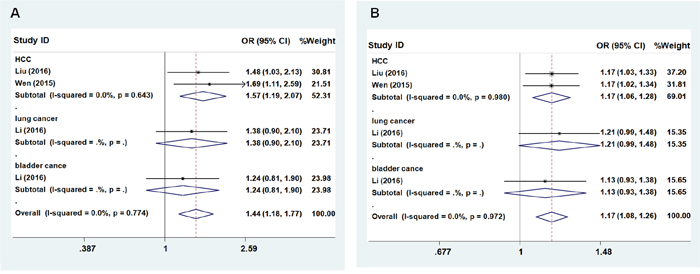
Figure 2: Forest plot of cancer risk associated with ZNRD1-AS1 polymorphism rs6940552. Models represented in A. recessive and B. allele contrast.
No significant association between rs9261204 in ZNRD1-AS1 and cancer risk was found (heterozygous model: OR = 1.141; 95% CI = 0.956 – 1.362; P = 0.002 for the heterogeneity test, I2 = 76.6%; homozygous model: OR = 1.346; 95% CI = 0.889 – 2.038; P < 0.001 for the heterogeneity test, I2 = 83.1%; dominant model: OR = 1.180; 95% CI = 0.953 – 1.461, P < 0.001 for the heterogeneity test, I2 = 85.5%; recessive model: OR = 1.266; 95% CI = 0.897 – 1.788, P = 0.002 for the heterogeneity test, I2 = 76.6%; additive: OR = 1.164; 95% CI = 0.955 – 1.418, P < 0.001 for the heterogeneity test, I2 = 88.8%, Table 3). Further subgroup analyses showed that the G allele of rs9261204 significantly increased cancer risk(HCC, lung cancer, and bladder cancer) except cervical cancer (Figures 3A and 3B, recessive model: OR = 1.49; 95% CI = 1.23–1.80, P = 0.857 for the heterogeneity test, I2 = 0.0%; additive: OR = 1.25; 95% CI = 1.16–1.34, P = 0.290 for the heterogeneity test, I2 = 19.9%).
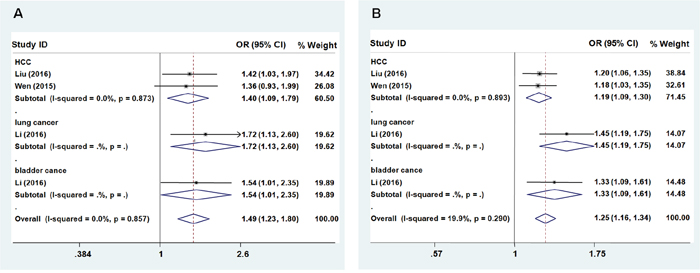
Figure 3: Forest plot of cancer risk associated with ZNRD1-AS1 polymorphism rs9261204. Models represented in A. recessive and B. allele contrast.
We also performed sensitivity analyses through removal of the individual study one by one. The results indicated that the study by Guo et al. [11] predominantly contributed to the observed heterogeneity in all models. Removal of this study significantly reduced the heterogeneity. These results showed that the study by Guo et al. focused on cervical cancer markly changed the pooled OR.
Publication bias
Potential publication biases was evaluated using the Egger’s and Begg’s tests. The results provided statistical evidence for the absence of publication bias in all models (Table 3).
DISCUSSION
SNPs in lncRNAs contribute to the development of various cancers [7, 8, 14]. In this study, we analyzed the associations between three SNPs (rs3757328, rs6940552, and rs9261204) in ZNRD1-AS1 and cancer risk. Our data indicated that these SNPs are correlated with an increased risk of several cancers in an Asian population.
The ZNRD1 protein contains two zinc ribbon domains [15]. It catalyzes the transcription of DNA into RNA and is a potential therapeutic target for various diseases [16, 17]. Reduced ZNRD1 expression was observed in human gastric cancer [18, 19]. Interestingly, ZNRD1 was found to suppress CDK4, Cyclin D1, and p21 [20] and inhibit the growth of gastric cancer and leukemia cells in vitro [17, 21]. Previous studies have indicated that ZNRD1-AS1 contribute to tumorigenesis through negative regulation of the ZNRD1 gene [10]. EQTLs analysis has demonstrated that SNPs in ZNRD1-AS1 regulate of ZNRD1 expression [22, 23].
Three SNPs in ZNRD1-AS1 (rs3757328, rs6940552 and rs9261204) have been associated with an increased risk of several cancers. Wen et al. [12] reported three of the SNPs (rs3757328, rs7769930, and rs694055) were associated with an increased risk of HCC. Li et al. [10] demonstrated that the G allele of rs9261204 increased the risk of lung cancer by 1.45-fold compared to the A allele. Nevertheless, these three SNPs (rs3757328, rs7769930, and rs694055) in ZNRD1-AS1 decreased the risk of cervical cancer [11]. In this meta-analysis, we evaluated the effect of these three SNPs on the risk of cancer among the subgroups by cancer type. We found that the A allele of SNP rs3757328, A allele of SNP rs6940552, and G allele of SNP rs9261204 in ZNRD1-AS1 were associated with increased risk of some cancer types (HCC, lung cancer, and bladder cancer) except cervical cancer.
The meta-analysis had limitations. First, only five individual studies (focused on HCC, lung cancer, bladder cancer, and cervical cancer) were included in our analysis, which impacted the quality of our results. Second, our analysis was limited to individuals of Asian descent. Therefore, the effects of the SNPs on non-Asian populations are not yet clear, and further studies are necessary to confirm our results.
In conclusion, our data indicate that three SNPs in ZNRD1-AS1 were correlated with an increased risk of several cancers. These results must be further evaluated in large-scale, randomized controlled trials involving different ethnic populations and cancers.
MATERIALS AND METHODS
Search strategy
We searched the PubMed, Embase, and Web of Science databases for studies performed prior to June 30, 2016 that reported an association between SNPs in ZNRD1-AS1 and cancer risk. This comprehensive literature search was performed using free-text words combined with Medical Subject Headings, such as “ZNRD1”, “ZNRD1-AS1”, or “lncRNA” and “cancer”, “carcinoma”, “tumor”, “tumour”, or “neoplasm” and “polymorphism”, “variation”, “variant”, “SNP”, “mutation”, or “genotype”. The references cited in the retrieved articles were also reviewed to identify additional eligible studies (Supplemental Figure S1).
Inclusion and exclusion criteria
The study inclusion criteria were the following: (1) case-control design; (2) evaluated associations between SNPs in ZNRD1-AS1 and cancer; (3) provided sufficient data for the allele and genotype frequencies (i.e., rs3757328, rs6940552 or rs9261204); (4) published in English with the full-text article available; and (5) involved human subjects. The exclusion criteria were: (1) review article or commentary; (2) non-English publication; (3) replication of a previous study; and (4) non-human subjects.
Data extraction
Two investigators (PYW and JHL) independently extracted the data from each study, including the surname of the first author, publication year, type of cancer, numbers of cases and controls, ethnicity, genotype platform, and SNP genotype. Disagreement was resolved through a discussion with a third reviewer (YML).
Quality assessment
The methodological quality of each eligible study was evaluated using the NOS. Each study was evaluated based on the selection, comparability, and exposure scores. Summary scores ranging from 0 to 9 points were calculated. Higher score were indicative of a lower risk of bias.
Statistical analysis
Allele contrast, dominant, recessive, homozygous, and heterozygous models were used to analyze the associations between SNPs in ZNRD1-AS1 and cancer risk. We calculated ORs and 95% CIs in order to estimate the strength of the associations. The significance of the ORs was determined using Z tests. Heterogeneity between studies was assessed using the Chi square-based Q statistic. A random effects (DerSimonian-Laird method) or fixed effect (Mantel-Haenszel method) model was used to calculate pooled effect estimates in the presence (P < 0.10) or absence (P > 0.10) of heterogeneity, and subgroup analysis by cancer type was further performed. Sensitivity analysis was performed by excluding one study at a time and recalculating the risk effect. Begg’s and Egger’s tests were performed to evaluate publication bias. Data analysis was performed using the Stata software, version 12.0 (Stata Corporation; College Station, TX, USA). A P value < 0.05 was considered statistically significant.
ACKNOWLEDGMENTS
This study was supported by the National Natural Science Foundation of China Grant (Nos. 31371321, 31440061), the Shandong Science and Technology Committee (Nos. ZR2016CL09, 2015GSF118073, ZR2014HL055), and Foundation of Health and Family Planning Commission of Shandong Province (2015WS0499).
CONFLICTS OF INTEREST
The authors declare no conflicts of interest.
REFERENCES
1. Ponting CP, Oliver PL, Reik W. Evolution and functions of long noncoding RNAs. Cell. 2009; 136:629-641.
2. Alam T, Medvedeva YA, Jia H, Brown JB, Lipovich L, Bajic VB. Promoter analysis reveals globally differential regulation of human long non-coding RNA and protein-coding genes. PLoS One. 2014; 9:e109443.
3. Gutschner T, Diederichs S. The hallmarks of cancer: a long non-coding RNA point of view. RNA Biol. 2012; 9:703-719.
4. Schmitt AM, Chang HY. Long Noncoding RNAs in Cancer Pathways. Cancer Cell. 2016; 29:452-463.
5. Peng W, Gao W, Feng J. Long noncoding RNA HULC is a novel biomarker of poor prognosis in patients with pancreatic cancer. Med Oncol. 2014; 31:346.
6. Zhao Y, Guo Q, Chen J, Hu J, Wang S, Sun Y. Role of long non-coding RNA HULC in cell proliferation, apoptosis and tumor metastasis of gastric cancer: a clinical and in vitro investigation. Oncol Rep. 2014; 31:358-364.
7. Bayram S, Sumbul AT, Dadas E. A functional HOTAIR rs12826786 C>T polymorphism is associated with breast cancer susceptibility and poor clinicopathological characteristics in a Turkish population: a hospital-based case-control study. Tumour Biol. 2016; 37:5577-5584.
8. Yin J, Wen J, Hang D, Han J, Jiang J, Song C, Liu Y, Liu J, Liu L, Zhu L, Chen J, Zhai X, Xie S, Hu Z, Shen H, Dai M, et al. Expression Quantitative Trait Loci for CARD8 Contributes to Risk of Two Infection-Related Cancers--Hepatocellular Carcinoma and Cervical Cancer. PLoS One. 2015; 10:e0132352.
9. Kang M, Sang Y, Gu H, Zheng L, Wang L, Liu C, Shi Y, Shao A, Ding G, Chen S, Tang W, Yin J. Long noncoding RNAs POLR2E rs3787016 C/T and HULC rs7763881 A/C polymorphisms are associated with decreased risk of esophageal cancer. Tumour Biol. 2015; 36:6401-6408.
10. Li D, Song L, Wen Z, Li X, Jie J, Wang Y, Peng L. Strong evidence for LncRNA ZNRD1-AS1, and its functional Cis-eQTL locus contributing more to the susceptibility of lung cancer. Oncotarget. 2016; 7:35813-35817. doi: 10.18632/oncotarget.8411.
11. Guo L, Wen J, Han J, Jiang J, Xie S, Feng X, Wei B, Dai J, Zhang K, Qi J, Ma H, Shi J, Ren J, Zhang Y, Dai M, Hu Z, et al. Expression quantitative trait loci in long non-coding RNA ZNRD1-AS1 influence cervical cancer development. Am J Cancer Res. 2015; 5:2301-2307.
12. Wen J, Liu Y, Liu J, Liu L, Song C, Han J, Zhu L, Wang C, Chen J, Zhai X, Shen H, Hu Z. Expression quantitative trait loci in long non-coding RNA ZNRD1-AS1 influence both HBV infection and hepatocellular carcinoma development. Mol Carcinog. 2015; 54:1275-1282.
13. Liu Z, Song C, Wen J, Xu L, Liu Y, Zhu J, Zhu L, Hu Z, Ma H, Liu L. Hepatitis B virus genotypes, expression quantitative trait loci for ZNRD1-AS1 and their interactions in hepatocellular carcinoma. Oncotarget. 2016; 7:44076-44083. doi: 10.18632/oncotarget.9854.
14. Du M, Wang W, Jin H, Wang Q, Ge Y, Lu J, Ma G, Chu H, Tong N, Zhu H, Wang M, Qiang F, Zhang Z. The association analysis of lncRNA HOTAIR genetic variants and gastric cancer risk in a Chinese population. Oncotarget. 2015; 6:31255-31262. doi: 10.18632/oncotarget.5158.
15. Fan W, Wang Z, Kyzysztof F, Prange C, Lennon G. A new zinc ribbon gene (ZNRD1) is cloned from the human MHC class I region. Genomics. 2000; 63:139-141.
16. Guo W, Zhao YP, Jiang YG, Wang RW, Hong L, Fan DM. Upregulation of ZNRD1 enhances cisplatin resistance in human esophageal cancer cells by regulation of ERCC1 and Bcl-2. Tumour Biol. 2008; 29:188-194.
17. Hong L, Ning X, Shi Y, Shen H, Zhang Y, Lan M, Liang S, Wang J, Fan D. Reversal of multidrug resistance of gastric cancer cells by down-regulation of ZNRD1 with ZNRD1 siRNA. Br J Biomed Sci. 2004; 61:206-210.
18. Hong L, Zhang Y, Han S, Wang J, Shi Y, Pan Y, Liu N, Zhang X, Fan D. Preparation and characterization of a novel monoclonal antibody specific to human ZNRD1 protein. Hybrid Hybridomics. 2004; 23:65-68.
19. Hong L, Han Y, Shi R, Shao X, Sun L, Zhang Y, Huang D, Chen Z, Zhang G, Liang J, Hu S, Fan D. ZNRD1 gene suppresses cell proliferation through cell cycle arrest in G1 phase. Cancer Biol Ther. 2005; 4:60-64.
20. Hong L, Zhao Y, Han Y, Guo W, Jin H, Qiao T, Che Z, Fan D. Mechanisms of growth arrest by zinc ribbon domain-containing 1 in gastric cancer cells. Carcinogenesis. 2007; 28:1622-1628.
21. Hong L, Han Y, Li S, Yang J, Gong T, Li J, Zheng J, Zhang H, Zhao Q, Wu K, Fan D. Role of ZNRD1 (zinc ribbon domain-containing 1) in angiogenesis of leukaemia cells. Cell Biol Int. 2011; 35:321-324.
22. Veyrieras JB, Kudaravalli S, Kim SY, Dermitzakis ET, Gilad Y, Stephens M, Pritchard JK. High-resolution mapping of expression-QTLs yields insight into human gene regulation. PLoS Genet. 2008; 4:e1000214.
23. Stranger BE, Nica AC, Forrest MS, Dimas A, Bird CP, Beazley C, Ingle CE, Dunning M, Flicek P, Koller D, Montgomery S, Tavare S, Deloukas P, Dermitzakis ET. Population genomics of human gene expression. Nat Genet. 2007; 39:1217-1224.