
INTRODUCTION
Studies have implicated lncRNAs in the etiology of a diverse array of cancer types, asserting that lncRNAs have essential roles in tumorigenesis and occupy a critical space in cancer progression and metastasis [1–4]. LncRNA studies have provided us with new perspective for understanding mechanisms of cancer [5, 6]. LncRNAs furnish potential biomarkers for diagnosis and targeting therapies for cancer [7–12]. For example, the lncRNA prostate cancer antigen 3 (PCA3DD3) is a well-documented specific biomarker for prostate cancer [13]. PCA3 regulates a tumor suppressor, PRUNE2 (a human homolog of the Drosophila prune gene), via adenosine deaminase and acting on RNA (ADAR)-dependent adenosine-to-inosine RNA editing [6].
HER3/ErbB3 is a member of the EGFR family of tyrosine kinase receptors (TKRs), which plays a critical role in normal cell growth and development. Upregulation of HER3 has been implicated in the development and progression of various types of cancer [14, 15]. Upon stimulation by the ligand neuregulin (NRG), HER3 heterodimerizes with other members of the EGFR family, which results in its C-terminal tyrosine-phosphorylation and activation of signaling [14, 16]. HER3 activation is associated with resistance to several targeted cancer therapeutics including those targeting HER2 and EGFR [17, 18]. Despite the strong evidence regarding the role of HER3 in cancer, current understanding of the regulation of HER3 expression and signaling in cancer is still limited [14]. The lack of established biomarkers for identification of HER3 driven cancer poses a big challenge in the clinical development of HER3 targeting antibodies [14].
A recent report revealed involvement of lncRNAs in HER2-enriched subtype breast cancer [4]. However, there is no report on lncRNAs in relation to HER3 in the context of cancer. In this study, we report the interplay of the lncRNA LINC00052 and HER3, and the implication of the lncRNA LINC00052/HER3 expression in breast cancer development. Our results from both in vitro cell-based studies and in vivo animal models indicate that LINC00052 expression level represents a potential new biomarker for HER3-targeting cancer therapies.
RESULTS
LINC00052 correlates with HER3 expression in cancer cells
While HER3 expression and signaling are well studied [16, 19, 20], the role of HER3 signaling in transcriptional regulation remains largely unknown. Using a DNA-microarray, we analyzed gene expression profiles in MCF7 cancer cells (an epithelial-luminal breast cancer cell line) stably transduced with HER3-shRNA for HER3 silencing in comparison with scramble-shRNA control cells. The gene profiling analysis identified a number of genes with significant changes in expression level in response to HER3 knockdown, including the lncRNA LINC00052 (Figure 1A and 1B). LINC00052, with previously unknown function, is significantly reduced in HER3-knockdown MCF7 breast cancer cells in comparison with the control cells as indicated by two independent probes (8.1 and 5.8 fold change of mRNA levels for probe 1 and probe 2, respectively, p ≤ 0.0001) (Figure 1B). Genomic in silico analysis shows LINC00052 as a lncRNA (ENSG00000259527) that generates a single predicted primary transcript of 2.94 kb with a mature RNA of 1.966 kb. LINC00052 is located on the positive (+) strand and encompasses the region chr15:87,576,929–87,579,866 (Supplementary Figure S1A). Genome comparative analysis showed that the 3′-end of LINC00052 is highly conserved among mammals (Supplementary Figure S1B) and high homology was found in primate species-conserved tracks (Supplementary Figure S1B and S1C) suggesting a conserved functional role. Although lncRNAs are rarely translated, studies suggest that a class of bifunctional RNAs encoding both mRNAs and functional noncoding transcripts may exist [21–23]. We examined the LINC00052 DNA sequence for potential translational initiation and termination codons and performed immunoblotting analysis. Our data showed no detectable protein product of LINC00052 bearing FLAG-tag inserted before the potential stop-codon (Supplementary Figure S1D).
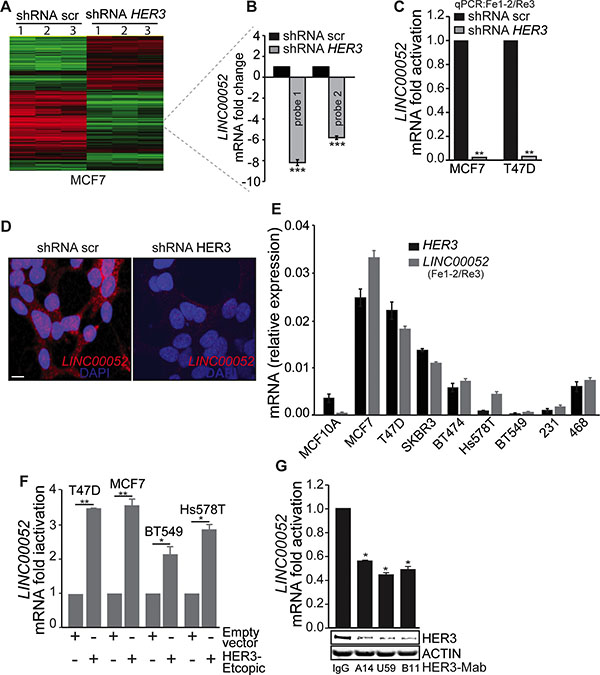
Figure 1: LINC00052 level correlates HER3 expression in breast cancer cells. (A) Heatmap showing the clustering of gene expression for three independent microarrays (referred as 1, 2 and 3) for MCF7/HER3-knockdown and scramble (control-shRNA) cells. (B) Two independent probes for LINC00052 display significant (***p-value < 0.0001) down-regulation of LINC00052 in MCF7/HER3-knockdown cells compared to scramble-shRNA (control) cells. (C) qRT-PCR analysis (using Fe-1-2 and Re3 primers, locations are indicated in the Supplementary Figure S1A and Supplementary Table S1) for LINC00052 expression in MCF7 and T47D stably expressing shRNA HER3 or control constructs (shRNA scr). (D) RNA-fluorescence in situ hybridization (FISH) of LINC00052 in MCF7 cells expressing scramble or HER3-shRNA constructs. Expression is noted in both nucleus and cytoplasm, bar = 10 μm. (E) Breast cancer cells (MCF10A, MCF7, T47D, SKBR3, BT474, Hs578T, BT549, MDA-MB-231 and MDA-MB-468), grown to reach 80% confluence in 10% fetal serum bovine (FBS), were assessed for LINC00052 and HER3 RNA by qRT-PCR (reported as relative expression). (F) Levels of LINC00052, normalized GAPDH, assessed by qRT-PCR, in breast cancer cells (T47D, MCF7, BT549, and Hs578T) stably expressing ectopic HER3. (G) Evaluation of LINC00052, HER3, and ACTIN expression in MCF7 cells subjected for 24 hrs of treatment with 10 μg HER3 blocking antibodies (HER3-Mabs: A14, U59, and B11) or IgG isotype control. In each case, shown is mean ± S.D. of a representative of triplicate experiments *p < 0.05, **p < 0.001 and ***p < 0.0001 (Student’s t-test, knockdown or ectopic-HER3 vs control cells).
To confirm the results from the gene profiling study, we evaluated LINC00052 expression using quantitative PCR (qPCR) in both MCF7 and T47D breast cancer cell lines stably transduced with HER3-shRNA (Supplementary Figure S2A–S2D) in comparison with the corresponding scramble control constructs. Levels of endogenous LINC00052, pre-mRNA and mRNA decreased with HER3 knockdown (Figure 1C; Supplementary Figure S2A–S2D). We further confirmed these findings by FISH analysis where HER3 knockdown also resulted in a reduced endogenous LINC00052 expression in both cytoplasm and nucleus in comparison with the shRNA scramble control (Figure 1D).
Next, we evaluated LINC00052 expression in a panel of breast cancer cell lines with different levels of HER3 expression. Consistently, LINC00052 expression showed positive correlation with HER3 in human breast cancer cells. Cancer cells (MCF7, T47D, and SKBR3) with relatively high-HER3 expression showed higher LINC00052 levels, while low-HER3 expressing cancer cells such as BT549 and MDA-MB-231 showed low LINC00052 levels (Figure 1E). These results indicate a tight correlation between LINC00052 and HER3 expression in breast cancer cells. To further confirm the correlation between HER3 and LINC00052 expression, we established breast cancer cells stably expressing ectopic-HER3. Quantitative RT-PCR analysis showed upregulation of LINC00052 in cancer cells ectopically expressing HER3 when compared with the empty vector control cells (Figure 1F). Furthermore, we treated cancer cells with a panel of anti-HER3 monoclonal antibodies (HER3-Mab) and inhibition of HER3 by the neutralizing antibodies (referred as A14, U59, and B11) resulted in significant decreasing of LINC00052 expression when compared to an IgG isotype control (Figure 1G). Collectively, our data indicate that LINC00052 expression is positively correlated with HER3 levels.
Phosphorylated HER3 correlates with LINC00052 expression
After establishing the correlation of LINC00052 expression with HER3 levels in breast cancer cells, we then investigated the relationship between LINC00052 expression and HER3 phosphorylation. A time course study of LINC00052 expression upon HER3 activation by NRG-1 stimulation was performed. We observed that, upon stimulation with NRG-1, MCF7 breast cancer cells displayed a robust increase of LINC00052 RNA levels along with increased HER3 phosphorylation (Figure 2A). LINC00052 RNA level began to decrease at 120 minutes upon NRG-1 stimulation, which coincides with the decrease of HER3 phosphorylation (Figure 2A). Further, we examined LINC00052 expression in breast cancer cells of HER3-high (MCF7), HER3-knockdown (MCF7/HER3 KD) or HER3-low (BT549, MDA-MB-231 and Hs578T) upon stimulation with NRG-1, and results showed that LINC00052 expression was increased in cells with HER3-high but not knockdown- or HER3-low (Figure 2B). These results indicate that LINC00052 expression is correlated with HER3 activation upon NRG-1-stmulation. Consistently, neutralizing monoclonal antibodies inhibited HER3 activation and resulted in a decrease of LINC00052 levels concomitantly with reduction of total HER3 and pHER3 in comparison to controls (Figure 2C–2E). To determine if the change of LINC00052 expression is HER3 specific, we treated cancer cells with lapatinib (a compound that inhibits kinase activity of HER2 and EGFR) or trastuzumab (a HER2-blocking antibody). Results showed no significant change of LINC00052 levels upon treatment with lapatinib or trastuzumab in comparison to the vehicle control (Supplementary Figure S3A–S3E). To further validate these findings, we expressed HER3 ectopically in breast cancer cells with low endogenous HER3 (BT-549, MAD-MB-231 and Hs578T). Consistently, qRT-PCR results showed increased LINC00052 upon stimulation by NRG-1 when cells had ectopically expressed HER3, and anti-HER3 antibodies can inhibit the levels of LINC00052 (Figure 2F–2H). Collectively, these results indicate that expression of the long noncoding RNA LINC00052 is correlated with HER3 phosphorylation.
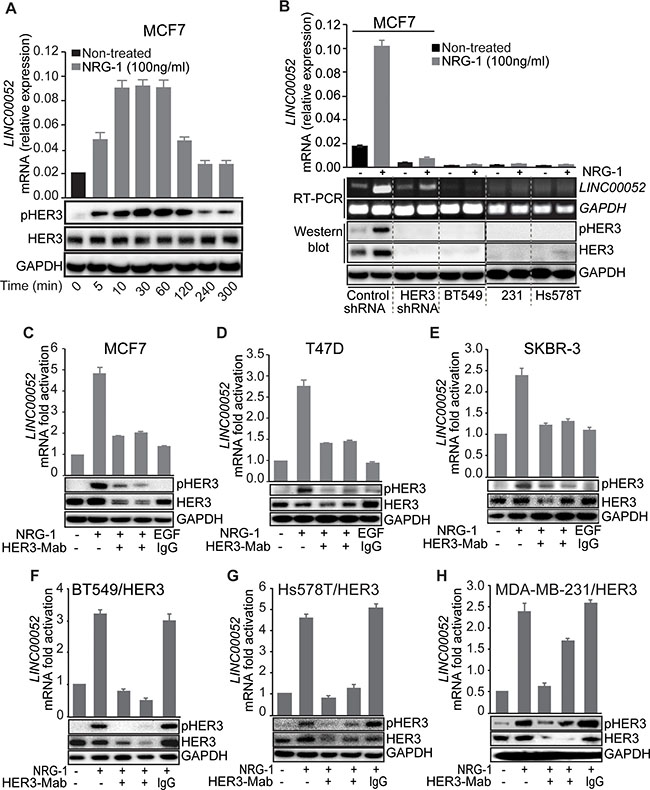
Figure 2: HER3 activation induces LINC00052 expression in breast cancer cells. (A) MCF7 cells were serum-starved, treated with 100 ng/ml NRG-1 (in time-course intervals) or vehicle and evaluated for LINC00052, pHER3, HER3, and GAPDH levels by qRT-PCR and immunoblotting analysis. (B) Breast cancer cell MCF7/shRNA-scramble, MCF7/shRNA-HER3, BT549, MDA-MB-231 and Hs578T) were stimulated with 100 ng/ml NRG-1 or vehicle and subjected to Western blot or qRT-PCR for the evaluation of LINC00052, HER3, pHER3, or GAPDH levels. (C–E) Breast cancer cells MCF7, T47D, and SKBR3 were grown in 10% fetal serum bovine to reach 85% confluence followed by 18 hrs serum-starvation. Subsequently cells were pre-treated for 30 min with 10 μg/ml of HER3 blocking monoclonal antibodies (HER3-Mabs: B14 or U59), followed by 60 min stimulation with 100 ng/ml of NRG-1 (+) or untreated (−) as indicated. EGF-treatment was used as negative control. LINC00052 and HER3 RNA relative expression were analyzed by qRT-PCR and whole cell lysates were analyzed by Western blot with antibodies against HER3, pHER3 and GAPDH. (F–H) Breast cancer cells that have low expression of HER3 (BT549, Hs578T and MDA-MB-231) stably expressing ectopic-HER3 were serum-starved and pre-treated for 30 min with HER3-targeting antibodies B14 or U59 or IgG isotype control followed by 60 min stimulation with 100 ng/ml NRG-1. LINC00052 and HER3 RNA relative expression were analyzed by qRT-PCR. Whole cell lysates were analyzed by Western blot with antibodies against HER3, pHER3, and GAPDH. In each case, shown is mean ± S.D. of a representative of triplicate experiments.
LINC00052 induces HER3 expression in breast cancer cells
Studies have shown that lncRNAs can function in a regulatory feedback-loop through cis- or trans-acting genes [6, 24, 25]. We sought to investigate a possible role of LINC00052 in the regulation of HER3 expression in breast cancer cells. To test this possibility, we altered LINC00052 expression in breast cancer cells MCF7 and T47D by knockdown of LINC00052 using shRNA-silencing or ectopically expressing full non-spliced RNA LINC00052. Results revealed decreasing levels of HER3 expression upon LINC00052-knockdown in comparison to control cells (Figure 3A and 3B; Supplementary Figure S4A and S4B). In contrast, we observed increasing levels of HER3 protein and RNA when LINC00052 was ectopically overexpressed in comparison to control cells (Figure 3C–3F; Supplementary Figure S4C and S4D). To further demonstrate the functional role of LINC00052 in regulating HER3, we performed additional experiments evaluating the other HER family members in breast cancer cells stably expressing the full non-spliced LINC00052 RNA. Ectopic overexpression of LINC00052 induced upregulation of HER3 but not of EGFR, HER2 or HER4 mRNA (Figure 3E and 3F; Supplementary Figure S4E and S4F). Taken together, these data indicate that LINC00052 specifically increases HER3 expression in breast cancer cells.
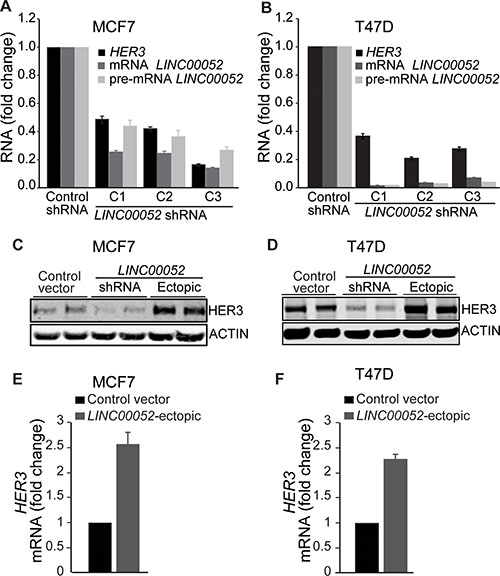
Figure 3: LINC00052 increases HER3 expression in breast cancer cells. (A, B) Breast cancer cells MCF7 or T47D stably expressing three different lentiviral LINC00052-silenced shRNA or shRNA-scramble (control) constructs were grown in 10% fetal serum bovine to reach 85% confluence and subsequently assessed for HER3 and LINC00052 expression by qRT–PCR. (C, D) Whole cell lysates from breast cancer cells MCF7 or T47D stably expressing shRNA-control, GFP, LINC00052 shRNA-silenced or LINC00052-ectopic lentiviral constructs were analyzed by immunoblotting with antibodies against HER3 or ACTIN. (E, F) Evaluation of HER3 RNA levels by qRT-PCR in breast cancer cells MCF7 and T47D stably expressing LINC00052-ectopic or control constructs.
LINC00052 promotes cancer cell growth by increasing HER3 signaling
Recent studies showed that some lncRNAs have essential roles in tumorigenesis, cancer progression and metastasis [1–4]. To understand whether LINC00052 expression promotes growth of breast cancer cells in a high HER3 context, we investigated the function of LINC00052 in MCF7 breast cancer cells stably expressing LINC00052-silenced shRNA, ectopic LINC00052, in comparison with controls. Results showed that elevation of LINC00052 expression in MCF7 cells resulted in enhanced cell survival, spheroid-spreading capability, single cell colony formation, anchorage-independent growth, adherence, and cell growth (Figure 4A–4F; Supplementary Figure S5A–S5D). MCF7 cells with LINC00052-shRNA displayed decreased biological activities measured in these assays as compared to controls (Figure 4A–4F; Supplementary Figure S5A–S5D). These results showed that increase of LINC00052 expression promotes not only cell growth and survival, but also cell adhesion, spreading, and transformation of breast cancer cells. Next, we sought to test whether HER3-neutralizing antibodies could block tumor promoting activity of LINC00052 in breast cancer cells stably expressing ectopic-LINC00052. Indeed, results showed that MCF7 cells with ectopic expression of LINC00052 were more responsive to HER3 blocking antibody treatment. MCF7 cells ectopic expressing LINC00052 expression (LINC00052-ectopic) showed significant inhibition of cell growth by a HER3 blocking antibody as compared with control cells (Figure 4G). Furthermre, we observed that LINC00052-ectopic fails to increase the cell growth of breast cancer MCF7 when HER3 is silenced by shRNA, suggesting that LINC00052 promotes cell growth by increasing HER3 expression (Supplementary Figure S5E and S5F). These data indicate that increased LINC00052 expression renders breast cancer cells more sensitive to HER3-blocking antibodies. Interestingly, MCF7 cells expressing LINC00052-silenced shRNA did not show responsiveness to HER3-blocking antibody treatment when compared to control cells (Figure 4H). Of note that reductions of HER3 levels by the neutralizing antibodies against-HER3 were consistently greater in LINC00052-ectopic cells than in control cells (Figure 4I and 4J). Further, we evaluated phosphorylation levels of HER3, ERK1/2 and AKT in LINC00052-ectopic cells after treatment with HER3-Mabs followed by NRG-1-stimulation. As expected, upon treatment with anti-HER3 antibodies, there was greater reduction of pHER3, pERK1/2, and pAKT in LINC00052-ectopic MCF7 cells when compared to control cells (Figure 4K–4L). Collectively, these results demonstrate that LINC00052 promotes cancer cell growth and survival by upregulating HER3, and that high LINC00052 levels predict an increased sensitivity of breast cancer cells to HER3 neutralizing antibody treatment.
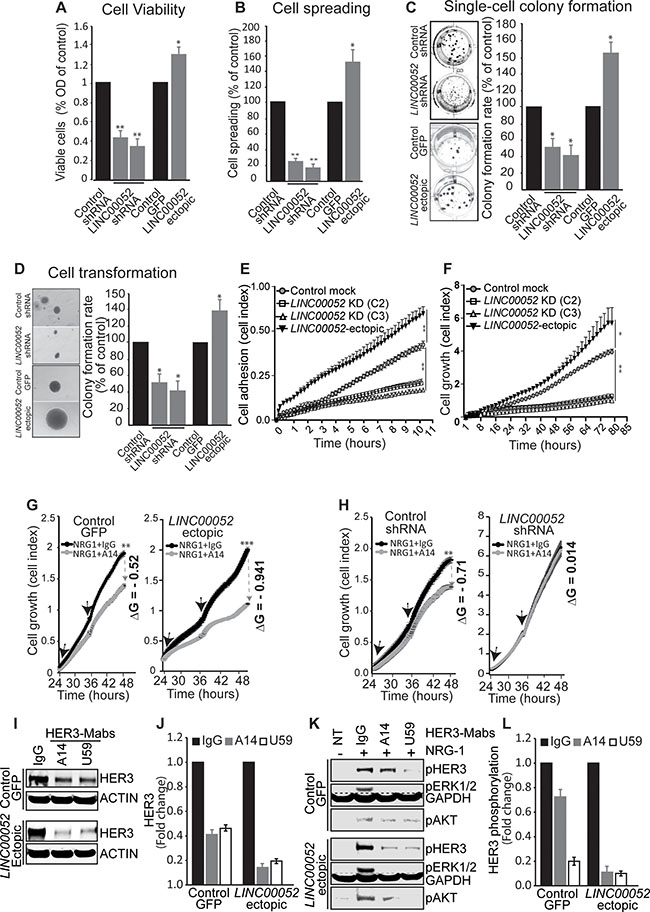
Figure 4: LINC00052 functions in breast cancer cells. (A–F) MCF7 breast cancer cells stably expressing LINC00052-shRNA, LINC00052-ectopic or control lentiviral constructs were subjected to functional assays. (A) MCF7 cell were seeded at 50% confluence in complete medium and grown for 72 hours, cell viability was evaluated using the AlamarBlue assay. Quantitative histograms (fold change) of cell growth rate compared to control cells are shown (representative cell images are reported in Supplementary Figure S5A). (B) MCF7 spheroids harvested after 16 hrs and plated in 12-well plates for 24 hrs. Representative images from 6 spheroids (for each cell line) were evaluated for spreading cell activity (cells migrated out of the spheroid “borders” {arbitrary black linet) were counted and reported as % of spreading of control cells (representative cell images are shown in Supplementary Figure S5B). (C) Single-cell colony formation assay, transduced MCF7 cells (as indicated) were plated in 12-well plates at extremely low density (10–20 cells/cm2) and grown in RPMI medium supplemented with 10% FBS for 4 weeks. Colony number and areas were measured by ImageJ and reported as % of control cells. Representative images and colony formation rate percentage (%) of control cells are reported (additional representative images are shown in Supplementary Figure S5C). (D) Colony formation assay in soft agar. Colonies of transduced MCF7 cells were cultured in 0.35% soft agar in RPMI medium supplemented with 10% FBS. Cells were assessed for anchorage-independent growth for 4 weeks. Representative images (from optical miscroscopy) of single colonies are reported, quantification of ColonyArea are roprted as rate percentage (%) of control cells (additional representative images are shown in Supplementary Figure S5D). (E, F) Effect of LINC00052 knockdown or its ectopic expression on cell adhesion (E) and growth (F). Cells were grown in a pre-coated-fibronectin 96-well E-Plate (ACEA Biosciences) in the presence of RPMI containing 10% (vol/vol) FBS plus NRG-1 and monitored over time by an xCELLigence Real-Time Cell Analysis (RTCA) system for adhesion (over 11 hrs) and growth (over 85 hrs). (G, H) Effect of HER3-neutralizing antibody (A14) on the proliferation of MCF7 breast cancer cells stably-transduced for LINC00052-ectopic, control-GFP lentiviral constructs, LINC00052-shRNA or control shRNA. Serum-starved cells were grown for 24 hrs in RPMI-medium supplemented with 0.5% FBS plus 100 ng/ml NRG-1. Subsequently, cells were treated with HER3-Mab A14 (10 mg/ml refreshed every 12 hrs, as indicated with the black arrows. Cell growth (reported as cell index) was monitored for over time (one read every 15 min) by an xCELLigence Real-Time Cell Analysis (RTCA) system. Change of growth (∆G) was calculated as: ∆G = (Growth with IgG – Growth with HER3-Mab). (I, J) Evaluation of HER3 protein levels by Western blot in whole cell extracts derived from LINC00052-ectopic or control cells subjected to HER3-Mabs (A14, U59) or IgG treatment for 24 hours. (K, L) Immunoblotting analysis of whole cell extracts derived from LINC00052-ectopic or control cells subjected to treatment with HER3-Mabs or isotype IgG (control) for 24 hrs followed by treatment with NRG-1 or vehicle (NT) for 30 min. In each experiment, mean ± SD is shown. *p < 0.05; **p < 0.01 and ***p < 0.0001 (Student’s t-test).
LINC00052 promotes tumor growth in mouse xenograft models
To directly interrogate the function of LINC00052 in xenograft tumor models, MCF7 breast cancer cells stably expressing LINC00052-shRNA, LINC00052-ectopic, or control constructs were subcutaneously implanted in nude mice. Scramble-shRNA cells gave rise to tumors that were, on average, about three times the weight or size of those from mice that received a transplant of cells expressing LINC00052-shRNA (Figure 5A and 5B). We performed ex vivo immunoblotting and qRT-PCR analysis and detected decreases in levels of HER3, pHER3, pAKT, and pERK1/2 in LINC00052-shRNA tumor lysates in comparison with controls (Figure 5C and 5D). In contrast, cancer cells ectopically expressing LINC00052 showed significant increase of tumor growth when compared to controls (Figure 5E and 5F; Supplementary Figure S6A). Moreover, we detected increased levels of HER3, pHER3, pAKT, pERK1/2 and LINC00052 in LINC00052-ectopic xenograft in comparison to control (Figure 5G and 5H). To explore potential clinical application of these findings, we performed serial administration of an anti-HER3 monoclonal antibody (referred as A14) to tumor-bearing mice with established breast cancer xenografts. We observed significantly higher inhibition of tumor growth in LINC00052-ectopic xenograft in comparison with the inhibition of GFP-control xenograft (Figure 5I–5K; Supplementary Figure S6B). Furthermore, we observed decreased levels of HER3, pHER3, pAKT, and pERK1/2 in LINC00052-ectopic xenograft treated with HER3 blocking antibody as compared with controls (Figure 5L). Interestingly, qRT-PCR analysis show LINC00052 levels also decreased after HER3-targeting antibodies treatments (Figure 5M). These results support the notion that LINC00052 expression plays an important role in HER3 expression and signaling.
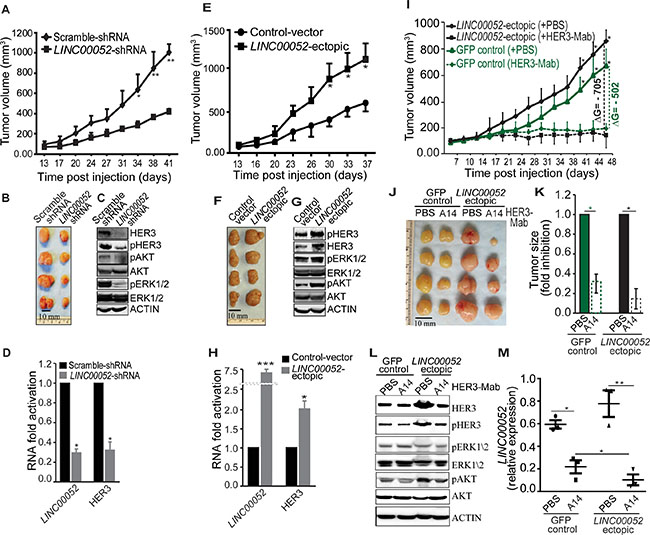
Figure 5: Functions of LINC00052 in breast tumor xenograft models. (A–D) Female immunodeficient nude mice received subcute (sc) injection of 5×10⁶ MCF7 cells stably expressing LINC00052 silenced or negative control constructs. Tumor volumes, measured twice a week, were plotted over time (A). End-point experiment 6-weeks tumors are shown (B). Immunoblotting analysis of xenograft whole tissue extracts for HER3, pHER3, pAKT, AKT, pERK1/2, ERK1/2 and ACTIN (C). RNA analysis for LINC00052 and HER3 levels in the whole tissue extract of xenografts (D). (E–H) Tumor growth in mice bearing MCF7 xenografts from cells stably expressing LINC00052-ectopic or control constructs; volume (mm3) plotted over time (E). End-point experiment 6-week tumors are shown (F). Immunoblotting analysis of xenograft whole tissue extracts for HER3, pHER3, pAKT, AKT, pERK1/2, ERK1/2 and ACTIN (G). Quantitative-RT-PCR evaluation of LINC00052 and HER3 RNA expression in the whole tissue extract of xenografts (H). (I–M) In vivo HER3-antibody treatment of nude mice bearing MCF7 xenografts of cells stably expressing LINC00052-ectopic or control GFP constructs. Two cohorts of SCID mice with size-matched tumors (n = 6/group) received 10 μg/gram of mouse weight per dose of HER3-Mab or negative control-PBS. Treated mice and controls received a series of doses (n = 9) through intraperitoneal (i.p.) administration twice weekly. Tumor volumes, measured before each administration, were plotted over time (I), and representative tumors at the experimental end-point are shown (J). Evaluation of the change of tumor growth, expressed as ∆G = (average of tumor size treated with HER3-Mab average of tumor size treated with control-PBS) (K). Immunoblotting analysis of xenografts whole tissue extracts for HER3, pHER3, pAKT, AKT, pERK1/2, ERK1/2 and ACTIN (L). Quantitative RT-PCR evaluation of LINC00052 and HER3 RNA expression in the whole tissue extract of xenografts (m). In each experiment, 5-6 mice per group were treated. Mean ± SD is shown. *p < 0.05, **P < 0.01.
DISCUSSION
Here, we describe for the first time a regulatory interplay between the long noncoding RNA designated as LINC00052 and HER3 expression in breast cancer cells. Our in vitro and in vivo data showed that breast cancer cells with high HER3 but not knockdown or low-HER3 levels displayed upregulation of LINC00052 expression. Interestingly, we found that elevation of LINC00052 levels induce HER3 expression and signaling but not EGFR, HER2 or HER4 and exerts increased growth of breast cancer cells. In contrast, LINC00052-silencing resulted in diminished HER3 expression and cell growth suggesting that LINC00052 exerts an important role for HER3 regulation in HER3-enriched breast cancer cells. Importantly, our results showed that LINC00052 expression was strongly suppressed in breast cancer cells subjected to HER3 neutralizing monoclonal antibody treatment. Studies with mouse xenograft model showed that high LINC00052 levels predict activation of HER3-mediated signaling and may therefore serve as a biomarker for HER3 targeted antibody cancer therapies.
Limited studies have been reported on the role of lncRNAs regulation of the EGFR family of tyrosine kinase receptors which includes HER3. A recent study reported the expression of lncRNAs in a HER2-enriched breast cancer subtype [4]. In another report, a cytoplasmic lncRNA regulator of EGFR, LINK-A (long intergenic non-coding RNA for kinase activation), was identified to mediate HB-EGF-triggered, EGFR:GPNMB heterodimer-dependent HIF1α phosphorylation [26]. LINC00052 has been found expressed in human non-triple negative breast cancer subtypes [27]. Another recent study investigated neurotrophic tyrosine kinase receptor type 3 (NTRK3) as a target gene of LINC00052, hypothesizing a role in inhibiting invasion and migration of hepatocarcinoma cells SMMC7721 through complementing with miR- 128 and miR-485-3p and down-regulating NTRK3 [28]. Interestingly, a comprehensive analysis has shown that LINC00052 is among the lncRNAs marked by more enhancer chromatin modifications (i.e., H3k27ac) in breast cancer MCF7 cells versus the normal cells HMECs [29]. However, additional mechanistic studies of LINC00052 chromatin modifications will be necessary to investigate the role of its in the regulation of HER3 in breast cancer subtype these modifications might occur. Genomic characterization study of lncRNAs has revealed significant upregulation of numerous lncRNAs in breast cancer (T) versus non-tumor tissue (N) [30] including LINC00052. Results show that LINC00052 is more expressed in tumor versus non-tumor tissues (T/N 6.25, p value = 0.00013) [30]. Independently, we performed in silico analysis for LINC00052 and HER3 expression in the GENT database (http://medical-genome.kribb.re.kr/GENT/). Interestingly, results show that both LINC00052 and HER3 mRNA expression were elevated in breast cancer compared to normal tissue (Supplementary Figure S7A and S7B). These data support our observation that LINC00052 plays a role in breast cancer development and progression.
To the best of our knowledge no information has been reported on the regulation of HER3 in relation to lncRNAs expression in the context of normal physiology or cancer. Here, we demonstrated that LINC00052 expression is correlated with NRG1-HER3 axis and revealed a regulatory interplay between LINC00052 and HER3 in breast cancer. A large number of studies have showed that expression of lncRNAs is frequently dysregulated in cancer tissues and their expression is strikingly cell type specific as compared with protein-coding genes [30–35]. The relatively high expression of LINC00052 in breast cancer cells with high HER3 suggests its functional roles in cancer. However, the detailed mechanisms of regulation involving LINC00052 require further investigation.
Despite the strong evidence regarding the role of HER3 in cancer, a comprehensive mechanism of HER3 regulation of in cancer is incompletely understood. Recently, we identified two novel partners and regulators of HER3. The E3 ubiquitin ligase NEDD4 is a negative regulator of HER3 level and signaling, and NEDD4 expression was inversely correlated with HER3 levels in prostate cancer clinical samples, and its expression was suggested to serve a biomarker for HER3 targeted antibody cancer therapies [20]. DJ-1/PARK7 (Parkinson Protein 7) is a novel interaction partner of HER3 and high DJ-1 expression in breast cancer cells predicts elevated HER3 signaling and may therefore serve as a biomarker for HER3 targeted antibody cancer therapies [36]. The expression and regulation of LINC00052 could open up interesting new perspectives for the understanding of HER3 regulation in breast cancer. We observed that elevation of LINC00052-ectopic expression leads to better response of breast cancer cells to HER3-targeting antibody treatment, suggesting clinical relevance of LINC00052 as a potential biomarker for HER3-targeting therapies.
MATERIALS AND METHODS
Cells, antibodies, and other reagents
Anti-ErbB3 antibody RTJ2 (Abcam); anti-erbB-3/HER-3 antibody, clone 2F12 (Millipore); mouse anti-human c-erbB-3 (BD Biosciences); phospho-HER3/ErbB3 (Tyr1289) (21D3) rabbit mAb, anti-b-actin, anti-b-tubulin (Santa Cruz); anti-GAPDH, anti-AKT, anti-pAKT, anti-pERK1/2, anti-p44/42 MAP kinase (Cell Signaling Technology) were used in the study. Secondary antibodies were purchased from Jackson ImmunoResearch or Invitrogen. DNaseI-RNase free and Ribonucleoside-vanadyl complex were from NEB. Human tumor cell lines used (BT-549, BT-474, Hs587T, MCF-7, MCF10A, SKBR-3, MDA-MB-231, MDA-MB-468 and HEK293) were from ATCC and grown in RPMI or D-MEM containing 10% FBS. The HER3 neutralizing antibodes (HER3Mabs) were produced in our laboratory and described previously [20, 36]. Breefly, the HER3 neutralizing antibodies HER3Mabs are a monoclonal antibodies with backbone of IgG1. HER3Mabs were expressed in HEK293 freestyle cells (Life Technologies) and purified to above 95% purity using protein A/G affinity chromatography. Antibody purity was verified by protein gel electrophoresis and antibody binding was confirmed by ELISA binding assays, flow cytometry analysis. The ability to inhibit HER3 phosphorylation upon NRG-1 activation were verified by ELISA and WBs as described by our group previously [19].
Microarray
For microarray analyses, we have used three independent preparations of RNA from MCF7 cells stably expressing shRNA-scr (shRNA-scramble) and HER3 (HER3-shRNA lentiviral construct, referred as #619). Total RNA (500 ng) was used for labeling and hybridization according to the manufacturer’s protocols (Illumina, Inc) using Illumina’s HumanHT-12 v4 Expression BeadChip Kit. The BeadChips were scanned with Illumina BeadArray Reader (Illumina, Inc). The results of microarray data were extracted with Bead Studio 3.7 (Illumina, Inc.) without any normalization or background subtraction. Gene expression data were normalized using quantile normalization method in LIMMA package in R (www.r-project.org). The expression level of each gene was transformed into a log2 before further analysis. To select genes that were differentially expressed in two culture groups, we used a class comparison tool in BRB array tools (v3.6; Biometrics Research Branch, National Cancer Institute, Bethesda, MD) as a method for two-sample t-test with the estimation of false discovery rate. To avoid potential false-positive genes because of technical variance, all experiments were carried out in triplicates.
Bioinformatics and sequence analysis
Chromosomal locations, annotated transcripts, spliced expressed sequence tags, and sequence mapping were visualized on the Genome Browser from the University of California-Santa Cruz (www.genome.ucsc.edu), by using the latest version of the human genome assembly (hg19) available. Conserved domain analyses were performed through the Conserved Domain Database and sequence alignments were made with either www.ncbi.nlm.nih.gov/Structure/cdd/wrpsb.cgi or http://useast.ensembl.org/index.html.
Cloning and cDNA generation
Total RNA and genomic DNA from cancer cell lines were isolated through the RNeasy kit (Qiagen) or the All-in-One kit (Norgen Biotek). Total RNA samples from human normal tissues (prostate, brain, liver, kidney, breast, lung, pancreas, spleen, and testis) were commercially obtained (Stratagene). cDNAs were synthesized by using Kit iScript™ cDNA Synthesis (BioRad), SuperScript III reverse transcriptase (Invitrogen or Promega) from total RNA, with N15 random pentadecamers, oligo dT primers, or specific oligonucleotides. Full non-spliced LINC00052, LINC00052-FLAG or HER3-FLAG were amplified by PCR with KAPA HiFi DNA polymerase (KAPA Biosystems), cloned under CMV promoter into modified PLVX vector (Clontech) and verified coding sequences were fully sequenced (Supplementary Table S1).
Small-interfering RNA and short-hairpin RNA
Experiments were performed with retroviral pLKO.1 vectors from the RNAi Consortium (TRC) lentiviral shRNA library (Open Biosystems) expressing specific shRNAs LINC00052-silencing: TRCN0000186098 (referred as C1), TRCN0000184966 (referred as C2) and TRCN0000186427 (referred as C3). ShRNAs HER3-silencing: TRCN0000040109 (referred as # 40109), TRCN0000000619 (referred as #619) and TRCN0000000623 (referred as # 623). Stable clones were maintained under puromycin selection. Scramble shRNAs or validated non-targeting sequences served as negative controls (Open Biosystems).
Lentivirus preparation
Lentiviral vectors (pCCLsin.PTT.PGK.EGFP.Wpre, pMDLg/pRRE, pRSV-Rev, and pMD2.VSVG) were used as described [6]. Briefly, HEK293FT cells were transiently transfected (Lipofectamine 2000; Invitrogen) for 16 hours, after which the lentiviruses were harvested 24 and 48 hours later and filtered through 0.22 μm pore cellulose acetate filters. Recombinant lentiviruses were concentrated by Amicon Ultra-15 Centrifugal Filter Units (NMWL of 30 kDa). Lentiviral vector viability was confirmed by reporter gene expression and drug selection.
Quantitative RT-PCR
RT-qPCR analysis was performed with SYBR-green in a 7500 Fast Real-Time PCR system (Applied Biosystems) or in a Biorad CFX96 Real-Time PCR system. Gene expression levels were normalized against the average of threshold cycle (Ct) of 3 standard endogenous controls (GAPDH, ACTIN or HPRT), and the results were analyzed according to the DDCt method. Data were reported as fold induction or relative expression; samples were normalized on to their internal housekeeping genes followed by normalization of each sample to its control. For the oligonucleotides used in this work (Supplementary Table S1).
RNA fluorescent in-situ hybridization and confocal microscopy
To detect LINC00052 RNA, cells were fixed in 3.6% formaldehyde for 3 min at RT, followed by acetone:methanol 1:1 (vol/vol) for 5 min at 20°C. Cells were permeabilized in PBS containing 0.3% Triton X-100 and 5 mM vanadyl ribonucleoside complex (Invitrogen) on ice for 5 min; vanadyl ribonucleoside complex (an RNase inhibitor) was omitted if the RNase enzymatic activity was to be determined. Cells were washed three times in PBS, for 10 min, and rinsed once in 2× saline-sodium citrate (SSC) buffer prior to hybridization. Hybridization was carried out by using labeled Cy3, DNA-oligonucleotide probes in a moist chamber at 42°C overnight as described [6].
Cell growth and adhesion assays
Cells were seeded in 200 μl growth medium at a density of 5,000–10,000 cells per well onto E-Plates 96 (ACEA Biosciences). Cell attachment and growth were monitored every 15 min for over 100 hours in the xCELLigence instrument (ACEA Biosciences). Cell growth assays were also performed with the AlamarBlue® cell survival reagent or MTS (Invitrogen, according to manufacturer’s instructions), comparable results were observed. For cell adhesion assay, cells were seeded in 200 μl of RPMI medium supplemented with 10% FBS at a density of 5,000–10,000 cells per well onto E-Plates 96. Cell adhesion was monitored every 15 min for 11 hours in the xCELLigence instrument.
Cell survival assay
Cells were plated at 5–10 × 103 cells per well in 96-well plates and grown for 48 h. The AlamarBlue® dye assay was performed according to the manufacturer›s protocol. The experiment was performed in quintuplicate. For cell counting, cells were trypsinized and counted using the trypan blue exclusion method to quantify cell viability.
Analysis of tumor cell-derived spheroids spreading
Tumor cell-derived spheroids were prepared by growing 500–2000 cells in non-adherent 96-microwell culture dishes for 18 hours in RPMI containing 10% FBS and 0.2% methylcellulose. MCF7-derived spheroids were grown for 24 hrs in fibronectin coated Nunc Lab-Tek Chamber Slide system. Representative images of 6 spheroids were evaluated for the number of cells migrated out of the spheroids “borders” (black line, as showed in Supplementary Figure S5B), data are reported as % of spreading of control cells.
Soft agar colony and single colony formation assay
Cells transduced with the indicated constructs were suspended at either 1500 cells per well in 2 ml of 0.35% low-melting agarose in 6-well plate culture dishes containing 0.7% agarose base. Triplicates were prepared and evaluated for each construct. Colonies were allowed to form at 37°C under standard tissue culture conditions for 4 weeks. After incubation, staining of the colonies with 0.005% crystal violet enabled visual inspection, photographs, and optical density measurements after crystal violet solubilization. For the single-cell colony formation assay, transduced cells (as indicated) were plated in 12-well plates at extremely low density (10–20 cells/cm2) and grown in RPMI medium supplemented with 10% FBS for 4–6 weeks. After incubation, staining of the colonies with 0.005% crystal violet enabled visual inspection, photographs, ColonyArea and optical density measurements were performed after crystal violet washing. Representative images and colony formation rate percentage (%) of control cells are reported. Colony number and areas were measured by ImageJ and expressed as % of control cells.
Western blot analysis
The mixture of cell extract and antibody was then incubated with Pierce™ Protein A/G Magnetic Beads (Thermo Scientific) at 4°C for 2 h, and washed 4 times with NP-40 lysis buffer. The immunoprecipitated proteins were boiled for 5 min in Laemmli sample buffer and separated by SDS–PAGE. Proteins were separated by Proteins were separated by 4–12% bis-Tris NuPAGE (Invitrogen) as indicated, transferred to nitrocellulose membranes, and immunoblotted with specified antibodies.
RNA and proteins extraction from mouse xenograft of breast tumor tissue
Tumor lysates were prepared as described [20], briefly using the gentleMACS cell dissociator (Miltenyl Biotec) by adding RIPA buffer containing proteinase inhibitor cocktails into finely sliced frozen tumor pieces (1 mg each into 1 mL buffer). RNA and proteins were extracted from 100 l of tissue extracts by using sequential isolation of total RNA, genomic DNA and total proteins from the same sample (Norgen Biotek Corp). Proteins were cleared and quantified by using Pierce™ BCA Protein Assay Kit (Thermo Scientific).
Tumor-bearing mouse studies
MCF7 (5–10 × 106) cells were injected subcutaneously (s.c.) into each right side of five 6 week-old female nude mice as described [20]. After 10 days tumor volume was measured every 48 h. MCF7 cell lines stably expressing ectopic LINC00052, control vector, LINC00052-silenced and control-shRNA were used in the studies. In each case, stably expressing pool transduced cells and their corresponding controls were allowed to grow for 48 hours to reach 85% confluence. Afterwards, paired test and control tumor cells were counted, washed in serum-free medium, and re-suspended to a final concentration of 5 × 10⁷/ml in serum- and phenol-free basic RPMI medium. Cells were subsequently mixed in 50% volume of phenol-free Matrigel™ (Becton Dickinson), and cell suspensions (final volume of 200 μl containing 5–10 × 106 cells) were administered subcutaneously in the right flanks of 6-week-old female nude mice. Tumor xenograft growth was monitored serially over time. All animal experimentation was reviewed and approved by the Institutional Animal Care and Use Committee (IACUC) of the University of Texas Health Science Center at Houston.
Statistical analysis
For the cell proliferation assay of stable cell lines, we performed two-way analysis of variance (ANOVA) at each time point. For other cell line experiments, statistical differences (P-values) among groups were obtained using a two-sided Student’s t-test. All experiments were performed in triplicate. Statistical procedures were performed using Graphpad Prism 5 software (GraphPad Software). We summarized LINC00052 and HER3 expression in the samples by the use of standard descriptive statistics for continuous variables or tabulations for categorical variables.
Abbreviations
AKT, protein kinase B; DAPI, 4′, 6-diamidino-2-phenylindole; EGFR, epidermal growth factor receptor; ERK, extracellular-regulated kinase; FACS, fluorescence-activated cell sorting; FBS, Fetal Bovine Serum; FISH, Fluorescence in situ hybridization; HER, human epidermal growth factor receptor; lncRNA, long noncoding RNA; MCF7, an epithelial-luminal breast cancer cell line; NRG, neuregulin; PBS, phosphate buffered saline, shRNA, short hairpin RNA; T47D, an epithelial-luminal breast cancer cell line.
ACKNOWLEDGMENTS
We thank Ms. Hui Deng and Dr. Leike Li for technical assistance. We thank Dr. Georgina Salazar for her critical reading of the manuscript. The work was partially funded by grants from the Texas Emerging Technology Fund, Johnson and Johnson, and the Welch Foundation grant no. AU00024.
CONFLICTS OF INTEREST
The authors declare no financial interest.
Authors’ contributions
A.S., A.Z., and N.Z. conceptualized the project and analyzed data; AS designed and conducted experiments; X.F. conducted the animal studies; S.Z. carried out part of the cell culture and Western blotting studies; B.K.C. performed the Microarray analysis; A.S., A.Z., and N.Z. wrote the manuscript.
REFERENCES
1. Gupta RA, Shah N, Wang KC, Kim J, Horlings HM, Wong DJ, Tsai MC, Hung T, Argani P, Rinn JL, Wang Y, Brzoska P, Kong B, et al. Long non-coding RNA HOTAIR reprograms chromatin state to promote cancer metastasis. Nature. 2010; 464:1071–1076.
2. Pauli A, Valen E, Lin MF, Garber M, Vastenhouw NL, Levin JZ, Fan L, Sandelin A, Rinn JL, Regev A, Schier AF. Systematic identification of long noncoding RNAs expressed during zebrafish embryogenesis. Genome Res. 2012; 22:577–591.
3. Leucci E, Vendramin R, Spinazzi M, Laurette P, Fiers M, Wouters J, Radaelli E, Eyckerman S, Leonelli C, Vanderheyden K, Rogiers A, Hermans E, Baatsen P, et al. Melanoma addiction to the long non-coding RNA SAMMSON. Nature. 2016; 531:518–522.
4. Yang F, Lyu S, Dong S, Liu Y, Zhang X, Wang O. Expression profile analysis of long noncoding RNA in HER-2-enriched subtype breast cancer by next-generation sequencing and bioinformatics. Onco Targets Ther. 2016; 9:761–772.
5. Quinn JJ, Chang HY. Unique features of long non-coding RNA biogenesis and function. Nat Rev Genet. 2016; 17:47–62.
6. Salameh A, Lee AK, Cardo-Vila M, Nunes DN, Efstathiou E, Staquicini FI, Dobroff AS, Marchio S, Navone NM, Hosoya H, Lauer RC, Wen S, Salmeron CC, et al. PRUNE2 is a human prostate cancer suppressor regulated by the intronic long noncoding RNA PCA3. Proc Natl Acad Sci USA. 2015; 112:8403–8408.
7. Cao Y, Wang P, Ning S, Xiao W, Xiao B, Li X. Identification of prognostic biomarkers in glioblastoma using a long non-coding RNA-mediated, competitive endogenous RNA network. Oncotarget. 2016; 7:41737–41747. doi: 10.18632/oncotarget.9569.
8. Mouraviev V, Lee B, Patel V, Albala D, Johansen TE, Partin A, Ross A, Perera RJ. Clinical prospects of long noncoding RNAs as novel biomarkers and therapeutic targets in prostate cancer. Prostate Cancer Prostatic Dis. 2016; 19:14–20.
9. Fatima R, Akhade VS, Pal D, Rao SM. Long noncoding RNAs in development and cancer: potential biomarkers and therapeutic targets. Mol Cell Ther. 2015; 3:5.
10. Wapinski O, Chang HY. Long noncoding RNAs and human disease. Trends Cell Biol. 2011; 21:354–361.
11. Chen G, Wang Z, Wang D, Qiu C, Liu M, Chen X, Zhang Q, Yan G, Cui Q. LncRNADisease: a database for long-non-coding RNA-associated diseases. Nucleic Acids Res. 2013; 41:D983–986.
12. Wahlestedt C. Targeting long non-coding RNA to therapeutically upregulate gene expression. Nat Rev Drug Discov. 2013; 12:433–446.
13. de Kok JB, Verhaegh GW, Roelofs RW, Hessels D, Kiemeney LA, Aalders TW, Swinkels DW, Schalken JA. DD3(PCA3), a very sensitive and specific marker to detect prostate tumors. Cancer Res. 2002; 62:2695–2698.
14. Mujoo K, Choi BK, Huang Z, Zhang N, An Z. Regulation of ERBB3/HER3 signaling in cancer. Oncotarget. 2014; 5:10222–10236. doi: 10.18632/oncotarget.2655.
15. Baselga J, Swain SM. Novel anticancer targets: revisiting ERBB2 and discovering ERBB3. Nat Rev Cancer. 2009; 9:463–475.
16. Choi BK, Cai X, Yuan B, Huang Z, Fan X, Deng H, Zhang N, An Z. HER3 intracellular domains play a crucial role in HER3/HER2 dimerization and activation of downstream signaling pathways. Protein Cell. 2012; 3:781–789.
17. Zhang N, Chang Y, Rios A, An Z. HER3/ErbB3, an emerging cancer therapeutic target. Acta Biochim Biophys Sin (Shanghai). 2016; 48:39–48.
18. Sergina NV, Rausch M, Wang D, Blair J, Hann B, Shokat KM, Moasser MM. Escape from HER-family tyrosine kinase inhibitor therapy by the kinase-inactive HER3. Nature. 2007; 445:437–441.
19. Choi BK, Fan X, Deng H, Zhang N, An Z. ERBB3 (HER3) is a key sensor in the regulation of ERBB-mediated signaling in both low and high ERBB2 (HER2) expressing cancer cells. Cancer Med. 2012; 1:28–38.
20. Huang Z, Choi BK, Mujoo K, Fan X, Fa M, Mukherjee S, Owiti N, Zhang N, An Z. The E3 ubiquitin ligase NEDD4 negatively regulates HER3/ErbB3 level and signaling. Oncogene. 2015; 34:1105–1115.
21. Hube F, Guo J, Chooniedass-Kothari S, Cooper C, Hamedani MK, Dibrov AA, Blanchard AA, Wang X, Deng G, Myal Y, Leygue E. Alternative splicing of the first intron of the steroid receptor RNA activator (SRA) participates in the generation of coding and noncoding RNA isoforms in breast cancer cell lines. DNA Cell Biol. 2006; 25:418–428.
22. Ingolia NT, Lareau LF, Weissman JS. Ribosome profiling of mouse embryonic stem cells reveals the complexity and dynamics of mammalian proteomes. Cell. 2011; 147:789–802.
23. Ulveling D, Francastel C, Hube F. Identification of potentially new bifunctional RNA based on genome-wide data-mining of alternative splicing events. Biochimie. 2011; 93:2024–2027.
24. Maass PG, Rump A, Schulz H, Stricker S, Schulze L, Platzer K, Aydin A, Tinschert S, Goldring MB, Luft FC, Bahring S. A misplaced lncRNA causes brachydactyly in humans. J Clin Invest. 2012; 122:3990–4002.
25. Wilusz JE, JnBaptiste CK, Lu LY, Kuhn CD, Joshua-Tor L, Sharp PA. A triple helix stabilizes the 3’ ends of long noncoding RNAs that lack poly(A) tails. Genes Dev. 2012; 26:2392–2407.
26. Lin A, Li C, Xing Z, Hu Q, Liang K, Han L, Wang C, Hawke DH, Wang S, Zhang Y, Wei Y, Ma G, Park PK, et al. The LINK-A lncRNA activates normoxic HIF1alpha signalling in triple-negative breast cancer. Nat Cell Biol. 2016; 18:213–224.
27. Lv M, Xu P, Wu Y, Huang L, Li W, Lv S, Wu X, Zeng X, Shen R, Jia X, Yin Y, Gu Y, Yuan H, et al. LncRNAs as new biomarkers to differentiate triple negative breast cancer from non-triple negative breast cancer. Oncotarget. 2016; 7:13047–13059. doi: 10.18632/oncotarget.7509.
28. Xiong D, Sheng Y, Ding S, Chen J, Tan X, Zeng T, Qin D, Zhu L, Huang A, Tang H. LINC00052 regulates the expression of NTRK3 by miR-128 and miR-485-3p to strengthen HCC cells invasion and migration. Oncotarget. 2016; 7:47593–47608. doi: 10.18632/oncotarget.10250.
29. Su X, Malouf GG, Chen Y, Zhang J, Yao H, Valero V, Weinstein JN, Spano JP, Meric-Bernstam F, Khayat D, Esteva FJ. Comprehensive analysis of long non-coding RNAs in human breast cancer clinical subtypes. Oncotarget. 2014; 5:9864–9876. doi: 10.18632/oncotarget.2454.
30. Yan X, Hu Z, Feng Y, Hu X, Yuan J, Zhao SD, Zhang Y, Yang L, Shan W, He Q, Fan L, Kandalaft LE, Tanyi JL, et al. Comprehensive Genomic Characterization of Long Non-coding RNAs across Human Cancers. Cancer Cell. 2015; 28:529–540.
31. Cabili MN, Trapnell C, Goff L, Koziol M, Tazon-Vega B, Regev A, Rinn JL. Integrative annotation of human large intergenic noncoding RNAs reveals global properties and specific subclasses. Genes Dev. 2011; 25:1915–1927.
32. Mercer TR, Mattick JS. Structure and function of long noncoding RNAs in epigenetic regulation. Nat Struct Mol Biol. 2013; 20:300–307.
33. Mercer TR, Dinger ME, Sunkin SM, Mehler MF, Mattick JS. Specific expression of long noncoding RNAs in the mouse brain. Proc Natl Acad Sci USA. 2008; 105:716–721.
34. Ravasi T, Suzuki H, Pang KC, Katayama S, Furuno M, Okunishi R, Fukuda S, Ru K, Frith MC, Gongora MM, Grimmond SM, Hume DA, Hayashizaki Y, et al. Experimental validation of the regulated expression of large numbers of non-coding RNAs from the mouse genome. Genome Res. 2006; 16:11–19.
35. Prensner JR, Chinnaiyan AM. The emergence of lncRNAs in cancer biology. Cancer Discov. 2011; 1:391–407.
36. Zhang S, Mukherjee S, Fan X, Salameh A, Mujoo K, Huang Z, Li L, Salazar GT, Zhang N, An Z. Novel association of DJ-1 with HER3 potentiates HER3 activation and signaling in cancer. Oncotarget. 2016; 7:65758–69. doi: 10.18632/oncotarget.11613.