
INTRODUCTION
Hydrogen peroxide (H2O2) is a signaling molecule critically involved in various physiological and pathological processes, such as cell migration, cell proliferation, immune response, and circadian rhythm [1, 2]. However, the difficulty of detecting H2O2 has been an obstacle in investigating its involvement in health and disease. Over the past few decades, a myriad of methods for analytical quantification of H2O2 have been developed, based on mass spectrometry [3], fluorescence [4], and chemiluminescence [5]. In addition, electrochemical sensors have been developed for the determination of H2O2. However, most of the electrochemical sensors are based on enzymes and fraught with issues that include low reproducibility and high instability, because enzymes require specific environmental conditions to maintain their activity [6]. Thus, the preparation of non-enzymatic sensors for detecting H2O2 is believed to have broader applications.
Polyaniline (PANI) is a light-weight, conductive polymer that has been used to modify electrode surfaces due to its excellent electrochemical activity, biocompatibility and low production cost [7–9]. For example, Zhang et al. successfully detected NO3- using a PANI-platinum nanoparticle (PtNP)-coated electrode [10]. Similarly, Naim et al. used thermal annealing to prepare a PANI-Ag-Fe nanocomposite thin film that served as an electrochemical E. coli sensor [11]. PANI-based sensors work well under neutral pH conditions; however, the conductivity and electrochemical activity of PANI is strongly inhibited in solutions with pH values higher than 6 [12]. Moreover, the low cycle time of pure PANI also limits its applications. It has been shown that introducing additional functional groups or dopants can greatly enhance the conductivity and stability of PANI for the purpose of electrode modification [13, 14].
In comparison to other carbon-based materials, the hydrophilic oxygenous group of graphene oxide (GO) results in increased specific surface area and improved water solubility compared to carbon nanotubes. GO could be selected as the dopant for the synthesis of PANI, because it can not only serve as an electrochemical and mechanical supporting material, but can also supply active sites for PANI polymerization. A similar synthetic method was used to prepare supercapacitor electrodes with graphene/polyaniline nanofiber composites [15]. Previous studies have shown that PtNPs can catalyze H2O2 reduction and decrease the oxidation/reduction overvoltage in H2O2 detection [16, 17], a critical factor for avoiding interference from other substances present in solution [18, 19]. Thus, integration of PtNPs into reduced GO-PANI (rGO-PANI) composites can improve synthetic methods, while also enhancing the performance of the material in non-enzymatic H2O2 analysis.
In the present study, we developed a novel nanocomposite-based sensor for non-enzymatic detection of H2O2, by electrodepositing PtNPs on the surface of the rGO-PANI-coated glassy carbon electrode (GCE). The rGO-PANI-PtNP/GCE had significant advantages over previously reported H2O2 sensors, both in electrochemical properties and in real-sample detection. To the best of our knowledge, this study is the first to demonstrate the successful production of a functional, non-enzymatic H2O2 sensor using the rGO-PANI-PtNP nanocomposite.
RESULTS AND DISCUSSION
Characterization of the composite materials
The rGO-PANI-PtNP/GCE H2O2 sensor was prepared by electrodepositing PtNPs on the surface of the rGO-PANI-coated GCE (Scheme 1). The morphology and structure of the PANI, rGO-PANI, and rGO-PANI-PtNP composites were characterized with transmission electron microscopy (TEM) and scanning electron microscopy (SEM). TEM revealed that PANI formed uniform fibrous structures of about 50 nm in width and hundreds of nanometers in length (Figure 1A). In comparison to PANI, the structure of rGO-PANI was substantially different (Figure 1B), with the surface of rGO sheets almost completely covered by the fibrous PANI, creating a multilayered structure. PtNPs had a diameter of approximately 30 nm and decorated the surface of rGO-PANI (Figure 1C). We then performed SEM to observe the surface of rGO-PANI in greater detail. As shown in Figure 1D, the rGO-PANI composite had a three-dimensional structure characterized by many holes that increased the active surface area, leading to a dramatic increase in the cycling life of the composite.
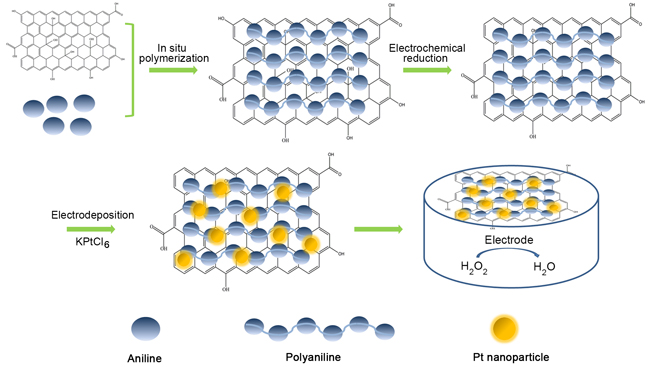
Scheme 1: The fabrication process of the rGO-PANI-PtNP/GCE.
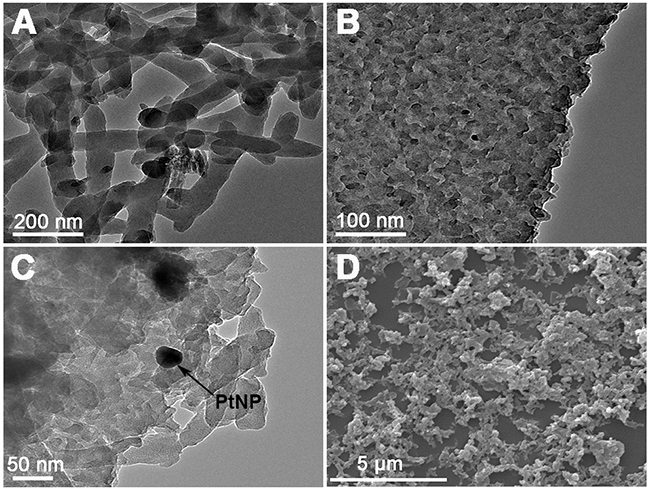
Figure 1: Characterization of the morphology and structure of the composites. (A–C) TEM and (D) SEM images of PANI (A), rGO-PANI (B and D) and rGO-PANI-PtNPs (C).
EDX spectroscopy analysis was performed to confirm the elemental composition of the rGO-PANI-PtNP composite (Figure 2A). The resulting spectrum exhibited peaks corresponding to Pt and C from PtNPs and graphene, respectively, and peaks associated with Cu and O are a result of the substrate (Figure 2A). Fourier transform infrared spectroscopy (FTIR) spectra for GO, PANI, and GO-PANI were also collected in order to characterize the interaction between PANI and GO (Figure 2B). In the GO spectrum, three characteristic peaks are visible at approximately 3429, 1730, and 1058 cm-1, corresponding to the hydroxyl, carboxyl, and epoxide groups in GO, respectively (Figure 2B). In the PANI spectrum (Figure 2B), intense peaks at 1562 and 1481 cm-1 correspond to the quinoidal and benzenoid structures of PANI. Peaks at 1297 and 1124 cm-1 were attributed to the C-N stretching vibration in the secondary structure of the aromatic amine. The peak at 796 cm-1 was due to the vibration of the C-H bond out of the plane of benzene. The FTIR spectrum of the GO-PANI composite was similar to that of PANI, confirming that the GO surface was completely covered by PANI (Figure 2B). Moreover, the peak at 1562 cm-1 in the PANI spectrum shifted to 1566 cm-1 in the GO-PANI spectrum, which was attributed to the interaction between the carboxyl group of GO and the N atom of PANI. These spectra confirmed the successful preparation of both PANI and GO-PANI.
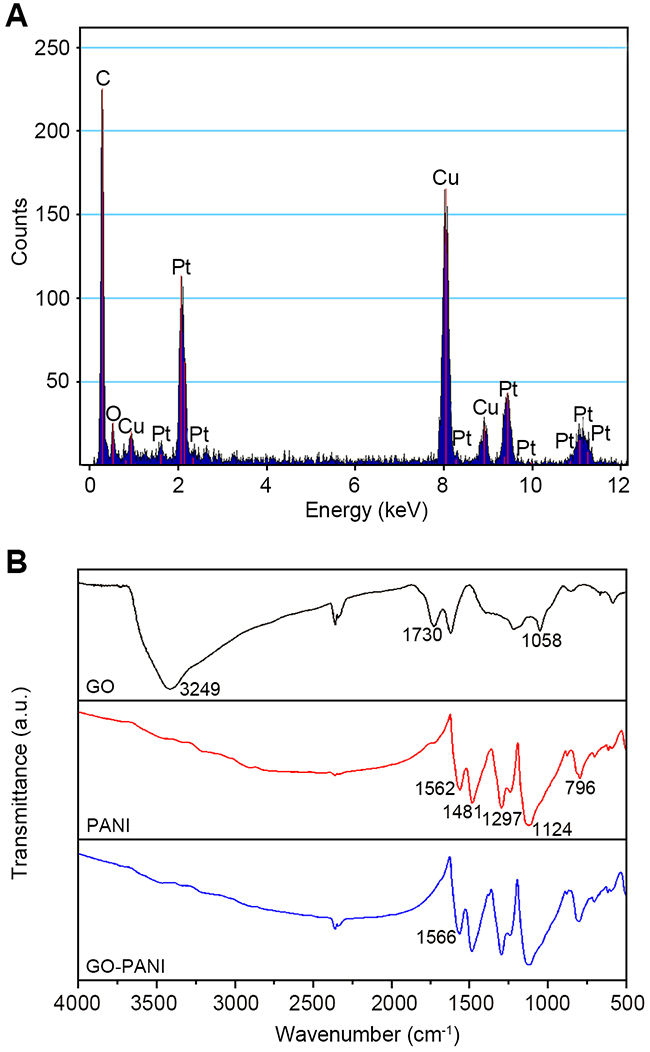
Figure 2: EDX analysis and FTIR spectra of the composites. (A) EDX analysis of the rGO-PANI-PtNP composite. (B) FTIR spectra of GO, PANI, and GO-PANI.
Electrocatalytic activities of the modified electrodes
We then performed cyclic voltammetry (CV) to investigate the electrical activities of GO-PANI/GCE, rGO-PANI/GCE, and rGO-PANI-PtNP/GCE. The CV experiments revealed the presence of two well-defined redox peaks for each electrode, which can be attributed to the quasi-reversible one-electron redox behavior of the ferricyanide ion (Figure 3). The values of the anodic peaks of GO-PANI/GCE, rGO-PANI/GCE, and rGO-PANI-PtNP/GCE were 92.1, 138.6, and 187.6 µA, respectively. Compared with GO-PANI/GCE, rGO-PANI/GCE showed an increase in peak current after electrochemical reduction due to the fact that rGO exhibits better electron transfer capability and conductivity than GO. The current associated with the rGO-PANI-PtNP/GCE exhibited another increase due to the electrochemical contributions of the PtNPs and synergistic effects with rGO-PANI.
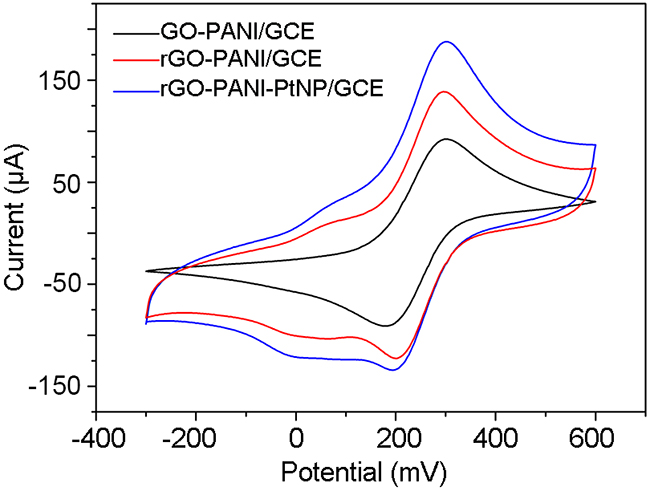
Figure 3: CV profiles of various electrodes recorded in 0.1 M KCl containing 10 mM [Fe(CN)6]3+ at a scan rate of 50 mV/s.
The microscopic electroactive areas for each composite were calculated using the Randles–Sevcik equation Ip = 2.69×10⁵AD1/2n3/2γ1/2C, where Ip corresponds to the peak current, A represents the electroactive area of the modified electrode, D represents the diffusion coefficient of the molecule in the system (6.7 × 10⁻⁶ ± 0.02 × 10⁻⁶ cm2/s), n represents the number of electrons transferred (a constant), and γ is the scan rate. The concentration of the probe molecule is denoted by C and is equal to 10 mM. The calculated microscopic electroactive areas of the rGO-PANI and rGO-PANI-PtNP composites were 1.50- and 2.04-times higher than that of GO-PANI/GCE, respectively. This phenomenon is likely due to the increased surface area and superior electrical conductivity of rGO-PANI-PtNP and indicates that the rGO-PANI-PtNP nanocomposite is suitable for electrochemical detection.
We then examined the kinetics of rGO-PANI-PtNP/GCE by investigating the effects of scan rate on CV. The electrochemical behavior of the modified electrodes was assayed in 10 mM [Fe(CN)6]3+ at scan rates ranging from 20 ~ 90 mV/s (Figure 4A). The resulting scans show that the peak current of redox increased with increasing scan rate, and the anodic and cathodic peaks shifted towards more positive and negative potentials, respectively. Based on these results, we performed a linear fit of anodic (Ipa) and cathodic (Ipc) peak currents versus the square root of the scan rate (v1/2) (Figure 4B). The resulting linear equations were calculated to be Ipa = 19.78 v (mV/s) + 0.34 (R2 = 0.99853) and Ipc = 17.16 v (mV/s) - 1.74 (R2 = 0.99903). These equations indicated that the reaction of the modified electrode was a diffusion-controlled surface reaction.
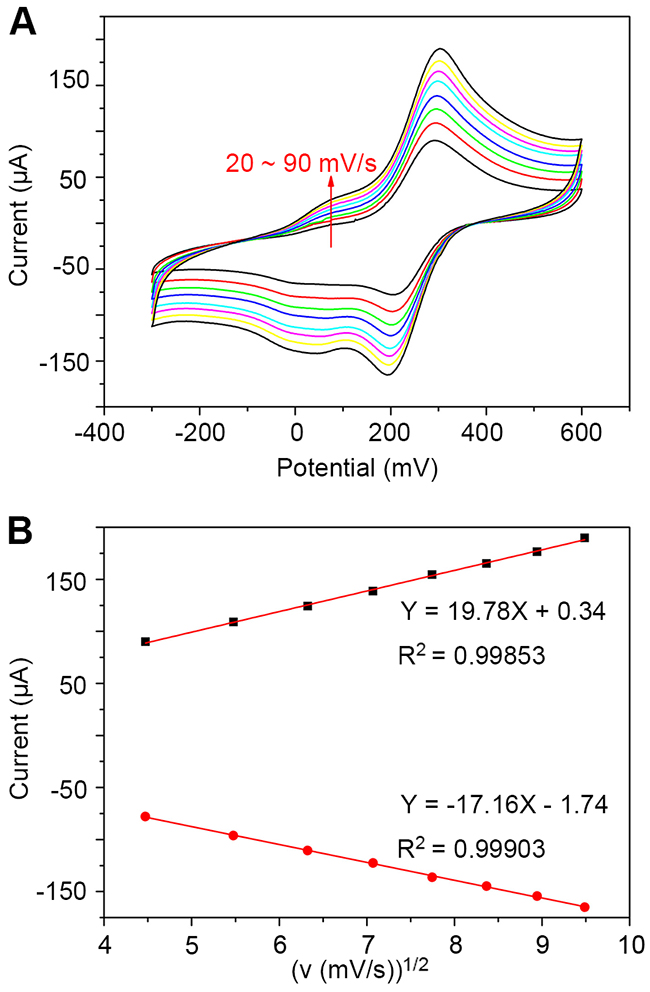
Figure 4: Kinetics of rGO-PANI-PtNP/GCE. (A) Cyclic voltammograms of the sensor in 10 mM K3[Fe(CN)6] at scan rates ranging from 20 ~ 90 mV/s. (B) Linear fits of the oxidized peak current (Ipa) and reduced peak current (Ipc) versus the square root of the scan rate (v1/2).
We next compared the CV results of rGO-PANI-PtNP/GCE in phosphate buffer (PB) and in the presence of varying concentrations of H2O2 (Figure 5). A pair of redox peaks at 30 mV and -100 mV were observed that have previously been reported to correspond to the redox transition of the leucoemeraldine form (semiconductor) to the polaronic emeraldine form (conductor) of polyaniline [20, 21]. Cathodic peaks associated with the reduction of H2O2 were enhanced with increasing concentrations of H2O2, indicating that the modified electrode exhibited excellent electrocatalytic activity towards H2O2. In the catalytic process, H2O2 reduction is initiated by dissociative adsorption of H2O2 followed by electrochemical reduction of the resultant Pt–OH [16]. The catalytic decomposition of H2O2 by PtNPs can be described by the reactions shown below:
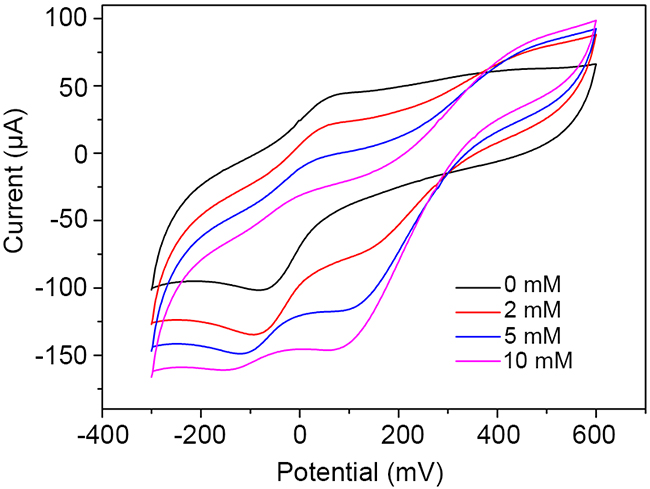
Figure 5: Electrocatalytic activity of rGO-PANI-PtNP/GCE towards H2O2. Cyclic voltammograms of the sensor in PB (pH 7.0) containing various concentrations of H2O2.
Optimization of experimental conditions for the fabrication of rGO-PANI-PtNP/GCE
Alterations in the experimental conditions used to produce modified electrodes can directly influence their electrochemical performance, leading to consequent changes in catalytic performance and sensor function. In order to optimize H2O2 detection, the effects of modifying the reduction cycle, electrodeposition time, and working potential were investigated. The effect of the reduction cycle on electrochemical performance of rGO-PANI-PtNP/GCE was analyzed by CV in 10 mM K3Fe(CN)6. The resulting spectra showed that the redox peaks associated with rGO-PANI-PtNP/GCE increased substantially after only one CV cycle (-1.5 V ~ 0 V) in N2-saturated PB (Figure 6A), demonstrating that GO-PANI has been reduced to rGO-PANI [15, 22]. The redox peak from rGO-PANI-PtNP/GCE began to stabilize after four reduction cycles, so we chose to use 10 cycles per experiment to ensure complete and stable reduction of GO-PANI.
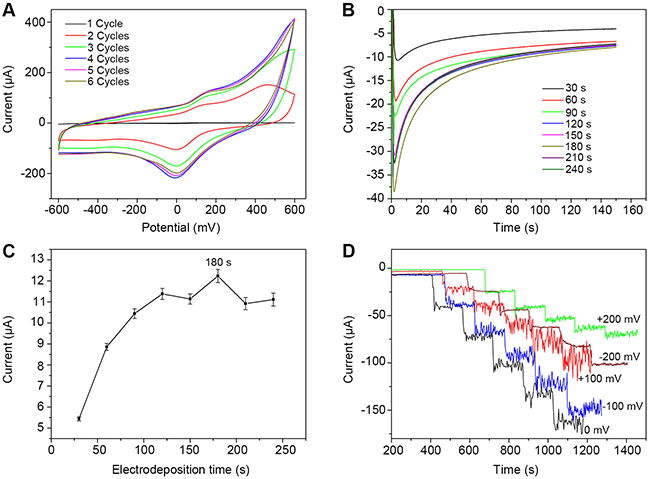
Figure 6: Optimization of experimental conditions for the fabrication of rGO-PANI-PtNP/GCE. Effects of (A) reduction cycle numbers, (B) and (C) deposition time, and (D) applied potential on the fabrication of the sensor are shown.
The PtNPs deposited on the surface of rGO-PANI/GCE play an important role in H2O2 determination by providing a large active surface area and by enhancing the electrocatalytic activity of the electrode. Thus, the amount of PtNPs loaded on the rGO-PANI/GCE surface directly affects the function of the H2O2 sensor. To optimize the amount of PtNPs present on the electrode, the effects of varying the electrodeposition time from 30 s to 240 s were investigated. Figure 6B shows the amperometric responses associated with rGO-PANI-PtNP/GCE in the presence of 5 mM H2O2 in 0.1 M PB (pH 7.0). Figure 6C demonstrates the effect of electrodeposition time on steady-state response current after 60 s of stabilization. Results from this analysis revealed that the amperometric current associated with response to H2O2 continually increased with electrodeposition times ranging from 30 s to 180 s. After 180 s, a reduction in current response was observed, which was likely associated with excessive deposition of PtNPs that blocked electron transfer and decreased the usable surface area of the modified electrode. Therefore, based on these data, we chose 180 s as the optimal electrodeposition time for fabrication of rGO-PANI-PtNP/GCE.
We also assessed the effects of varying the applied potential from -200 mV to +200 mV on the amperometric response of rGO-PANI-PtNP/GCE to five successive additions of 1 mM H2O2 in 0.1 M PB (Figure 6D). Results from this analysis reveal that the response current increased with increasing applied potential from -200 mV to 0 mV, at which point the maximum value was reached. After this point, the current response decreased, and the signal-to-noise ratio increased. Thus, 0 mV versus an Ag/AgCl reference electrode was selected as the optimum applied potential for H2O2detection. It is important to note that this applied potential for rGO-PANI-PtNP/GCE is much smaller than that of many previously reported H2O2 amperometric sensors (Table 1). Use of a low potential can minimize the response of common interference materials and can decrease the background current, leading to improved H2O2 detection.
Table 1: Comparison of selected electrochemical sensors for H2O2 detection.
Electrodes |
Applied potential (mV) |
Sensitivity (μA mM−1 cm-2) |
LOD (μM) |
Liner range (mM) |
Refs |
|---|---|---|---|---|---|
Pt/Cu/C/GCE |
+300 |
69.4 |
12.2 |
up to 4 |
[23] |
Silver nanowire |
-200 |
0.0266 |
29.2 |
0.1-3.1 |
[24] |
CQDsa/octahedral Cu2O |
-200 |
130 |
2.8 |
0.005-5.3 |
[25] |
Pt-SnO2@C |
+500 |
241 |
0.1 |
0.001-0.17 |
[26] |
Ag-Au-rGO |
-400 |
- |
1 |
0.1-5 |
[27] |
PdNPs/PEDOTb/GCE |
-400 |
215 |
2.84 |
0.0025-1 |
[28] |
Pt-polypyrrole/GCE |
-100 |
80.41 |
1.2 |
1-8 |
[29] |
graphene/PBc/GCE |
-50 |
196.6 |
1.9 |
0.02-2 |
[30] |
rGO-PANI-PtNP/GCE |
0 |
257.04 |
1.1 |
0.02-8 |
this study |
a carbon quantum dots; b poly(3,4-ethylenedioxythiophene); c prussian blue.
Amperometric responses to H2O2
We next examined the amperometric responses of rGO-PANI-PtNP/GCE to successive addition of different concentrations of H2O2 at a potential of 0 mV. As shown in Figure 7A, a typical stepwise increase in reduction current was observed in response to H2O2. Each reduction current response exhibited a well-defined increase as the concentration of H2O2 increased, reaching a steady-state value with a rapid response time (less than 4 s to achieving ≥ 95% steady-state current). The inset shows the current response at lower concentrations of H2O2 (0.02 ~ 0.15 mM).
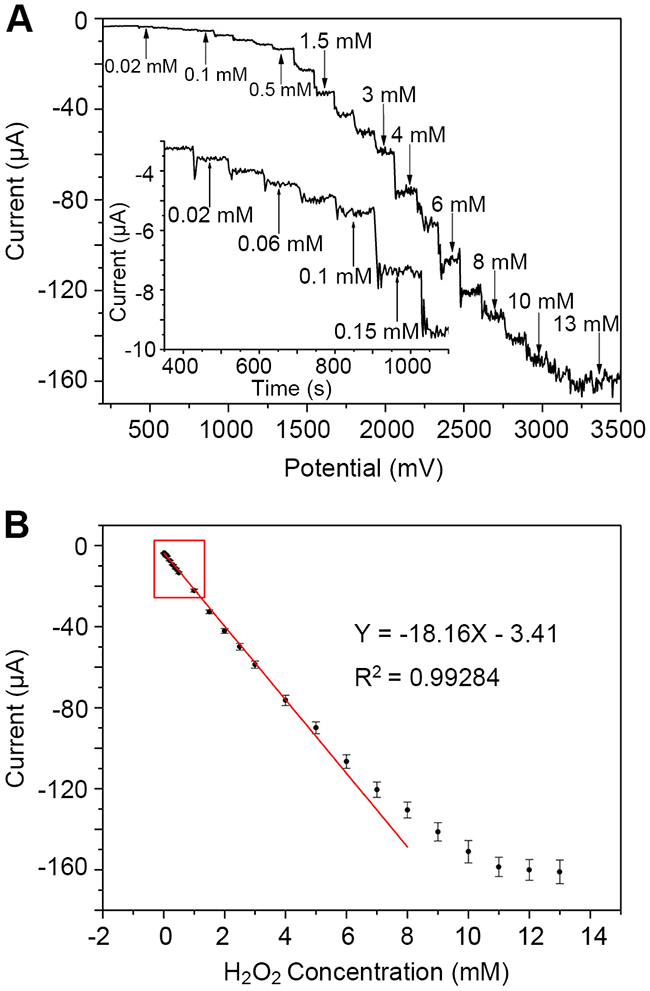
Figure 7: Electrochemical detection of H2O2 by rGO-PANI-PtNP/GCE. (A) Amperometric response of the sensor to successive additions of H2O2 in 0.1 M PB (pH 7.0) at 0 mV. Insert: Amplification of the current/time curve at lower concentrations of H2O2. (B) Calibration curve for H2O2 sensing. Error bars represent the mean ± standard deviation (n = 5).
Using data from five replicates, we fitted the calibration curve displayed in Figure 7B. Based on the curve fit, we calculated the linear range of the H2O2 sensor to be from 0.02 to 8 mM with a correlation coefficient of 0.996 and a relative standard deviation ranging from 2.1 to 3.4% (n = 5). The equation associated with the linear regression of the sensor was I (μA) = -18.16C (mM) - 3.41. The sensitivity and the limit of detection (LOD) were 257.04 μA mM-1 cm-2 (18.16 μA mM-1) and 1.1 µM (signal-to-noise ratio of 3), respectively. This H2O2 sensor exhibits superior performance with respect to linear range, sensitivity, and LOD in comparison to other reported H2O2 sensors (Table 1). Thus, the rGO-PANI-PtNP/GCE sensor is highly applicable for H2O2 detection.
Performance of rGO-PANI-PtNP/GCE in real sample analysis was investigated by analyzing H2O2 levels and evaluating the percent recovery in fetal bovine serum (FBS) added with different amount of H2O2 (Table 2). In the range of 97.5 to 103% recovery, the relative standard deviation (RSD) ranged from 2.6 to 3.2%. These results demonstrate the applicability of the H2O2 sensor for real-sample determination.
Table 2: Quantification of H2O2 in FBS containing different concentrations of H2O2
Actual H2O2 (mM) |
Measured H2O2 (mM) |
RSD (%, n = 6) |
Recovery (%) |
|---|---|---|---|
0.1 |
0.103 |
3.2 |
103 |
0.4 |
0.39 |
3.8 |
97.5 |
1 |
0.98 |
4.1 |
98 |
3 |
3.09 |
4.2 |
103 |
5 |
5.12 |
4.5 |
102.4 |
Selectivity, stability, and reproducibility of rGO-PANI-PtNP/GCE
Uric acid (UA), acetaminophen (AP), and ascorbic acid (AA) are three of the most common electroactive contaminants that cause serious interference with electrochemical detection of H2O2 in biological samples. The concentrations of UA, AP, and AA in human blood are approximately 0.33 mM, 0.13 mM, and 0.125 mM, respectively. Therefore, in order to evaluate the selectivity and interference levels for these components with respect to rGO-PANI-PtNP/GCE, we tested the amperometric responses to 0.5 mM UA, 0.15 mM AP, and 0.15 mM AA at a potential of 0 mV. We found that the current responses associated with UA, AP, and AA were negligible compared with the amplitude of the current for 1 mM H2O2 (Figure 8). These data indicate that rGO-PANI-PtNP/GCE can be used for highly selective electrochemical detection of H2O2 in biological samples. The superior selectivity and lack of interference for the modified electrode is mainly due to its low working potential value of 0 mV.
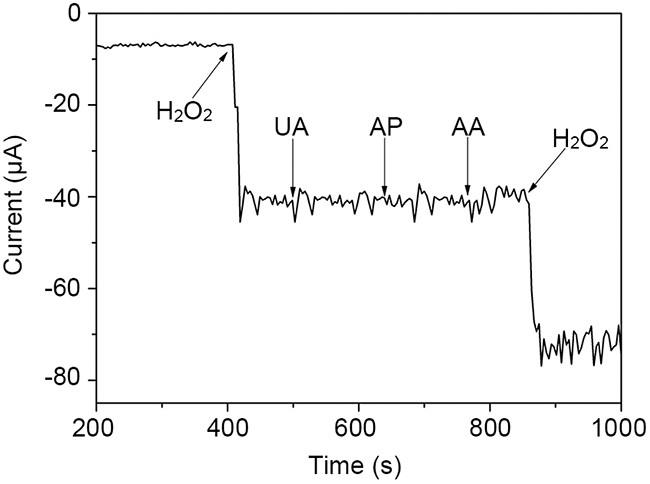
Figure 8: Amperometric responses of rGO-PANI-PtNP/GCE to 1 mM H2O2, 0.5 mM UA, 0.15 mM AP, 0.15 mM AA, and 1 mM H2O2 in PB at an applied potential of 0 mV.
Reproducibility and long-term stability of the sensor are also major parameters that can affect the applicability of H2O2 sensors. Reproducibility of the novel sensor was analyzed by measuring the responses of five independently produced electrodes to 1 mM H2O2, yielding a RSD of 3.4%. Long-term stability was evaluated by measuring the response elicited by exposure to 1 mM H2O2 every week for one month. rGO-PANI-PtNP retained 88% of its initial current response for H2O2. Thus, the rGO-PANI-PtNP electrode exhibited acceptable long-term stability.
CONCLUSION
In summary, we found that synthesis of PANI using GO as a template resulted in a composite that had satisfactory water solubility and stability. We then used electrochemical methods to prepare an rGO-PANI-PtNP nanocomposite on the surface of GCE. The resulting rGO-PANI-PtNP/GCE exhibited excellent electrochemical performance and was successfully applied as a novel, non-enzymatic H2O2 sensor. The sensor exhibited superb H2O2 detection with reproducibility and sensitivity values better than most previously described H2O2 sensors. Thus, we propose that this modified electrode can act as a sensor for the analysis of H2O2 in a wide variety of samples.
MATERIALS AND METHODS
Chemicals and reagents
GO was purchased from Xfnano Materials Tech (Nanjing, China). H2O2 was obtained from Damao Chemical Reagent (Tianjin, China). Aniline, potassium hexachloroplatinate (KPtCl6), ammonium peroxydisulfate, ascorbic acid, uric acid, and acetaminophen were purchased from Sigma-Aldrich (St. Louis, MO, USA). Phosphate buffer (PB, 0.1 M, pH 7.0) was prepared using Na2HPO4 and NaH2PO4. Doubly distilled water was used to prepare all aqueous solutions. All experiments were performed at room temperature.
Analytical methods
Electrochemical measurements were performed using a EG&G 283 Potentiostat-Galvanostat electrochemical workstationequipped with the M270 software (Ametek, Berwyn, PA, USA). An electrochemical cell connected to a standard three-electrode system was employed for all electrochemical measurements. An Ag/AgCl (saturated KCl) electrode served as the reference electrode. A 3-mm-diameter modified GCE and a platinum wire (1 mm diameter) were used as the working electrode and the counter electrode, respectively. For steady-state amperometric experiments, the potential was set to 0 mV in PBS with slight stirring. Scanning electron microscopy (SEM) and transmission electron microscopy (TEM) images were captured using a Quanta-200 field emission microscope (FEI, Hillsboro, OR, USA) and a Tecnai G2 F20 instrument equipped with energy-dispersive X-ray spectroscopy (Philips, Amsterdam, Netherlands), respectively. Fourier transform infrared spectroscopy (FTIR) spectra were collected on a Tensor-37 instrument (Bruker, Billerica, MA, USA).
Fabrication of homogenous GO-PANI composite
Homogenous GO-PANI composite was prepared according to previously reported methods with slight modifications [15]. Briefly, purified aniline was dissolved in 1 M HCl at a concentration of 0.3 M. GO (1:9 molar ratio GO to aniline) was dissolved in the resulting solution by sonicating in a bath for 1 hr. A solution of ammonium peroxydisulfate in 1 M HCl (1:4 molar ratio ammonium peroxydisulfate to aniline) was rapidly poured to the mixture with vigorous stirring at room temperature. Polymerization of aniline initiated after 5 min, and the solution turned green. The mixture was allowed to stir at room temperature overnight, and then the dark homogeneous solution was centrifuged and washed repeatedly using a mixture of doubly distilled water, hexane, and ethanol until the pH was neutralized. The solution was then dried in drying oven to obtain the GO-PANI composite. GO-PANI was then re-dissolved in PB (5 mg/mL) by sonicating in a bath for subsequent applications. PANI was prepared using the same method, except graphene oxide was not added to the solution.
Electrode modification
A bare GCE was first carefully polished with alumina powders (0.3 and 0.05 μm) to remove oxide layers on the surface of the GCE. After polishing, the GCE was ultrasonically cleaned using double distilled water and ethanol for 20 min to remove any physically adsorbed substances. The electrode was then immediately dried under nitrogen gas. The electrode was coated with GO-PANI film by placing 8 μL of GO-PANI suspension (5 mg/mL) onto the surface of the GCE, followed by drying at room temperature. GO-PANI/GCE was electrochemically reduced to rGO-PANI/GCE by scanning from -1.5 V to 0 V (10 cycles) using cyclic voltammetry (CV) in N2-saturated PB. rGO-PANI/GCE was then subjected to electrodeposition in 30 mL of 10 mM KPtCl6 solution (in 0.1 M PB) for 180 sec at -200 mV to obtain the rGO-PANI-PtNP/GCE.
CONFLICTS OF INTEREST
The authors have declared that no competing financial interest exists.
GRANT SUPPORT
This work was supported by grants from the Institute of Biomedical Sciences of Shandong Normal University and the National Natural Science Foundation of China (81273993).
REFERENCES
1. Brewer TF, Garcia FJ, Onak CS, Carroll KS, Chang CJ. Chemical approaches to discovery and study of sources and targets of hydrogen peroxide redox signaling through NADPH oxidase proteins. Annu Rev Biochem. 2015; 84: 765-790.
2. Byon CH, Heath JM, Chen Y. Redox signaling in cardiovascular pathophysiology: A focus on hydrogen peroxide and vascular smooth muscle cells. Redox Biol. 2016; 9: 244-253.
3. Cuypers E, Flinders B, Bosman IJ, Lusthof KJ, Van Asten AC, Tytgat J, Heeren RMA. Hydrogen peroxide reactions on cocaine in hair using imaging mass spectrometry. Forensic Sci Int. 2014; 242: 103-110.
4. Costas-Mora I, Romero V, Lavilla I, Bendicho C. In situ photochemical synthesis of fluorescent carbon dots for optical sensing of hydrogen peroxide and antioxidants. Talanta. 2015; 144: 1308-1315.
5. Yu DL, Wang P, Zhao YJ, Fan AP. Iodophenol blue-enhanced luminol chemiluminescence and its application to hydrogen peroxide and glucose detection. Talanta. 2016; 146: 655-661.
6. Choi HN, Han JH, Park JA, Lee JM, Lee WY. Amperometric glucose biosensor based on glucose oxidase encapsulated in carbon nanotube-titania-nafion composite film on platinized glassy carbon electrode. Electroanalysis. 2007; 19: 1757-1763.
7. Wang JD, Xian HY, Peng TJ, Sun HJ, Zheng FX. Three-dimensional graphene-wrapped PANI nanofiber composite as electrode material for supercapacitors. RSC Adv. 2015; 5: 13607-13612.
8. Ma J, Liu YF, Hu ZH, Xu ZJ. Electrochemical synthesis and performance of PANI electrode material for electrochemical capacitor. Ionics. 2013; 19: 1405-1413.
9. Al-Bahrani MR, Xu XB, Ahmad W, Ren XL, Su J, Cheng Z, Gao YH. Highly efficient dye-sensitized solar cell with GNS/MWCNT/PANI as a counter electrode. Mater Res Bull. 2014; 59: 272-277.
10. Zhang S, Li BQ, Zheng JB. An electrochemical sensor for the sensitive determination of nitrites based on Pt-PANI-graphene nanocomposites. Anal Methods. 2015; 7: 8366-8372.
11. Mohammad Naim N, Abdullah H, Umar AA, Abdul Hamid A, Shaari S. Thermal Annealing Effect on Structural, Morphological, and Sensor Performance of PANI-Ag-Fe Based Electrochemical E. coli Sensor for Environmental Monitoring. ScientificWorldJournal. 2015; 2015: 696521.
12. Matveeva ES, Gimenez CF, Tejera MJG. Charge transfer behaviour of the indium-tin oxide/polyaniline interface: dependence on pH and redox state of PANI. Synthetic Met. 2001; 123: 117-123.
13. Geethalakshmi D, Muthukumarasamy N, Balasundaraprabhu R. Effect of dopant concentration on the properties of HCl-doped PANI thin films prepared at different temperatures. Optik. 2014; 125: 1307-1310.
14. Rannou P, Pron A, Nechtschein M. UV-vis-NIR studies of new PANI/dopant/solvent associations with metallic-like behaviour. Synthetic Met. 1999; 101: 827-828.
15. Zhang K, Zhang LL, Zhao XS, Wu J. Graphene/Polyaniline Nanofiber Composites as Supercapacitor Electrodes. Chem Mater. 2010; 22: 1392-1401.
16. Mukouyama Y, Nakanishi S, Konishi H, Karasumi K, Nakato Y. Observation of two stationary states of low and high H2O2-reduction currents at a Pt electrode, arising from the occurrence of a positive feedback mechanism including solution-stirring by gas evolution. Phys Chem Chem Phys. 2001; 3: 3284-3289.
17. Shankaran DR, Uehara N, Kato T. A metal dispersed sol-gel biocomposite amperometric glucose biosensor. Biosens Bioelectron. 2003; 18: 721-728.
18. Fang YX, Zhang D, Qin X, Miao ZY, Takahashi S, Anzai J, Chen Q. A non-enzymatic hydrogen peroxide sensor based on poly(vinyl alcohol)-multiwalled carbon nanotubes-platinum nanoparticles hybrids modified glassy carbon electrode. Electrochim Acta. 2012; 70: 266-271.
19. Yin G, Xing L, Ma XJ, Wan J. Non-enzymatic hydrogen peroxide sensor based on a nanoporous gold electrode modified with platinum nanoparticles. Chem Pap. 2014; 68: 435-441.
20. Yoon SB, Yoon EH, Kim KB. Electrochemical properties of leucoemeraldine, emeraldine, and pernigraniline forms of polyaniline/multi-wall carbon nanotube nanocomposites for supercapacitor applications. J Power Sources. 2011; 196: 10791-10797.
21. Chacko AP, Hardaker SS, Gregory RV, Hanks TW. Melting transition in the leucoemeraldine form of polyaniline. Polymer. 1998; 39: 3289-3293.
22. Chen L, Tang Y, Wang K, Liu C, Luo S. Direct electrodeposition of reduced graphene oxide on glassy carbon electrode and its electrochemical application. Electrochem Commun. 2011; 13: 133-137.
23. Janyasupab M, Liu CW, Zhang Y, Wang KW, Liu CC. Bimetallic Pt-M (M = Cu, Ni, Pd, and Rh) nanoporous for H2O2 based amperometric biosensors. Sensor Actuat B-Chem. 2013; 179: 209-214.
24. Kurowska E, Brzozka A, Jarosz M, Sulka GD, Jaskula M. Silver nanowire array sensor for sensitive and rapid detection of H2O2. Electrochim Acta. 2013; 104: 439-447.
25. Li YC, Zhong YM, Zhang YY, Weng W, Li SX. Carbon quantum dots/octahedral Cu2O nanocomposites for non-enzymatic glucose and hydrogen peroxide amperometric sensor. Sensor Actuat B-Chem. 2015; 206: 735-743.
26. Lu HT, Yu S, Fan Y, Yang CP, Xu DL. Nonenzymatic hydrogen peroxide electrochemical sensor based on carbon-coated SnO2 supported Pt nanoparticles. Colloids Surf B Biointerfaces. 2013; 101: 106-110.
27. Kumar GG, Babu KJ, Nahm KS, Hwang YJ. A facile one-pot green synthesis of reduced graphene oxide and its composites for non-enzymatic hydrogen peroxide sensor applications. RSC Adv. 2014; 4: 7944-7951.
28. Jiang FX, Yue RR, Du YK, Xu JK, Yang P. A one-pot ‘green’ synthesis of Pd-decorated PEDOT nanospheres for nonenzymatic hydrogen peroxide sensing. Biosens Bioelectron. 2013; 44: 127-131.
29. Bian XJ, Lu XF, Jin E, Kong LR, Zhang WJ, Wang C. Fabrication of Pt/polypyrrole hybrid hollow microspheres and their application in electrochemical biosensing towards hydrogen peroxide. Talanta. 2010; 81: 813-818.
30. Jin E, Lu XF, Cui LL, Chao DM, Wang C. Fabrication of graphene/prussian blue composite nanosheets and their electrocatalytic reduction of H2O2. Electrochim Acta. 2010; 55: 7230-7234.