
INTRODUCTION
According to the World Health Organization, breast cancer is the most commonly diagnosed cancer in females worldwide. Epidemiology studies have shown that breast cancer incidence has increased by 3.1% per annum between 1980 and 2010 [1]. Based on incidence data from the Globocan 2008 database extrapolated to the projected world population in 2030, the World Economic Forum estimates that nearly 2.2 million new cases of breast cancer will be diagnosed worldwide in 2030 [2]. Furthermore, despite the high treatment success rate, it remains the number one cause of cancer death in women [3]. Approximately 522,000 women worldwide died of breast cancer in 2012, including 324,000 women in less developed countries where the malignancy is currently the leading cause of female cancer deaths, accounting for 14.3% of all cancer fatalities [4].
Several key transcription factors (TFs) play critical roles in the proliferation, invasion and migration of breast cancer cells [5, 6]. A recent study identified 8 TFs that are critical for basal-like breast cancer (BLBC) cell growth, and SOX11 was the only TF required for BLBC growth but not for the growth of non-BLBC cells [7]. PITX2, a paired-like Homeobox transcription factor, contributes to the invasiveness of breast cancer cells, which is an activity that appears to be mediated by the Wnt/beta-Catenin pathway [8]. In addition, another study identified Tbx3 as a novel target of tumor suppressor miR-206 and characterized the miR-206/Tbx3 signaling pathway, which is involved in the proliferation, invasion and maintenance of the cancer stem cell population in breast cancer cells [9].
A cross-tissue gene expression comparison in disease will help us to understand the global molecular landscape and reveal new candidate genes that may serve as suitable drug targets. A recent study reconstructed gene regulatory networks in coronary artery disease from seven tissues (atherosclerotic arterial wall, internal mammary artery, liver, skeletal muscle, visceral fat, subcutaneous fat and whole blood) and identified key drivers including AIP, DRAP1, POLR2I and PQBP1 [10]. Another study revealed several early warning signal genes in liver, muscle and adipose tissues in type 2 diabetes mellitus in rats based on a dynamic network method [11]. Furthermore, a recent clinical study showed that DNA methylation and the gene expression of HIF3A were associated with BMI and insulin resistance by cross-tissue validation (blood, subcutaneous adipose and skeletal muscle) [12].
Several abnormal metabolic pathways, potential biomarkers and drug target genes have already been identified in breast cancer [13–15]. However, to our knowledge, no study has conducted a cross-tissue comparison via the integration of multiple sets of breast cancer gene expression data. Therefore, in the present study, we integrated 14 breast cancer gene expression datasets containing breast, blood and saliva tissues in order to explore the differences in the transcriptional regulation relationships between TFs and TF-target genes as well as impaired pathways in breast cancer and mine the diverse gene signatures among these three tissues.
RESULTS
Differentially expressed genes overview
Table 1 shows the details of 14 integrated breast cancer datasets. We mapped 20,307 genes in the integrated breast cancer datasets. Differentially expressed genes in the three subgroups are shown in Table 2. In the breast group, we obtained 1,300 up-regulated and 1,201 down-regulated genes. Furthermore, there were 64 up-regulated and 15 down-regulated genes in the blood group. However, we found no differential expression genes in the saliva group. Commonly and tissue-specific dysregulated genes in the breast and blood group are shown in Supplementary Table S1. We obtained 16 commonly up-regulated genes and 2 commonly down-regulated genes. In addition, 2 genes were up-regulated in the breast and down-regulated in blood. However, 15 genes were down-regulated in the breast but up-regulated in blood. Among these 35 genes, the effect of NCEH1, THOC4, UBE2M, EPB42 or SNORD104 on breast cancer still has yet to be reported.
Table 1: Summary of the breast cancer datasets
Series ID |
Contributor |
Samples1 |
Title |
Tissue |
|---|---|---|---|---|
GSE8977 |
Richardson A, 2007 |
22 (22) |
Bone-marrow-derived mesenchymal stem cells promote breast cancer metastasis |
Breast |
GSE10810 |
Fárez-Vidal ME, 2008 |
58 (58) |
Gene expression signatures in breast cancer distinguish phenotype charact., histological subtypes, and tumor invasivness |
Breast |
GSE16391 |
Haibe-Kains B, 2009 |
55 (48) |
GGI: a potential predictor of relapse for endocrine-treated breast cancer patients in the BIG 1-98 trial |
Breast |
GSE20266 |
Zhang L, 2010 |
20 (20) |
Salivary Transcriptomic and Proteomic Biomarkers for Breast Cancer Detection |
Saliva |
GSE26910 |
Planche A, 2011 |
24 (12) |
Stromal molecular signatures of breast and prostate cancer |
Breast |
GSE27562 |
LaBreche HG, 2011 |
162 (162) |
Expression data from human PBMCs from breast cancer patients and controls |
Blood |
GSE29431 |
Lopez FJ, 2011 |
66 (66) |
Identifying breast cancer biomarkers |
Breast |
GSE31192 |
Harvell DM, 2011 |
33 (33) |
Molecular Signature of Pregnancy Associated Breast Cancer (PABC) |
Breast |
GSE35925 |
Katayama MH, 2012 |
30 (29) |
Calcitriol supplementation effects on Ki67 expression and transcriptional profile of breast cancer specimens from post-menopausal patients |
Breast |
GSE36765 |
Willard-Gallo K, 2012 |
34 (14) |
Gene expression profiling of CD4+ T cells infiltrating human breast cancer (Discovery Set) |
Blood |
GSE42568 |
Clarke C, 2012 |
121 (121) |
Breast Cancer Gene Expression Analysis |
Breast |
GSE45827 |
Gruosso T, 2013 |
155 (141) |
Expression data from Breast cancer subtypes |
Breast |
GSE50567 |
Lisowska KM, 2013 |
41 (41) |
BRCA1-related gene signature in breast cancer: the role of ER status and molecular type |
Breast |
GSE61304 |
Yenamandra SP, 2014 |
62 (62) |
Novel bio-marker discovery for stratification and prognosis of breast cancer patients |
Breast |
1 All samples of this dataset (samples used in this study).
Table 2: Differentially expressed genes in breast cancer
Group |
Cases/Controls |
Mapped Genes |
Up-regulated |
Down-regulated |
|---|---|---|---|---|
Breast |
470/163 |
20307 |
1300 |
1201 |
Blood |
141/35 |
20307 |
64 |
15 |
Saliva |
10/10 |
20307 |
0 |
0 |
Tissue-specific dysregulated pathways in breast cancer
Gene set enrichment analysis (GSEA) results showed that there were 22 up-regulated and 25 down-regulated pathways in the breast group, and 77 up-regulated and 3 down-regulated pathways in the blood group. Only 1 up-regulated pathway was enriched in the saliva group. The Venn diagram of these enriched pathways is shown in Figure 1. There were 17 commonly up-regulated pathways and 3 commonly down-regulated pathways between breast and blood. Table 3 shows the top 10 significantly enriched pathways in the three groups. The cell cycle, DNA replication, spliceosome, proteasomes, mismatch repair, p53 signaling pathway, nucleotide excision repair and other 10 pathways were up-regulated in the breast and blood groups. Additionally, the down-regulated pathways in the blood group were all enriched in the breast group (olfactory transduction, renin angiotensin system and neuroactive ligand receptor interaction). However, three pathways (fatty acid metabolism, adipocytokine signaling pathway and valine, leucine and isoleucine degradation) were down-regulated in the breast group but up-regulated in the blood group.
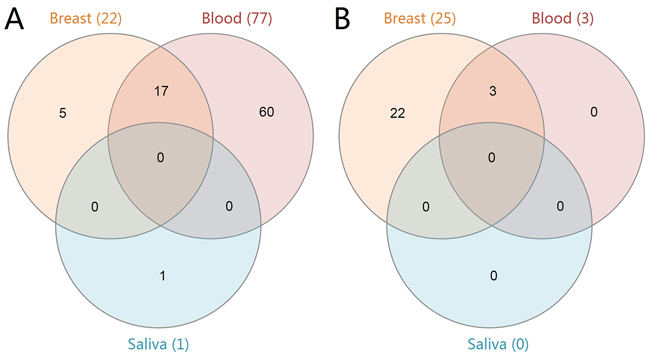
Figure 1: Venn diagram of the enriched KEGG pathways in breast cancer. The three groups (breast, blood and saliva) are represented by the orange, red and blue colors, respectively. Panel A. shows the up-regulated pathways in each group. Panel B. shows the down-regulated pathways in each group.
Table 3: Top 10 dysregulated pathways identified in breast cancer
Group |
Up-regulated Pathways |
FDR |
Down-regulated Pathways |
FDR |
|---|---|---|---|---|
Breast |
Cell cycle |
<0.001 |
Fatty acid metabolism |
<0.001 |
DMA replication |
<0.001 |
PPAR signaling pathway |
<0.001 |
|
Systemic lupus erythematosus |
<0.001 |
Propanoate metabolism |
<0.001 |
|
Spliceosome |
<0.001 |
Drug metabolism cytochrome p450 |
<0.001 |
|
Mismatch repair |
<0.001 |
Adipocytokine signaling pathway |
<0.001 |
|
Proteasome |
0.001 |
Retinol metabolism |
0.001 |
|
Homologous recombination |
0.001 |
Metabolism of xenobiotics by cytochrome p450 |
0.001 |
|
Allograft rejection |
0.001 |
Pyruvate metabolism |
0.003 |
|
Pyrimidine metabolism |
0.002 |
Butanoate metabolism |
0.003 |
|
RNA degradation |
0.003 |
Olfactory transduction |
0.014 |
|
Blood |
Toll-like receptor signaling pathway |
<0.001 |
Olfactory transduction |
0.001 |
Leishmania infection |
<0.001 |
Neuroactive ligand receptor interaction |
0.008 |
|
Ubiquitin mediated proteolysis |
<0.001 |
Renin angiotensin system |
0.049 |
|
Cell cycle |
<0.001 |
|||
DNA replication |
<0.001 |
|||
Acute myeloid leukemia |
<0.001 |
|||
NOD-like receptor signaling pathway |
<0.001 |
|||
T cell receptor signaling pathway |
<0.001 |
|||
Neurotrophin signaling pathway |
<0.001 |
|||
Lysosome |
<0.001 |
|||
Saliva |
Ribosome |
0.018 |
Expression profiles of TFs and TF-target genes
The expression profiles of 1,469 mapped TFs in three tissues are shown in Figure 2. We obtained 145 and 13 differentially expressed TFs in breast and blood, respectively (Supplementary Table S2). No dysregulated TF was found in the saliva group. There were eight TFs (CEBPD, EGR1, EGR2, EGR3, FOS, FOSB, ID1 and NFIL3) that were down-regulated in the breast group but up-regulated in the blood group. We used TRRUST web server and mapped 11, 87, 5, 3, 55, 3, 1 and 10 target genes of these TFs to our datasets, respectively. Next, we filtered the TFs that have more than 15 target genes and showed their expression profiles. Figure 3 shows the expression profiles of EGR1 and its target genes in the three groups. There were several target genes that were activated by EGR1, such as FAP, FN1, PLAU, PLAUR, UBE2S and VEGFA, in the breast group. Furthermore, we found that PTGS2, PPARG, F3, SPRY1, SYN2, TFPI2 and TGFBR2 were suppressed by EGR1 (Figure 3A). However, these genes were activated by EGR1 or unaffected in the blood group (Figure 3B). No expression change was observed in the saliva group (Figure 3C). The expression profiles of FOS and its target genes are shown in Figure 4. Several target genes were suppressed by FOS in the breast group, such as PTGS2, CLU, FOS, CSTA, FIGF and OXTR (Figure 4A). However, these genes were unaffected or activated by FOS in the blood group (Figure 4B). In the saliva group, we found only CSTA was activated by FOS (Figure 4C).
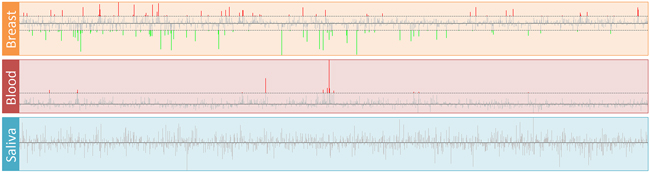
Figure 2: Expression profiles of transcription factors in breast cancer. The log2(FC) of all TFs in the breast, blood and saliva groups are displayed. The horizontal dashed lines indicate the cutoff values of log2(FC). The up- and down-regulated TFs are represented by red and green lines, respectively.
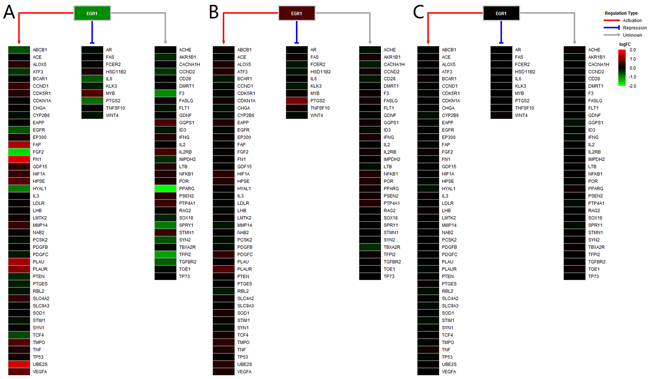
Figure 3: Heatmap of EGR1 and its target genes. The gradient color from red to green is expressed as the logFC value of each gene. The red, blue and gray lines show the regulation type of EGR1 on the targets.
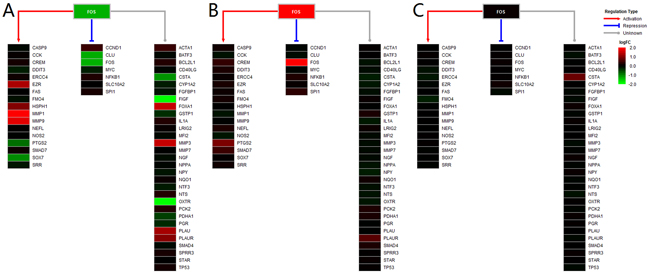
Figure 4: Heatmap of FOS and its target genes. The gradient color from red to green is expressed as the logFC value of each gene. The red, blue and gray lines show the regulation type of FOS on the targets.
Tissue-specific transcriptional regulatory network
The tissue-specific transcriptional regulatory networks (TRNs) of breast, blood and saliva are shown in Supplementary Figure S3-S5. The TRN properties of three tissues were listed in Supplementary Table S3. We found that breast TRN had the highest clustering coefficient of 0.083; this value in blood TRN is 0.038 and 0.000 in saliva TRN. Furthermore, breast TRN showed the highest connected component of 153, followed by blood TRN (116) and saliva TRN (28). In addition, breast TRN had the most multi-edge node pairs of 95, followed by blood TRN (55) and saliva TRN (9). The betweenness centrality of three TRNs were displayed in Supplementary Figure S6. In breast TRN, we found several TFs had high betweenness centralities, suggesting that this network could be divided into multiple modules (Supplementary Figure S3 and S6A). However, TFs in blood and saliva TRNs had low betweenness centralities (Supplementary Figure S6B and S6C). We listed TFs ≥ 100 degrees in these TRNs in Supplementary Table S4. There were 23 TFs in breast TRN and 8 TFs in blood TRN; no TF ≥ 100 degrees were found in saliva TRN. In breast TRN, we also found 5 TFs ≥ 200 degrees; these TFs were NR1H4, HNF4A, POU4F2, PPARG and ZNF528. In addition, 8 TFs ≥ 100 degrees in breast and blood TRNs still have no data; most of them are zinc finger proteins (ZNF528, ZNF479, DMRT2, ZNF583, TBX15, ATOH8, ZNF367 and YBX2).
Regulation type of TF-target genes in enriched pathways
Numerous studies have demonstrated that the PPAR signaling pathway and complement and coagulation cascades are correlated with breast cancer pathology [16–21]. Therefore, we showed the regulation types and expression profiles of genes in these two pathways in breast (Figure 5 and 6). We also showed these pathways in the blood and saliva groups (Supplementary Figure S7-S10). In Figure 5, the results showed that down-regulated PPARG suppresses many downstream genes in the PPAR signaling pathway. These genes were mainly involved in lipid metabolism, adipocyte differentiation, gluconeogenesis and other intracellular processes. In Figure 6, down-regulated F3 suppressed the expression of several downstream genes. Furthermore, up-regulated PALU and PALUR activated the cell adhesion, migration and proliferation functions. However, in the blood group, some genes in these two pathways showed opposite expression (Supplementary Figure S7 and S9). These two pathways were almost unaffected in the saliva group (Supplementary Figure S8 and S10).
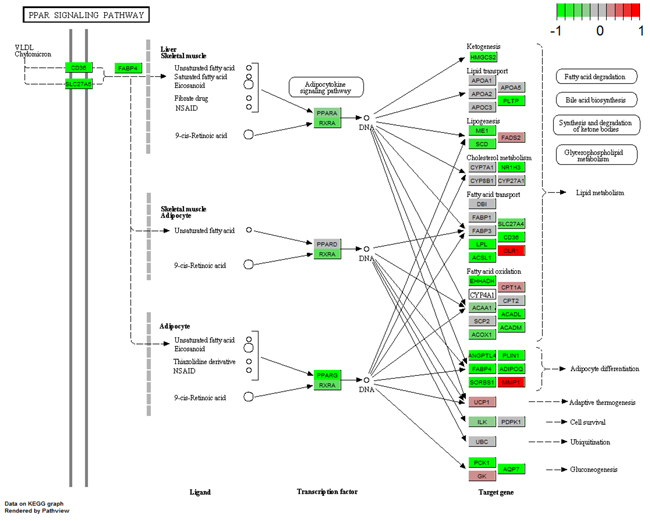
Figure 5: Gene expression profiles of the PPAR signaling pathway in breast tissue. The red and green colors represent the log2(FC) of the corresponding genes.
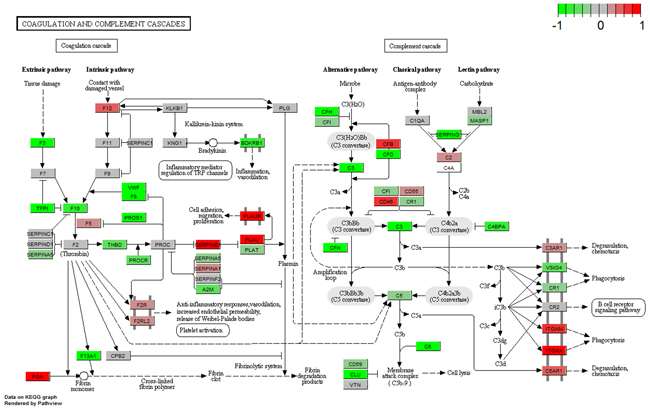
Figure 6: Gene expression profiles of the complement and coagulation cascades pathway in breast tissue. The red and green colors represent the log2(FC) of the corresponding genes.
DISCUSSION
The present study showed a huge discrepancy in the global gene expression profiles, influenced pathways, transcription factor signatures and their transcriptional regulatory networks in breast, blood and saliva tissues in breast cancer. Among these three tissues, the most seriously impaired was the breast tissue. The blood tissue showed a relatively moderate damage, whereas the saliva tissue showed an almost undetectable difference.
Previous studies have identified numerous affected pathways and biological functions in breast cancer. Clarke et al. found a severe immune response dysfunction in breast cancer by a weighted gene coexpression network method [22]. A recent study identified several affected pathways such as cell cycle, cell adhesion and DNA replication in invasive ductal carcinoma (IDC), and the impairment pathways and dysregulated genes in IDC were different between the low-genetic-grade and high-genetic-grade groups [15]. Our previous study revealed a serious stromal genome heterogeneity between breast and prostate tumors and found that several metabolism- and cellular process-related pathways were affected in breast cancer, such as the tryptophan metabolism pathway and ABC transporters pathway [23]. In this study, we found 17 common up-regulated pathways (e.g., cell cycle, DNA replication, and p53 signaling pathway) both in breast and blood tissue. However, the 3 pathways showed contrary regulation between breast and blood. Only the ribosome pathway was up-regulated in the saliva group (Table 3). Furthermore, we performed GSEA using curated canonical pathways gene sets (http://software.broadinstitute.org/gsea/msigdb) to verify the above results. Our results showed that most of the enriched KEGG pathways are included in the enriched canonical pathways in both breast and blood tissues, no enriched canonical pathway in saliva (Supplementary Figure S11). These findings suggested that it had diversity in the impairment of pathways and biological functions in breast cancer for different tissues.
We identified 8 TFs with contrasting expression in breast and blood tissues based on differentially expressed gene analysis (CEBPD, EGR1, EGR2, EGR3, FOS, FOSB, ID1 and NFIL3). We also performed GSEA using transcription factor targets (TFT) gene set in three tissues. The gene sets contain genes that share a transcription factor binding site defined in the TRANSFAC (version 7.4, http://www.gene-regulation.com/) database. The identified TFs in breast and blood tissues are shown in Supplementary Table S5. However, we found only 17 dysregulated TFs in 90 TFT enriched TFs in breast tissue, and 2 up-regulated TFs in 22 TFT enriched TFs in blood tissue. FOSB is a member of the Fos gene family. These Fos genes encode leucine zipper proteins that can dimerize with proteins of the JUN family, thereby forming the transcription factor complex AP-1. The encoded FOS proteins have been shown to be involved in cell proliferation, differentiation, and transformation [24]. Early growth response proteins are a family of zinc finger transcription factors. The following are the four members of this family: EGR1, EGR2, EGR3 and EGR4. All of these TFs have been proven to correlate with breast cancer pathogenesis and prognosis [25–28]. In addition, this study found the following tissue specific TFs that were not reported in breast cancer: ATOH8, DMRT2, TBX15 and ZNF367. Down-regulated ATOH8 has been proven to contribute to the malignant phenotype of nasopharyngeal carcinoma [29] and increases the stem cell features of hepatocellular carcinoma cells [30]. Tun et al. reported that DMRT2 and other developmental TFs were significantly down-regulated in clear cell renal cell carcinoma [31]. Recently, genome-wide DNA methylation analysis suggested that TBX15 was hyper-methylated and down-expressed in hepatocellular carcinoma datasets [32]. However, contrary to these three TFs, ZNF367 was over-expressed in adrenocortical carcinoma, malignant pheochromocytoma, paraganglioma and thyroid cancer [33]. Interestingly, the expression patterns of these four TFs in our breast datasets were the same as those in previous reports. No expression change of these TFs was found in blood or saliva tissues.
The present study showed tissue-specific expressed TFs and target genes caused different impairment of biological functions in different tissues. We displayed these transcriptional regulation relationships in the PPAR signaling pathway and the complement and coagulation cascades pathway. EGR1 is necessary and sufficient to activate human peroxisome proliferator-activated receptor-γ1 (PPARG) gene expression, which has been verified in human aortic smooth muscle cells [34]. PPARG is a key regulator of lipogenic genes, and a previous mouse study demonstrated that PPARG plays a crucial role in hepatic lipid metabolism [35]. The present study showed that low-expressed EGR1 suppressed PPARG, and then low-expressed PPARG suppressed a series of downstream genes associated with lipogenesis, cholesterol metabolism, fatty acid transport and oxidation functions, thus resulting in abnormal lipid metabolism in breast tissue (Figure 3 and 5). Coagulation factor III, also known as tissue factor (F3, also known as TF), has been reported to be regulated by EGR1, is responsible for the initiation of the coagulation protease cascades by specific limited proteolysis [36, 37]. In breast tissue, down-regulated EGR1 suppressed F3 expression, caused the low-expression of several downstream genes and activated PLAU and PLAUR, eventually disturbing cell adhesion, proliferation and metastasis functions (Figure 5 and 6). Furthermore, low-expressed FOS suppressed CLU and inhibited cell lysis function in breast tissue. However, EGR1 and FOS were all up-regulated in blood tissue, and some downstream genes showed high-expression. No expression change was observed in saliva tissue (Figure 3, Supplementary Figure S7 and S8). It is worth noting that these functions were correlated with breast cancer pathological processes, and the extent of damage in these pathways varied largely in different tissues. Our study also found a series of unreported tissue-specific TFs that may correlate with breast cancer. However, no TF-target data were provided. Therefore, future studies need to verify these correlations.
In conclusion, our study identified a series of tissue-specific TFs that correlated with breast cancer. Some of them are novel, such as ATOH8, DMRT2, TBX15 and ZNF367. These TFs may be used as biomarkers for accurate diagnosis and prognosis or as predictive markers for treatment efficiency. Furthermore, we found these dysregulated TFs and their target genes impaired lipid metabolism, the coagulation cascade, cell adhesion, proliferation, differentiation and metastasis processes. The extent of damage in these functions varied widely in breast, blood and saliva tissues. These results suggest that the tissue-specific gene expression in breast cancer would require careful consideration in future clinical practice and theoretical research.
MATERIALS AND METHODS
Microarray data collection and preprocessing
Human breast cancer microarray datasets were searched and downloaded from the NCBI-GEO database (http://www.ncbi.nlm.nih.gov/geo) in March 2016. We used the keywords of “breast cancer”, “breast adenocarcinoma” and “breast tumor” to perform accurate searching. The data selection criteria were as follows: (1) all datasets were genome-wide; (2) the samples of each data set must include breast cancer patients and controls; (3) the number of cases and controls in each dataset must be ≥ 3; (4) all samples were non-cell-line samples; and (5) complete microarray raw or normalized data were available. Based on the above criteria, we have finally chosen 14 datasets for our integrated analysis (GSE8977, GSE10810, GSE16391, GSE20266, GSE26910, GSE27562, GSE29431, GSE31192, GSE35925, GSE36765, GSE42568, GSE45827, GSE50567, and GSE61304). The integrated datasets included 621 breast cancer patients and 208 controls. Details of all datasets could be seen in Table 1. All the datasets were tested using the platform of Affymetrix Human Genome U133 Plus 2.0 Array. Among them, 11 datasets were tested using breast tissue (including 470 patients and 163 controls), 2 datasets were tested using blood (including 141 patients 35 controls) and 1 dataset was tested using saliva (including 10 patients and 10 controls). Thus, we divided these datasets into 3 subgroups based on the sample collection source including breast, blood and saliva.
R v3.2.2 was used to perform data preprocessing. We used the Robust Multichip Average (RMA) algorithm in oligo package [38] to normalize the raw expression data and generate normalized gene expression intensity. Gene annotation, integration and renormalization of the 14 datasets were carried out using a custom written Python code. We have removed probes with no gene annotation or that matched multiple gene symbols. Next, we calculated the average expression value of multiple probe IDs that matched to an official gene symbol and took this value to represent the expression intensity of the corresponding gene symbol. The renormalization method and scripts are described in our previous publications [39, 40]. The distributions of RMA processed and global renormalized gene expression values across all studies are shown in Supplementary Figure S1 and S2. After the global expression was renormalized, the distribution of gene expression values across all studies had a consistent range.
Differential expression genes analysis
Differential expression gene analysis was performed using R v3.2.2 and the Bioconductor Library. The empirical Bayes algorithm (function “eBayes”) in the limma package [41] was used to detect differentially expressed genes between breast cancer patients and controls. Significantly up-regulated genes were defined by as a logarithmic transformed fold-change (log2(FC)) ≥ log2(1.5) and a false discovery rate (FDR) adjusted P value ≤ 0.05. Significantly down-regulated genes were defined by a log2(FC) ≤ -log2(1.5) and an FDR-P value ≤ 0.05. We carried out the differential expression analysis in three tissues.
Gene set enrichment analysis
We used javaGSEA Desktop Application v2.2.2 to perform gene set enrichment analysis (GSEA) of breast cancer datasets. We chose KEGG pathway enrichment analysis to compare the impaired pathways in breast, blood and saliva tissues and tried to find the correlations between TFs and impaired pathways. The curated KEGG gene sets v5.1 (including 186 gene sets) (http://software.broadinstitute.org/gsea/msigdb/genesets.jsp?collection=CP:KEGG) were chosen to perform KEGG pathway enrichment analysis among the three groups. Additionally, the gene sets less than 15 genes or more than 500 genes were excluded. The phenotype label was set as breast cancer vs. control. The t-statistic mean of the genes was computed in each KEGG pathway using a permutation test with 1000 replications. The up-regulated pathways were defined by a normalized enrichment score (NES) > 0 and the down-regulated pathways were defined by an NES < 0. Pathways with an FDR-P value ≤ 0.05 were chosen as significantly enriched. We used Venn diagram in InteractiVenn (http://www.interactivenn.net/) [42] to show the enriched KEGG pathways among these groups.
Transcription factor analysis
We downloaded 1,544 human transcription factors (TFs) from the Animal Transcription Factor Database (AnimalTFDB, http://www.bioguo.org/AnimalTFDB/index.php) [43] and mapped 1,469 TFs to our integrated datasets. We filtered TFs that were differentially expressed in two and more groups and used the TRRUST web server (http://www.grnpedia.org/trrust/) [44] to find the target genes of the commonly dysregulated TFs. TRRUST could provide the information of the regulation type (such as activation and repression) between the queried TFs and target genes. We used heatmap in the “pheatmap” package to show the expression profiles of TFs and TF-target genes in the three groups.
Reconstruction of tissue-specific transcriptional regulatory networks (including breast, blood and saliva) were used GENIE3 software [45]. We used the gene expression matrix of the three tissues and transcriptional regulation relationship list in TRRUST as the input data and ran GENIE3 with its default parameters. The original output contained 4.12E8 TF-target interactions and we extracted the top 10,000 interactions. Next, we used Cytoscape v3.2.1 to visualize the output results. We used the NetworkAnalyzer tool in Cytoscape to perform network analysis of the three networks.
Based on previous reports, the PPAR signaling pathway and complement and coagulation cascades were critical in breast cancer pathology [16–21]. Therefore, we chose these two pathways and showed the expression profiles of the corresponding genes. We used the “pathview” package [46] to display these results. This package could provide the links between genes and pathways based on the KEGG pathway. We showed the gene expression profiles, their interactions and regulations, and related functions in the selected pathways in each group (breast, blood and saliva).
CONFLICTS OF INTEREST
None of the authors claim any conflicts of interest.
GRANT SUPPORT
This work was supported by the National Basic Research Program of China (Grant No. 2013CB835100), and the National Natural Science Foundation of China (Grant No. 81570376, No. 31401142 and NO. 31401137). We also acknowledge financial support by the Scientific Research Foundation and Academic & Technology Leaders Introduction Project, and 211 Project of Anhui University (10117700023, 02303203-32030081), the Education Revitalization Project of Anhui Province (Y05201374), the Overseas Scientific Collaborative Project of Anhui Province of China (Grant No. 1503062011), and Natural Science Foundation Project of Anhui Province (1508085MH189, 1508085QC63).
REFERENCES
1. Forouzanfar MH, Foreman KJ, Delossantos AM, Lozano R, Lopez AD, Murray CJL and Naghavi M. Breast and cervical cancer in 187 countries between 1980 and 2010: a systematic analysis. The Lancet. 2011; 378:1461-1484.
2. Bloom DE, Cafiero ET, Jané-Llopis E, Abrahams-Gessel S, Bloom LR, Fathima S, Feigl AB, Gaziano T, Mowafi M, Pandya A, Prettner K, Rosenberg L, Seligman B, Stein AZ and Weinstein C. The global economic burden of noncommunicable diseases. Geneva: World Economic Forum. 2011.
3. Torre LA, Bray F, Siegel RL, Ferlay J, Lortet-Tieulent J and Jemal A. Global cancer statistics, 2012. CA Cancer J Clin. 2015; 65:87-108.
4. Ferlay J, Soerjomataram I, Dikshit R, Eser S, Mathers C, Rebelo M, Parkin DM, Forman D and Bray F. Cancer incidence and mortality worldwide: sources, methods and major patterns in GLOBOCAN 2012. Int J Cancer. 2015; 136:E359-386.
5. Santra T and Delatola EI. A Bayesian algorithm for detecting differentially expressed proteins and its application in breast cancer research. Sci Rep. 2016; 6:30159.
6. Willis S, De P, Dey N, Long B, Young B, Sparano JA, Wang V, Davidson NE and Leyland-Jones BR. Enriched transcription factor signatures in triple negative breast cancer indicates possible targeted therapies with existing drugs. Meta Gene. 2015; 4:129-141.
7. Shepherd JH, Uray IP, Mazumdar A, Tsimelzon A, Savage M, Hilsenbeck SG and Brown PH. The SOX11 transcription factor is a critical regulator of basal-like breast cancer growth, invasion, and basal-like gene expression. Oncotarget. 2016; 7:13106-13121. doi: 10.18632/oncotarget.7437.
8. Pillai SG, Dasgupta N, Siddappa CM, Watson MA, Fleming T, Trinkaus K and Aft R. Paired-like Homeodomain Transcription factor 2 expression by breast cancer bone marrow disseminated tumor cells is associated with early recurrent disease development. Breast Cancer Res Treat. 2015; 153:507-517.
9. Amir S, Simion C, Umeh-Garcia M, Krig S, Moss T, Carraway KL, 3rd and Sweeney C. Regulation of the T-box transcription factor Tbx3 by the tumour suppressor microRNA-206 in breast cancer. Br J Cancer. 2016; 114:1125-1134.
10. Talukdar HA, Foroughi Asl H, Jain RK, Ermel R, Ruusalepp A, Franzen O, Kidd BA, Readhead B, Giannarelli C, Kovacic JC, Ivert T, Dudley JT, Civelek M, Lusis AJ, Schadt EE, Skogsberg J, et al. Cross-Tissue Regulatory Gene Networks in Coronary Artery Disease. Cell Syst. 2016; 2:196-208.
11. Li M, Zeng T, Liu R and Chen L. Detecting tissue-specific early warning signals for complex diseases based on dynamical network biomarkers: study of type 2 diabetes by cross-tissue analysis. Brief Bioinform. 2014; 15:229-243.
12. Main AM, Gillberg L, Jacobsen AL, Nilsson E, Gjesing AP, Hansen T, Pedersen O, Ribel-Madsen R and Vaag A. DNA methylation and gene expression of HIF3A: cross-tissue validation and associations with BMI and insulin resistance. Clin Epigenetics. 2016; 8:89.
13. Zhang L, Xiao H, Karlan S, Zhou H, Gross J, Elashoff D, Akin D, Yan X, Chia D, Karlan B and Wong DT. Discovery and preclinical validation of salivary transcriptomic and proteomic biomarkers for the non-invasive detection of breast cancer. PLoS One. 2010; 5:e15573.
14. LaBreche HG, Nevins JR and Huang E. Integrating factor analysis and a transgenic mouse model to reveal a peripheral blood predictor of breast tumors. BMC Med Genomics. 2011; 4:61.
15. Aswad L, Yenamandra SP, Ow GS, Grinchuk O, Ivshina AV and Kuznetsov VA. Genome and transcriptome delineation of two major oncogenic pathways governing invasive ductal breast cancer development. Oncotarget. 2015; 6:36652-36674. doi: 10.18632/oncotarget.5543.
16. Zhang F and Chen JY. Discovery of pathway biomarkers from coupled proteomics and systems biology methods. BMC Genomics. 2010; 11:S12.
17. Chandran K, Goswami S and Sharma-Walia N. Implications of a peroxisome proliferator-activated receptor alpha (PPARalpha) ligand clofibrate in breast cancer. Oncotarget. 2016; 7:15577-15599. doi: 10.18632/oncotarget.6402.
18. Pitteri SJ, Kelly-Spratt KS, Gurley KE, Kennedy J, Buson TB, Chin A, Wang H, Zhang Q, Wong CH, Chodosh LA, Nelson PS, Hanash SM and Kemp CJ. Tumor microenvironment-derived proteins dominate the plasma proteome response during breast cancer induction and progression. Cancer Res. 2011; 71:5090-5100.
19. Chen YZ, Xue JY, Chen CM, Yang BL, Xu QH, Wu F, Liu F, Ye X, Meng X, Liu GY, Shen ZZ, Shao ZM and Wu J. PPAR signaling pathway may be an important predictor of breast cancer response to neoadjuvant chemotherapy. Cancer Chemother Pharmacol. 2012; 70:637-644.
20. Song MN, Moon PG, Lee JE, Na M, Kang W, Chae YS, Park JY, Park H and Baek MC. Proteomic analysis of breast cancer tissues to identify biomarker candidates by gel-assisted digestion and label-free quantification methods using LC-MS/MS. Arch Pharm Res. 2012; 35:1839-1847.
21. Apostoli AJ, Roche JM, Schneider MM, SenGupta SK, Di Lena MA, Rubino RE, Peterson NT and Nicol CJ. Opposing roles for mammary epithelial-specific PPARgamma signaling and activation during breast tumour progression. Mol Cancer. 2015; 14:85.
22. Clarke C, Madden SF, Doolan P, Aherne ST, Joyce H, O'Driscoll L, Gallagher WM, Hennessy BT, Moriarty M, Crown J, Kennedy S and Clynes M. Correlating transcriptional networks to breast cancer survival: a large-scale coexpression analysis. Carcinogenesis. 2013; 34:2300-2308.
23. He K, Lv WW, Zheng DN, Cheng F, Zhou T, Ye SD, Ban Q, Ying QL, Huang B, Chen L, Wu GH and Liu DH. The stromal genome heterogeneity between breast and prostate tumors revealed by a comparative transcriptomic analysis. Oncotarget. 2015; 6:8687-8697. doi: 10.18632/oncotarget.3478.
24. Sarate RM, Chovatiya GL, Ravi V, Khade B, Gupta S and Waghmare SK. sPLA2 -IIA Overexpression in Mice Epidermis Depletes Hair Follicle Stem Cells and Induce Differentiation Mediated Through Enhanced JNK/c-Jun Activation. Stem Cells. 2016; 34:2407-2417.
25. Lasham A, Mehta SY, Fitzgerald SJ, Woolley AG, Hearn JI, Hurley DG, Ruza I, Algie M, Shelling AN, Braithwaite AW and Print CG. A novel EGR-1 dependent mechanism for YB-1 modulation of paclitaxel response in a triple negative breast cancer cell line. Int J Cancer. 2016; 139:1157-1170.
26. Li ZL, Liang S, Wang ZC, Li YB, Guo CX, Fang F, Gong SL and Lin CH. Expression of Smac induced by the Egr1 promoter enhances the radiosensitivity of breast cancer cells. Cancer Gene Ther. 2014; 21:142-149.
27. Lee SE, Kim SJ, Yoon HJ, Yu SY, Yang H, Jeong SI, Hwang SY, Park CS and Park YS. Genome-wide profiling in melatonin-exposed human breast cancer cell lines identifies differentially methylated genes involved in the anticancer effect of melatonin. J Pineal Res. 2013; 54:80-88.
28. Inoue A, Omoto Y, Yamaguchi Y, Kiyama R and Hayashi SI. Transcription factor EGR3 is involved in the estrogen-signaling pathway in breast cancer cells. J Mol Endocrinol. 2004; 32:649-661.
29. Wang Z, Xie J, Yan M, Wang J, Wang X, Zhang J, Zhang Y, Li P, Lei X, Huang Q, Lin S, Guo X and Liu Q. Downregulation of ATOH8 induced by EBV-encoded LMP1 contributes to the malignant phenotype of nasopharyngeal carcinoma. Oncotarget. 2016; 7:26765-26779. doi: 10.18632/oncotarget.8503.
30. Song Y, Pan G, Chen L, Ma S, Zeng T, Man Chan TH, Li L, Lian Q, Chow R, Cai X, Li Y, Li Y, Liu M, Li Y, Zhu Y, Wong N, et al. Loss of ATOH8 Increases Stem Cell Features of Hepatocellular Carcinoma Cells. Gastroenterology. 2015; 149:1068-1081 e1065.
31. Tun HW, Marlow LA, von Roemeling CA, Cooper SJ, Kreinest P, Wu K, Luxon BA, Sinha M, Anastasiadis PZ and Copland JA. Pathway signature and cellular differentiation in clear cell renal cell carcinoma. PloS One. 2010; 5:e10696.
32. Zheng Y, Huang Q, Ding Z, Liu T, Xue C, Sang X and Gu J. Genome-wide DNA methylation analysis identifies candidate epigenetic markers and drivers of hepatocellular carcinoma. Brief Bioinform. 2016.
33. Jain M, Zhang L, Boufraqech M, Liu-Chittenden Y, Bussey K, Demeure MJ, Wu X, Su L, Pacak K, Stratakis CA and Kebebew E. ZNF367 inhibits cancer progression and is targeted by miR-195. PloS One. 2014; 9:e101423.
34. Fu M, Zhang J, Lin Y, Zhu X, Ehrengruber MU and Chen YE. Early growth response factor-1 is a critical transcriptional mediator of peroxisome proliferator-activated receptor-gamma 1 gene expression in human aortic smooth muscle cells. J Biol Chem. 2002; 277:26808-26814.
35. Herzig S, Hedrick S, Morantte I, Koo SH, Galimi F and Montminy M. CREB controls hepatic lipid metabolism through nuclear hormone receptor PPAR-gamma. Nature. 2003; 426:190-193.
36. Cui MZ, Parry GCN, Oeth P, Larson H, Smith M, Huang RP, Adamson ED and Mackman N. Transcriptional regulation of the tissue factor gene in human epithelial cells is mediated by Sp1 and EGR-1. J Biol Chem. 1996; 271:2731-2739.
37. Krikun G, Schatz F, Mackman N, Guller S, Demopoulos R and Lockwood CJ. Regulation of tissue factor gene expression in human endometrium by transcription factors Sp1 and Sp3. Mol Endocrinol. 2000; 14:393-400.
38. Carvalho BS and Irizarry RA. A framework for oligonucleotide microarray preprocessing. Bioinformatics. 2010; 26:2363-2367.
39. Li WX, Dai SX, Liu JQ, Wang Q, Li GH and Huang JF. Integrated Analysis of Alzheimer’s Disease and Schizophrenia Dataset Revealed Different Expression Pattern in Learning and Memory. J Alzheimers Dis. 2016; 51:417-425.
40. Li WX, Dai SX, Wang Q, Guo YC, Hong Y, Zheng JJ, Liu JQ, Liu D, Li GH and Huang JF. Integrated analysis of ischemic stroke datasets revealed sex and age difference in anti-stroke targets. PeerJ. 2016; 4:e2470.
41. Ritchie ME, Phipson B, Wu D, Hu Y, Law CW, Shi W and Smyth GK. limma powers differential expression analyses for RNA-sequencing and microarray studies. Nucleic Acids Res. 2015; 43:e47.
42. Heberle H, Meirelles GV, da Silva FR, Telles GP and Minghim R. InteractiVenn: a web-based tool for the analysis of sets through Venn diagrams. BMC bioinformatics. 2015; 16:169.
43. Zhang HM, Chen H, Liu W, Liu H, Gong J, Wang H and Guo AY. AnimalTFDB: a comprehensive animal transcription factor database. Nucleic Acids Res. 2012; 40(Database issue):D144-149.
44. Han H, Shim H, Shin D, Shim JE, Ko Y, Shin J, Kim H, Cho A, Kim E, Lee T, Kim H, Kim K, Yang S, Bae D, Yun A, Kim S, et al. TRRUST: a reference database of human transcriptional regulatory interactions. Sci Rep. 2015; 5:11432.
45. Huynh-Thu VA, Irrthum A, Wehenkel L and Geurts P. Inferring regulatory networks from expression data using tree-based methods. PloS One. 2010; 5:e12776.
46. Luo W and Brouwer C. Pathview: an R/Bioconductor package for pathway-based data integration and visualization. Bioinformatics. 2013; 29:1830-1831.