
INTRODUCTION
The vast majority of clinical tissue samples are routinely fixed in formalin and embedded in paraffin (FFPE) blocks [1–3], and billions of FFPE samples are preserved in hospitals and tissue banks worldwide [4]. Given this wealth of archival clinical specimens from patients with precious clinical and follow-up data [5, 6], the medical research community has strong desire to exploit the FFPE samples to identify transcriptional diagnostic and prognostic biomarkers of tumors. However, FFPE preparation process and storage inevitably degrade RNA [2, 7–9], leading to RNA fragmentation ( up to 50% of which may not contain an intact poly-A tail) [7] and degradation with RIN (RNA Integrity Number) scores usually below three [10, 11]. This problem renders FFPE-isolated nucleic acids unsuitable for gene expression profiling experiments [6, 12] which usually require high-quality fresh-frozen (FF) tissues with RIN score of 6.0 or higher [13–15]. Therefore, FFPE samples are largely limited to immuno-histochemical (IHC) staining and RT-PCR experiments [5, 8, 16–20]. This makes a major limitation for transcriptional analysis when sufficient FF samples are unavailable [1, 21].
Several studies have tried to prove that gene expression profiling can be performed on FFPE samples like FF samples by showing that the gene expression profiles of the FFPE tumor samples are strongly correlated with that of the matched frozen tumor samples [11, 22–28]. However, a high correlation between two gene expression measurements does not guarantee that the two gene expression measurements are close, which will bring uncertainty to the applications of most current disease signatures based on risk scores summarized from expression measurements of the signature genes [29–34]. In this study, through comparing FFPE samples with their paired FF samples, we firstly showed that thousands of genes had at least two-fold change in FFPE samples compared with paired FF samples. Because the expression measurements of the signature genes in FFPE samples cannot be exactly transformed to the expression measurements in FF samples, the type of the risk-scores based signatures determined from FFPE (or FF) samples could not be applied to FF (or FFPE) samples.
Another type of tumor signatures is based on the relative expression orderings (REOs) of genes within samples [35–38], which is highly robust against large measurement variations introduced by experimental batch effects [39–41]. In view of the high correlation between paired FF and FFPE expression profiles [11, 22–28], we reasoned that it would be possible that most of the stable REOs of gene pairs in FF samples could be maintained in the FFPE samples with partial RNA degradation. In this study, we confirmed this reasoning through comparing the REOs in FFPE samples with the REOs in the corresponding paired FF samples obtained from the same patients. Lastly, as a case study to demonstrate the robustness of REOs-based signatures, we developed a REOs-based signature from FFPE samples to distinguishing liver cirrhosis from hepatocellular carcinoma (HCC) and validated this signature in both FF samples and FFPE samples with degraded RNA.
RESULTS
The gene expression measurements of FFPE samples affected by RNA degradation
From the The Cancer Genome Atlas (TCGA), we extracted 12, 10 and 5 paired FF and FFPE samples obtained from the same patients with lung adenocarcinoma (LUAD), colon adenocarcinoma (COAD) and breast invasive cancer (BRCA), respectively (Table 1). These paired FF and FFPE samples were used to evaluate the influence of RNA degradation on the gene expression measurements in FFPE samples.
Table 1: Description of paired FF and FFPE sample data and normal sample data used in this study
Dataset |
Platform |
Sample size |
Tissue type |
Storage type |
RIN(FF) |
RIN(FFPE) |
|---|---|---|---|---|---|---|
#TCGA_ LUAD |
IlluminaHiSeq_RNASeqV2 |
12 pairs |
LUAD |
FFPE and FF |
8.1~9.4 |
2.3~2.5 |
#TCGA_ COAD |
IlluminaHiSeq_RNASeqV2 |
10 pairs |
COAD |
FFPE and FF |
7.3~9.8 |
2.0~2.6 |
#TCGA_ BRCA |
IlluminaHiSeq_RNASeqV2 |
5 pairs |
BRCA |
FFPE and FF |
7.4~9.7 |
2.1~2.7 |
GSE54809 |
GPL6244 |
7 |
normal prostate |
FFPE |
- |
- |
GSE6956 |
GPL571 |
20 |
FF |
- |
- |
|
GSE29079 |
GPL5175 |
48 |
FF |
- |
- |
|
GSE32448 |
GPL570 |
40 |
FF |
- |
- |
|
GSE46602 |
GPL570 |
14 |
FF |
- |
- |
|
GSE11682 |
GPL4133 |
17 |
FF |
- |
- |
|
GSE28204 |
GPL6480 |
4 |
FF |
- |
- |
|
GSE35988 |
GPL6480/6848 |
28 |
FF |
- |
- |
|
GSE38241 |
GPL4133 |
21 |
FF |
- |
- |
|
GSE55597 |
GPL10558 |
16 |
FF |
- |
- |
|
GSE70768 |
GPL10558 |
73 |
FF |
- |
- |
|
E-MTAB-2523 |
IlluminaHiSeq 2000 |
4 |
normal liver |
FFPE |
- |
- |
GSE41804 |
GPL570 |
20 |
FF |
- |
- |
|
GSE55092 |
GPL570 |
80 |
FF |
- |
- |
|
GSE46408 |
GPL4133 |
6 |
FF |
- |
- |
|
GSE50579 |
GPL14550 |
7 |
FF |
- |
- |
|
GSE54236 |
GPL6480 |
80 |
FF |
- |
- |
|
GSE36376 |
GPL10558 |
193 |
FF |
- |
- |
|
GSE39791 |
GPL10558 |
72 |
FF |
- |
- |
|
GSE57957 |
GPL10558 |
37 |
FF |
- |
- |
Note:#TCGA_LUAD, #TCGA_COAD and #TCGA_BRCA denote mRNA_seq data of paired FF and FFPE samples for lung adenocarcinoma, colon adenocarcinoma and breast invasive cancer samples from TCGA, respectively.
With FDR<0.05, we detected 4133 differentially expressed genes (DEGs) between the 12 FFPE samples and their paired FF samples of LUAD using the Rank Product (RP) algorithm which is resistant to experimental batch effects [42]. Among these DEGs, 2318 genes had at least 2-fold change in the FFPE samples compared with their paired FF samples (Figure 1). Similarly in COAD, we found 4073 DEGs between the 10 FFPE samples and their paired FF samples (RP, FDR<0.05), among which 2185 genes had at least 2-fold change in the FFPE samples compared with their paired FF samples (Figure 1). Similarly in BRCA, we found 1316 DEGs between the 5 FFPE samples and their paired FF samples, among which 843 genes had at least 2-fold change in the FFPE samples compared with their paired FF samples (Figure 1). These results confirmed that gene expression measurements in FFPE samples were widely affected by RNA degradation and expression measurements of thousands of genes had at least 2-fold change in the FFPE samples compared with the FF samples. Therefore, considerable caution must be taken when we interpret gene expression data from FFPE samples.
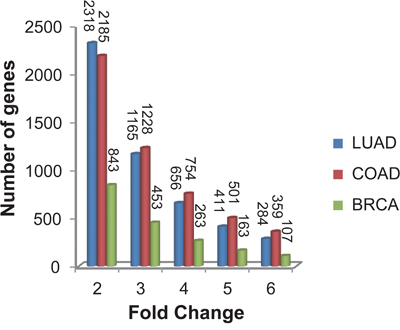
Figure 1: The fluctuation degree of gene expression measurements affected by RNA degradation in FFPE samples. Fold changes of DEGs between FFPE samples and their paired FF samples for lung adenocarcinoma (LUAD, shown in blue bar), colon adenocarcinoma (COAD, shown in red bar) and breast invasive cancer samples (BRCA, shown in green bar).
In addition, the three lists of DEGs for the three types of cancer had 1205 overlaps, among which 99.17% had consistent up- or down-deregulation directions in the FFPE samples compared with the FF samples across the three cancer types (binomial test, P-value < 1.0E-16). This result indicated that the genes affected by the RNA degradation were largely independent of the tissue types.
The robustness of the REOs against RNA degradation in FFPE samples
Using the above FF and FFPE paired samples for LUAD, COAD and BRCA, we evaluated the consistency of REOs of gene pairs between every paired FF sample and FFPE sample extracted from the same patient.
For all the 200,610,465 gene pairs of measured genes, the average consistency score of the REOs between the FF and paired FFPE samples was 87.22% for LUAD (see Materials and Methods, Figure 2A). It is known that the REOs of gene pairs with small expression differences tend to be unstable due to random measurement variations [43]. After excluding 10% and 20% of the gene pairs with the closest gene expression levels in each of the FF samples, the average consistency scores for the remained gene pairs between the FFPE and paired FF samples increased to 90.96% and 93.96% for LUAD, respectively. Similarly for COAD and BRCA samples, after excluding 10% of the gene pairs with the closest expression levels in the FF samples for each cancer, the average consistency scores for the remained gene pairs between the FFPE and FF samples were larger than 90% and the consistency scores increased as 20% of the gene pairs with the closest expression levels in the FF samples were excluded (Figure 2B and 2C). These results showed that the REOs of gene pairs in FFPE samples were highly robust against RNA degradation.
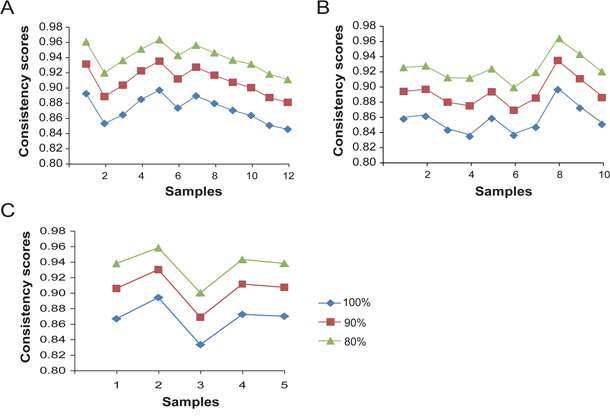
Figure 2: The consistency scores of REOs of gene pairs between every FFPE sample and its paired FF sample. The consistency scores between every paired FFPE and FF samples after excluding zero, 10% and 20% gene pairs with the smallest expression differences in each of the FF samples for lung adenocarcinoma A., colon adenocarcinoma B. and breast invasive cancer C.
It has been reported that the yield, purity, and integrity of mRNA progressively decrease with prolonged storage of the paraffin blocks [2, 44, 45]. Here, we evaluated the influence of the storage time on the REOs in the FFPE samples by analyzing seven FFPE normal prostate tissue samples stored for 11~21 years in the GSE54809 dataset. We collected 281 FF normal prostate tissue samples from different data sources (Table 1) and identified 4,008,955 gene pairs with highly stable REOs in at least 99% of these accumulated FF normal prostate tissue samples [38]. Taking them as the golden standard, we found that above 94% of these highly stable REOs were maintained in each of the FFPE normal prostate tissue samples. Similarly, we also analyzed four FFPE normal liver tissue samples stored up to 20 years in the E-MTAB-2523 dataset. Taking 31,429,023 gene pairs with highly stable REOs in at least 99% of 495 FF normal liver tissue samples (Table 1) as the golden standard, we found 92.44% of these REOs were maintained in the FFPE liver tissues stored up to 20 years (Table 2). These results indicated that most of the highly stable REOs of gene pairs in the FF samples remained stable in the FFPE samples although gene expression measurements of FFPE samples were affected by the storage time [2, 44, 45].
Table 2: The influence of the storage time on REOs of gene pairs in FFPE samples
Dataset |
Storage time(years) |
Consistency score |
|---|---|---|
GSE54809 |
11 |
0.9668 |
12 |
0.9565 |
|
14 |
0.9666 |
|
16 |
0.9464 |
|
18 |
0.9468 |
|
19 |
0.9652 |
|
21 |
0.9611 |
|
E-MTAB-2523 |
0.17 |
0.9099 |
1.08 |
0.8644 |
|
5.17 |
0.9757 |
|
20.08 |
0.9244 |
Note: The average consistency scores between REOs of FFPE normal samples and stable REOs in normal FF samples.
A REOs-based signature identified from FFPE samples to distinguish liver cirrhosis from HCC
We collected 82 FFPE samples of liver cirrhosis from the GSE10140 dataset and 80 FFPE samples of HCC from the GSE10141 dataset to train the signature. We extracted 12,567,591 gene pairs with identical REOs in more than 85% of the 82 liver cirrhosis samples, among which we found 143 gene pairs that had the reversal REOs in more than 85% of the 80 HCC samples. From these 143 gene pairs, we selected the five gene pairs (Table 3) with the top-ranked largest geometric mean of the average absolute rank difference in liver cirrhosis and the average absolute rank difference in HCC samples (see Materials and Methods). Using the five gene pairs as the signature, we classified a given sample according to the majority rule: if the REOs of more than half of the five gene pairs in the sample were consistent with the REOs in the liver cirrhosis samples, the sample was identified as the liver cirrhosis; otherwise, the HCC. In the training datasets, 93.75% of the HCC samples and 96.34% of the liver cirrhosis samples were correctly classified. Notably, through literature reviews, we found that CLDN10 [46], CDKN3 [47], CRHBP [48] and NEK2 [49] were reported to be associated with HCC, and SPINK1 [50] was associated with liver cirrhosis.
Table 3: The 5-gene-pair signature
Signature |
Gene A |
Gene B |
|---|---|---|
pair1 |
CLDN10 |
SPINK1 |
pair2 |
CLDN10 |
CDKN3 |
pair3 |
CLDN10 |
LCN2 |
pair4 |
VIPR1 |
NEK2 |
pair5 |
CRHBP |
NEK2 |
Note: Gene A has a higher expression level than Gene B in liver cirrhosis.
This REOs-based signature was validated in four datasets of FFPE samples and eight datasets of FF samples for liver cirrhosis and HCC. Taking the four datasets of FFPE samples as a whole, 92.57% of the 417 HCC samples and 92.89% of the 225 liver cirrhosis samples were correctly classified. Taking the eight datasets of FF samples as a whole, 94.00% of the 699 HCC samples and 97.11% of the 346 liver cirrhosis samples were correctly classified. As described in Table 4, except the 35 FF samples of HCC in the GSE56140 dataset, above 90% of both the HCC and liver cirrhosis samples in each of the 12 datasets were correctly classified. For the 35 FF samples of HCC in the GSE56140 dataset, seven samples were wrongly classified as liver cirrhosis, possibly due to some unknown factors such as the impurity of the HCC samples that might have no sufficient proportions of tumor cells [51, 52]. In general, this case study demonstrated that a REOs-based transcriptional signature identified from FFPE samples could be applied robustly to both FF and FFPE samples.
Table 4: The prediction sensitivity scores of the signature in the validation datasets
Sample type |
Dataset |
Platform |
Number (Sensitivity) of HCC samples |
Number (Sensitivity) of |
|---|---|---|---|---|
FFPE |
GSE10142 |
GPL5474 |
- |
225(0.9289) |
GSE10186 |
GPL5474 |
118(0.9068) |
- |
|
GSE19977 |
GPL8432 |
164(0.9390) |
- |
|
GSE20017 |
GPL8432 |
135(0.9259) |
- |
|
FF |
GSE63898 |
GPL13667 |
228(0.9342) |
168(0.9583) |
GSE25097 |
GPL10687 |
268(0.9478) |
40(1.0000) |
|
GSE56140 |
GPL18461 |
35(0.8000) |
34(0.9706) |
|
GSE36411 |
GPL10558 |
42(0.9524) |
21(0.9524) |
|
GSE6764 |
GPL570 |
35(0.9429) |
13(1.0000) |
|
GSE9843 |
GPL570 |
91(0.9780) |
- |
|
GSE17967 |
GPL571 |
- |
47(1.0000) |
|
GSE57725 |
GPL14951 |
- |
23(0.9565) |
DISCUSSION
To identify transcriptional diagnostic and prognostic biomarkers of tumors, researchers have strong desire to exploit the wealth of FFPE samples preserved in hospitals and tissue banks with precious clinical and follow-up data [5, 6, 53, 54]. However, as shown in this study, the expression measurements of thousands of genes had at least two-fold change in FFPE samples compared with paired FF samples due to the RNA degradation. Therefore, for transcriptional signatures based on risk scores summarized from the expression measurements of the signature genes, risk score thresholds predefined from FFPE (or FF) samples could not be applied to FF (or FFPE) samples directly. The intrinsic problem of incomparable gene expression measurements between FFPE and FF samples cannot be solved even if we could exactly measure low levels of gene expression in FFPE samples by RT-qPCR. In contrast, we found that the vast majority of the REOs of gene pairs in FFPE samples were not affected by RNA degradation. The robustness of REOs against partial RNA degradation makes it possible that REOs-based transcriptional signatures identified from FFPE samples could be applied robustly to both FF and FFPE samples. As demonstrated by the case study, a REOs-based signature consisting of five gene pairs extracted from FFPE samples could be applied to both FF and FFPE samples to distinguish liver cirrhosis from HCC. Thus, the precious FFPE samples could be fully exploited for the identification of REOs-based transcriptional signatures of tumors.
On the other hand, our analyses also showed that the REOs of some gene pairs, especially those gene pairs with small expression differences in FF samples, were not maintained in their paired FFPE samples, indicating that the influence of RNA degradation on some genes’ expression levels in the FFPE samples might be too large to remain their REOs in the FF samples. This result also suggested that subtle quantitative information of gene expression measurements of FFPE samples are unreliable, whereas the seemingly disadvantage of REOs analysis without using some subtle quantitative information of gene expressions is in fact a unique advantage. Especially, we could choose gene pairs with larger expression differences to develop robust REOs-based signatures, excluding gene pairs with small expression differences which tend to be unstable due to random variations of measurement [43]. This strategy would keep sufficient information for prognostic signature detection due to the widely correlated prognostic gene expressions [55]. In general, the subtle quantitative information of gene expression measurements are quite error-prone and uncertain due to various technical artifacts or ‘batch effects’ introduced by the differences in reagent lots, reaction conditions and operators [56–60]. Data normalization methods, such as Combat [61], DWD [57] and XPN [62], could distorts real biological signals [63]. In contrast, the REOs of gene pairs within samples are insensitive to experimental batch effects and data normalizations [64, 65] and thus could provide more accurate and robust patient-specific information for clinical applications [38]. In facts, prognostic signatures based on within-sample REOs have be successfully identified and validated for breast cancer [35, 37, 66, 67], lung cancer [68] and hepatocellular carcinoma [39]. Nevertheless, as shown in this study, that RNA degradation can affect some REOs of genes in FFPE samples in our analyses, it is still necessary to develop new technologies for RNA extraction protocols, RNA amplification and labeling methods to enhance the transcriptome data quality from FFPE samples [25, 28, 69–71]. Especially, because measurement of low levels of gene expression in FFPE samples by RT-qPCR is feasible, it is desirable to develop RT-qPCR kit for translating the REOs-based signatures to clinical applications.
In summary, the REOs-based method will enable gene expression analysis of FFPE samples with RNA degradation that are widely stored in pathology archives around the globe.
MATERIALS AND METHODS
Data and preprocessing
All gene expression data analysed in this study were downloaded from the GEO (http://www.ncbi.nlm.nih.gov/geo/) [72], ArrayExpress (http://www.ebi.ac.uk/arrayexpress/) [73] and TCGA (http://cancergenome.nih.gov/), as described in detail in Table 1. For the mRNA-seq profiles of level 3 in TCGA, we removed those genes with zero expression values in both FF and FFPE samples and the remained 20031, 20201 and 20029 genes were analyzed for lung adenocarcinoma, colon adenocarcinoma and breast invasive cancer samples, respectively.
For the data measured by the Affymetrix platform, the Robust Multi-array Average algorithm [74] was used to do background adjustment for the raw mRNA expression data (.CEL files). For the data measured by the Illumina platform, we directly downloaded the processed data. For the data measured by the Agilent platform, we downloaded the raw fluorescent signal intensities data of the channel (gMedianSignal or rMedianSignal) for normal samples and used the intensities to minus the corresponding background signal intensities as the probe-expression matrix. Each probeset ID was mapped to Entrez gene ID with the platform file. If a probeset was mapped to multiple or zero gene, then the data of this probeset was deleted. If multiple probesets were mapped to the same gene, the expression value for the gene was defined as the arithmetic mean of the value of multiple probesets.
Evaluation of the REOs of gene pairs in each FFPE sample compared with its paired FF sample
All the genes in a sample are ranked according to their expression levels in ascending order. Pairwise comparisons are performed for all genes in each FF sample. Then, we calculated the rank difference for each gene pair in each FF samples by the equations as following:
Ri and Rj represent the ranks of gene i and j in FF sample, respectively, and Rij is the absolute rank difference between the two genes. The gene pairs with the smallest Rij were considered to have closest expression levels.
The consistency score of these gene pairs in its paired FFPE sample was calculated as k/n, where n was the number of the gene pairs in FF samples and k was the number of gene pairs with the consistent REOs in the FFPE and FF samples.
Identification of highly stable REOs in normal tissue
For a particular tissue, pairwise comparisons were performed for all genes to identify gene pairs with stable ordering in accumulated normal samples from different data sources. For each gene pair (Gi, Gj), being viewed as an event with only two possible outcomes (Gi>Gj or Gi<Gj), the gene pairs which the expression level of Gi was higher (or lower) than that of Gj in more than 99% of accumulated normal samples were defined as highly stable gene pairs.
Developing a REOs-based signature to distinguish liver cirrhosis from HCC
Firstly, a gene pair (Gi and Gj) was selected when its REO, Gi > Gj in expression level, was identical in more than 85% of the liver cirrhosis samples, and was reversed (Gi <Gj) in more than 85% of the HCC samples. After selecting all such reversal gene pairs, we calculated the rank difference for each gene pair in each of the HCC or liver cirrhosis samples.
Let mean and mean represent the means of absolute rank differences of the gene pair (i, j) in all liver cirrhosis samples and all HCC samples, respectively. Then, we calculated the geometric mean of the mean and the mean to evaluate the reversal degree of the gene pair. The larger this geometric mean, the larger reversal degree of the REO for the two genes between the liver cirrhosis and HCC samples.
Finally, among all the reversal gene pairs, the gene pairs with the largest geometric mean of the absolute rank differences in liver cirrhosis and HCC samples were selected as the signature. For a given sample, if the REOs of more than half of the gene pairs signature in the sample were consistent with the REOs in the liver cirrhosis sample, the sample was identified as the liver cirrhosis; otherwise, the HCC.
Abbreviations
FFPE, formalin-fixed paraffin-embedded; FF, fresh-frozen; REOs, relative expression orderings; RIN, RNA Integrity Number; RP, Rank Product; FDR, False Discovery Rate; LUAD, lung adenocarcinoma; COAD, colon adenocarcinoma; BRCA, breast invasive cancer; DEGs, differentially expressed genes; HCC, hepatocellular carcinoma.
CONFLICTS OF INTEREST
No potential conflicts of interest were disclosed.
GRANT SUPPORT
This work was supported by the National Natural Science Foundation of China [grant numbers: 81372213, 81572935, 81501215, 81501829, 81602738 and 61602119].
REFERENCES
1. Abdullah-Sayani A, Bueno-de-Mesquita JM, van de Vijver MJ. Technology Insight: tuning into the genetic orchestra using microarrays—limitations of DNA microarrays in clinical practice. Nature clinical practice Oncology. 2006; 3:501-516.
2. von Ahlfen S, Missel A, Bendrat K, Schlumpberger M. Determinants of RNA quality from FFPE samples. PloS one. 2007; 2:e1261.
3. Thomas M, Poignee-Heger M, Weisser M, Wessner S, Belousov A. An optimized workflow for improved gene expression profiling for formalin-fixed, paraffin-embedded tumor samples. Journal of clinical bioinformatics. 2013; 3:10.
4. Blow N. Tissue preparation: Tissue issues. Nature. 2007; 448:959-963.
5. Tang W, David FB, Wilson MM, Barwick BG, Leyland-Jones BR, Bouzyk MM. DNA extraction from formalin-fixed, paraffin-embedded tissue. Cold Spring Harbor protocols. 2009; 2009:pdb prot5138.
6. Hall JS, Leong HS, Armenoult LS, Newton GE, Valentine HR, Irlam JJ, Moller-Levet C, Sikand KA, Pepper SD, Miller CJ, West CM. Exon-array profiling unlocks clinically and biologically relevant gene signatures from formalin-fixed paraffin-embedded tumour samples. British journal of cancer. 2011; 104:971-981.
7. Masuda N, Ohnishi T, Kawamoto S, Monden M, Okubo K. Analysis of chemical modification of RNA from formalin-fixed samples and optimization of molecular biology applications for such samples. Nucleic acids research. 1999; 27:4436-4443.
8. Farragher SM, Tanney A, Kennedy RD, Paul Harkin D. RNA expression analysis from formalin fixed paraffin embedded tissues. Histochemistry and cell biology. 2008; 130:435-445.
9. Waldron L, Ogino S, Hoshida Y, Shima K, McCart Reed AE, Simpson PT, Baba Y, Nosho K, Segata N, Vargas AC, Cummings MC, Lakhani SR, Kirkner GJ, Giovannucci E, Quackenbush J, Golub TR, et al. Expression profiling of archival tumors for long-term health studies. Clinical cancer research. 2012; 18:6136-6146.
10. Sadi AM, Wang DY, Youngson BJ, Miller N, Boerner S, Done SJ, Leong WL. Clinical relevance of DNA microarray analyses using archival formalin-fixed paraffin-embedded breast cancer specimens. BMC cancer. 2011; 11:253:251-213.
11. Norton N, Sun Z, Asmann YW, Serie DJ, Necela BM, Bhagwate A, Jen J, Eckloff BW, Kalari KR, Thompson KJ, Carr JM, Kachergus JM, Geiger XJ, Perez EA, Thompson EA. Gene expression, single nucleotide variant and fusion transcript discovery in archival material from breast tumors. PloS one. 2013; 8:e81925.
12. Scicchitano MS, Dalmas DA, Bertiaux MA, Anderson SM, Turner LR, Thomas RA, Mirable R, Boyce RW. Preliminary comparison of quantity, quality, and microarray performance of RNA extracted from formalin-fixed, paraffin-embedded, and unfixed frozen tissue samples. The journal of histochemistry and cytochemistry. 2006; 54:1229-1237.
13. Strand C, Enell J, Hedenfalk I, Ferno M. RNA quality in frozen breast cancer samples and the influence on gene expression analysis—a comparison of three evaluation methods using microcapillary electrophoresis traces. BMC molecular biology. 2007; 8:38.
14. Freidin MB, Bhudia N, Lim E, Nicholson AG, Cookson WO, Moffatt MF. Impact of collection and storage of lung tumor tissue on whole genome expression profiling. The Journal of molecular diagnostics. 2012; 14:140-148.
15. Belder N, Coskun O, Doganay Erdogan B, Ilk O, Savas B, Ensari A, Ozdag H. From RNA isolation to microarray analysis: Comparison of methods in FFPE tissues. Pathology, research and practice. 2016; 212:678-685.
16. Abrahamsen HN, Steiniche T, Nexo E, Hamilton-Dutoit SJ, Sorensen BS. Towards quantitative mRNA analysis in paraffin-embedded tissues using real-time reverse transcriptase-polymerase chain reaction: a methodological study on lymph nodes from melanoma patients. The Journal of molecular diagnostics. 2003; 5:34-41.
17. Godfrey TE, Kim SH, Chavira M, Ruff DW, Warren RS, Gray JW, Jensen RH. Quantitative mRNA expression analysis from formalin-fixed, paraffin-embedded tissues using 5' nuclease quantitative reverse transcription-polymerase chain reaction. The Journal of molecular diagnostics. 2000; 2:84-91.
18. Mullins M, Perreard L, Quackenbush JF, Gauthier N, Bayer S, Ellis M, Parker J, Perou CM, Szabo A, Bernard PS. Agreement in breast cancer classification between microarray and quantitative reverse transcription PCR from fresh-frozen and formalin-fixed, paraffin-embedded tissues. Clinical chemistry. 2007; 53:1273-1279.
19. Tramm T, Hennig G, Kyndi M, Alsner J, Sorensen FB, Myhre S, Sorlie T, Overgaard J. Reliable PCR quantitation of estrogen, progesterone and ERBB2 receptor mRNA from formalin-fixed, paraffin-embedded tissue is independent of prior macro-dissection. Virchows Archiv. 2013; 463:775-786.
20. Zeka F, Vanderheyden K, De Smet E, Cuvelier CA, Mestdagh P, Vandesompele J. Straightforward and sensitive RT-qPCR based gene expression analysis of FFPE samples. Scientific reports. 2016; 6:21418.
21. Kalmar A, Wichmann B, Galamb O, Spisak S, Toth K, Leiszter K, Nielsen BS, Bartak BK, Tulassay Z, Molnar B. Gene-expression analysis of a colorectal cancer-specific discriminatory transcript set on formalin-fixed, paraffin-embedded (FFPE) tissue samples. Diagnostic pathology. 2015; 10:126.
22. Mittempergher L, de Ronde JJ, Nieuwland M, Kerkhoven RM, Simon I, Rutgers EJ, Wessels LF, Van't Veer LJ. Gene expression profiles from formalin fixed paraffin embedded breast cancer tissue are largely comparable to fresh frozen matched tissue. PloS one. 2011; 6:e17163.
23. Reis PP, Waldron L, Goswami RS, Xu W, Xuan Y, Perez-Ordonez B, Gullane P, Irish J, Jurisica I, Kamel-Reid S. mRNA transcript quantification in archival samples using multiplexed, color-coded probes. BMC biotechnology. 2011; 11:46.
24. Graw S, Meier R, Minn K, Bloomer C, Godwin AK, Fridley B, Vlad A, Beyerlein P, Chien J. Robust gene expression and mutation analyses of RNA-sequencing of formalin-fixed diagnostic tumor samples. Scientific reports. 2015; 5:12335.
25. Hedegaard J, Thorsen K, Lund MK, Hein AM, Hamilton-Dutoit SJ, Vang S, Nordentoft I, Birkenkamp-Demtroder K, Kruhoffer M, Hager H, Knudsen B, Andersen CL, Sorensen KD, Pedersen JS, Orntoft TF, Dyrskjot L. Next-generation sequencing of RNA and DNA isolated from paired fresh-frozen and formalin-fixed paraffin-embedded samples of human cancer and normal tissue. PloS one. 2014; 9:e98187.
26. Mustafa DA, Sieuwerts AM, Smid M, de Weerd V, van der Weiden M, Meijer-van Gelder ME, Martens JW, Foekens JA, Kros JM. A Method to Correlate mRNA Expression Datasets Obtained from Fresh Frozen and Formalin-Fixed, Paraffin-Embedded Tissue Samples: A Matter of Thresholds. PloS one. 2015; 10:e0144097.
27. April C, Klotzle B, Royce T, Wickham-Garcia E, Boyaniwsky T, Izzo J, Cox D, Jones W, Rubio R, Holton K, Matulonis U, Quackenbush J, Fan JB. Whole-genome gene expression profiling of formalin-fixed, paraffin-embedded tissue samples. PloS one. 2009; 4:e8162.
28. Coudry RA, Meireles SI, Stoyanova R, Cooper HS, Carpino A, Wang X, Engstrom PF, Clapper ML. Successful application of microarray technology to microdissected formalin-fixed, paraffin-embedded tissue. The Journal of molecular diagnostics. 2007; 9:70-79.
29. Qi L, Chen L, Li Y, Qin Y, Pan R, Zhao W, Gu Y, Wang H, Wang R, Chen X, Guo Z. Critical limitations of prognostic signatures based on risk scores summarized from gene expression levels: a case study for resected stage I non-small-cell lung cancer. Briefings in bioinformatics. 2015.
30. Symmans WF, Hatzis C, Sotiriou C, Andre F, Peintinger F, Regitnig P, Daxenbichler G, Desmedt C, Domont J, Marth C, Delaloge S, Bauernhofer T, Valero V, Booser DJ, Hortobagyi GN, Pusztai L. Genomic index of sensitivity to endocrine therapy for breast cancer. Journal of clinical oncology. 2010; 28:4111-4119.
31. Tang H, Xiao G, Behrens C, Schiller J, Allen J, Chow CW, Suraokar M, Corvalan A, Mao J, White MA, Wistuba, II, Minna JD, Xie Y. A 12-gene set predicts survival benefits from adjuvant chemotherapy in non-small cell lung cancer patients. Clinical cancer research. 2013; 19:1577-1586.
32. Navaratnam S, Skliris G, Qing G, Banerji S, Badiani K, Tu D, Bradbury PA, Leighl NB, Shepherd FA, Nowatzki J, Demers A, Murphy L. Differential role of estrogen receptor beta in early versus metastatic non-small cell lung cancer. Hormones & cancer. 2012; 3:93-100.
33. Kadara H, Behrens C, Yuan P, Solis L, Liu D, Gu X, Minna JD, Lee JJ, Kim E, Hong WK, Wistuba, II, Lotan R. A five-gene and corresponding protein signature for stage-I lung adenocarcinoma prognosis. Clinical cancer research. 2011; 17:1490-1501.
34. Paik S, Shak S, Tang G, Kim C, Baker J, Cronin M, Baehner FL, Walker MG, Watson D, Park T, Hiller W, Fisher ER, Wickerham DL, Bryant J, Wolmark N. A multigene assay to predict recurrence of tamoxifen-treated, node-negative breast cancer. The New England journal of medicine. 2004; 351:2817-2826.
35. Zhang L, Hao C, Shen X, Hong G, Li H, Zhou X, Liu C, Guo Z. Rank-based predictors for response and prognosis of neoadjuvant taxane-anthracycline-based chemotherapy in breast cancer. Breast cancer research and treatment. 2013; 139:361-369.
36. Li X, Cai H, Zheng W, Tong M, Li H, Ao L, Li J, Hong G, Li M, Guan Q, Yang S, Yang D, Lin X, Guo Z. An individualized prognostic signature for gastric cancer patients treated with 5-Fluorouracil-based chemotherapy and distinct multi-omics characteristics of prognostic groups. Oncotarget. 2016; 7:8743-8755. doi: 10.18632/oncotarget.7087.
37. Zhou X, Li B, Zhang Y, Gu Y, Chen B, Shi T, Ao L, Li P, Li S, Liu C, Guo Z. A relative ordering-based predictor for tamoxifen-treated estrogen receptor-positive breast cancer patients: multi-laboratory cohort validation. Breast cancer research and treatment. 2013; 142:505-514.
38. Wang H, Sun Q, Zhao W, Qi L, Gu Y, Li P, Zhang M, Li Y, Liu SL, Guo Z. Individual-level analysis of differential expression of genes and pathways for personalized medicine. Bioinformatics. 2015; 31:62-68.
39. Ao L, Song X, Li X, Tong M, Guo Y, Li J, Li H, Cai H, Li M, Guan Q, Yan H, Guo Z. An individualized prognostic signature and multiomics distinction for early stage hepatocellular carcinoma patients with surgical resection. Oncotarget. 2016; 7:24097-24110. doi: 10.18632/oncotarget.8212.
40. Cai H, Li X, Li J, Ao L, Yan H, Tong M, Guan Q, Li M, Guo Z. Tamoxifen therapy benefit predictive signature coupled with prognostic signature of post-operative recurrent risk for early stage ER+ breast cancer. Oncotarget. 2015; 6:44593-44608. doi: 10.18632/oncotarget.6260.
41. Zhao W, Chen B, Guo X, Wang R, Chang Z, Dong Y, Song K, Wang W, Qi L, Gu Y, Wang C, Yang D, Guo Z. A rank-based transcriptional signature for predicting relapse risk of stage II colorectal cancer identified with proper data sources. Oncotarget. 2016; 7:19060-19071. doi: 10.18632/oncotarget.7956.
42. Breitling R, Armengaud P, Amtmann A, Herzyk P. Rank products: a simple, yet powerful, new method to detect differentially regulated genes in replicated microarray experiments. FEBS letters. 2004; 573:83-92.
43. Guan Q, Chen R, Yan H, Cai H, Guo Y, Li M, Li X, Tong M, Ao L, Li H, Hong G, Guo Z. Differential expression analysis for individual cancer samples based on robust within-sample relative gene expression orderings across multiple profiling platforms. Oncotarget. 2016; 7:68909-68920. doi: 10.18632/oncotarget.11996.
44. Nam SK, Im J, Kwak Y, Han N, Nam KH, Seo AN, Lee HS. Effects of fixation and storage of human tissue samples on nucleic Acid preservation. Korean journal of pathology. 2014; 48:36-42.
45. Pillai R, Deeter R, Rigl CT, Nystrom JS, Miller MH, Buturovic L, Henner WD. Validation and reproducibility of a microarray-based gene expression test for tumor identification in formalin-fixed, paraffin-embedded specimens. The Journal of molecular diagnostics. 2011; 13:48-56.
46. Huang GW, Ding X, Chen SL, Zeng L. Expression of claudin 10 protein in hepatocellular carcinoma: impact on survival. Journal of cancer research and clinical oncology. 2011; 137:1213-1218.
47. Xing C, Xie H, Zhou L, Zhou W, Zhang W, Ding S, Wei B, Yu X, Su R, Zheng S. Cyclin-dependent kinase inhibitor 3 is overexpressed in hepatocellular carcinoma and promotes tumor cell proliferation. Biochemical and biophysical research communications. 2012; 420:29-35.
48. Ho DW, Kai AK, Ng IO. TCGA whole-transcriptome sequencing data reveals significantly dysregulated genes and signaling pathways in hepatocellular carcinoma. Frontiers of medicine. 2015; 9:322-330.
49. Wubetu GY, Morine Y, Teraoku H, Yoshikawa M, Ishikawa D, Yamada S, Ikemoto T, Saito YU, Imura S, Shimada M. High NEK2 Expression Is a Predictor of Tumor Recurrence in Hepatocellular Carcinoma Patients After Hepatectomy. Anticancer research. 2016; 36:757-762.
50. Li F, Liu T, Xiao CY, Yu JX, Lu LG, Xu MY. FOXP1 and SPINK1 reflect the risk of cirrhosis progression to HCC with HBV infection. Biomedicine & pharmacotherapy. 2015; 72:103-108.
51. Abba M, Laufs S, Aghajany M, Korn B, Benner A, Allgayer H. Look who's talking: deregulated signaling in colorectal cancer. Cancer genomics & proteomics. 2012; 9:15-25.
52. Clarke J, Seo P, Clarke B. Statistical expression deconvolution from mixed tissue samples. Bioinformatics. 2010; 26:1043-1049.
53. Saleh A, Zain RB, Hussaini H, Ng F, Tanavde V, Hamid S, Chow AT, Lim GS, Abraham MT, Teo SH, Cheong SC. Transcriptional profiling of oral squamous cell carcinoma using formalin-fixed paraffin-embedded samples. Oral oncology. 2010; 46:379-386.
54. Linton K, Hey Y, Dibben S, Miller C, Freemont A, Radford J, Pepper S. Methods comparison for high-resolution transcriptional analysis of archival material on Affymetrix Plus 2.0 and Exon 1.0 microarrays. BioTechniques. 2009; 47:587-596.
55. Venet D, Dumont JE, Detours V. Most random gene expression signatures are significantly associated with breast cancer outcome. PLoS computational biology. 2011; 7:e1002240.
56. Leek JT, Scharpf RB, Bravo HC, Simcha D, Langmead B, Johnson WE, Geman D, Baggerly K, Irizarry RA. Tackling the widespread and critical impact of batch effects in high-throughput data. Nature reviews Genetics. 2010; 11:733-739.
57. Benito M, Parker J, Du Q, Wu J, Xiang D, Perou CM, Marron JS. Adjustment of systematic microarray data biases. Bioinformatics. 2004; 20:105-114.
58. Luo J, Schumacher M, Scherer A, Sanoudou D, Megherbi D, Davison T, Shi T, Tong W, Shi L, Hong H, Zhao C, Elloumi F, Shi W, Thomas R, Lin S, Tillinghast G, et al. A comparison of batch effect removal methods for enhancement of prediction performance using MAQC-II microarray gene expression data. The pharmacogenomics journal. 2010; 10:278-291.
59. Reese SE, Archer KJ, Therneau TM, Atkinson EJ, Vachon CM, de Andrade M, Kocher JP, Eckel-Passow JE. A new statistic for identifying batch effects in high-throughput genomic data that uses guided principal component analysis. Bioinformatics. 2013; 29:2877-2883.
60. Lander ES. Array of hope. Nature genetics. 1999; 21:3-4.
61. Johnson WE, Li C, Rabinovic A. Adjusting batch effects in microarray expression data using empirical Bayes methods. Biostatistics. 2007; 8:118-127.
62. Shabalin AA, Tjelmeland H, Fan C, Perou CM, Nobel AB. Merging two gene-expression studies via cross-platform normalization. Bioinformatics. 2008; 24:1154-1160.
63. Wang D, Cheng L, Wang M, Wu R, Li P, Li B, Zhang Y, Gu Y, Zhao W, Wang C, Guo Z. Extensive increase of microarray signals in cancers calls for novel normalization assumptions. Computational biology and chemistry. 2011; 35:126-130.
64. Geman D, d'Avignon C, Naiman DQ, Winslow RL. Classifying gene expression profiles from pairwise mRNA comparisons. Statistical applications in genetics and molecular biology. 2004; 3:Article19.
65. Tan AC, Naiman DQ, Xu L, Winslow RL, Geman D. Simple decision rules for classifying human cancers from gene expression profiles. Bioinformatics. 2005; 21:3896-3904.
66. Cai H, Li X, Li J, Ao L, Yan H, Tong M, Guan Q, Li M, Guo Z. Tamoxifen therapy benefit predictive signature coupled with prognostic signature of post-operative recurrent risk for early stage ER+ breast cancer. Oncotarget. 2015; 6:44593-44608. doi: 10.18632/oncotarget.6260.
67. Xu L, Tan AC, Winslow RL, Geman D. Merging microarray data from separate breast cancer studies provides a robust prognostic test. BMC bioinformatics. 2008; 9:125.
68. Qi L, Chen L, Li Y, Qin Y, Pan R, Zhao W, Gu Y, Wang H, Wang R, Chen X, Guo Z. Critical limitations of prognostic signatures based on risk scores summarized from gene expression levels: a case study for resected stage I non-small-cell lung cancer. Briefings in bioinformatics. 2016; 17:233-242.
69. Callari M, Lembo A, Bianchini G, Musella V, Cappelletti V, Gianni L, Daidone MG, Provero P. Accurate data processing improves the reliability of Affymetrix gene expression profiles from FFPE samples. PloS one. 2014; 9:e86511.
70. Williams PM, Li R, Johnson NA, Wright G, Heath JD, Gascoyne RD. A novel method of amplification of FFPET-derived RNA enables accurate disease classification with microarrays. The Journal of molecular diagnostics. 2010; 12:680-686.
71. Chen X, Deane NG, Lewis KB, Li J, Zhu J, Washington MK, Beauchamp RD. Comparison of Nanostring nCounter® Data on FFPE Colon Cancer Samples and Affymetrix Microarray Data on Matched Frozen Tissues. PloS one. 2016; 11:e0153784.
72. Barrett T, Wilhite SE, Ledoux P, Evangelista C, Kim IF, Tomashevsky M, Marshall KA, Phillippy KH, Sherman PM, Holko M, Yefanov A, Lee H, Zhang N, Robertson CL, Serova N, Davis S, et al. NCBI GEO: archive for functional genomics data sets—update. Nucleic acids research. 2013; 41:D991-995.
73. Parkinson H, Sarkans U, Shojatalab M, Abeygunawardena N, Contrino S, Coulson R, Farne A, Lara GG, Holloway E, Kapushesky M, Lilja P, Mukherjee G, Oezcimen A, Rayner T, Rocca-Serra P, Sharma A, et al. ArrayExpress—a public repository for microarray gene expression data at the EBI. Nucleic acids research. 2005; 33:D553-555.
74. Irizarry RA, Hobbs B, Collin F, Beazer-Barclay YD, Antonellis KJ, Scherf U, Speed TP. Exploration, normalization, and summaries of high density oligonucleotide array probe level data. Biostatistics. 2003; 4:249-264.