
INTRODUCTION
Colorectal cancer (CRC) is the third most common cancer and the fourth leading cause of cancer deaths worldwide. The incidence of CRC is increasing each year [1]. Although the development of novel therapeutics has increased the 5-year survival rate to 90% for patients who are diagnosed at stage I, the prognosis of patients with advanced stage CRC is poor [2]. Therefore, the identification of epidemiological factors that influence the development of CRC will enable facilitate prevention and early detection, resulting in improve patient outcomes. Twin studies have shown that the contribution of inherited factors (mainly genetic) to the etiology of CRC is approximately 35% [3], which means that genetic factors significantly impact CRC susceptibility.
Telomeres are nucleoprotein complexes at the ends of eukaryotic chromosomes. These structures consist of noncoding TTAGGG repeats and associated telomere binding proteins. Telomeres maintain chromosome integrity and genomic stability by preventing nucleolytic degradation, chromosomal end-to-end fusion, and irregular recombination [4-6]. Telomere length is determined by a balance between processes that shorten and lengthen the telomere [7]. The average telomere length ranges from 10-15 kb in human somatic cells. Telomere length is reduced by 50-200 bp with each cell division [8]. During somatic cell replication, telomere length progressively shortens due to the inability of DNA polymerase to fully replicate the 3’ end of the DNA. In general, a critically short telomere length can trigger replicative senescence and cell death [9]. This can result in genomic instability and chromosomal abnormalities, which can promote carcinogenesis [10].
The ACYP2 gene, located on chromosome 2p16.2, encodes a small cytosolic acylphosphatase enzyme that catalyzes the hydrolysis of carboxyl-phosphate bonds [11]. Genome wide association studies have demonstrated that genetic polymorphisms in ACYP2 are associated with telomere length [12], which has led to studies of the association between ACYP2 and various cancers. For example, rs11125529 in ACYP2 was found to be associated with the risk of several hormone-related cancers (e.g. breast, ovarian, and prostate) in a European population [13, 14]. However, few studies have investigated the association between genetic variants in ACYP2 and the risk of CRC. We performed a case-control study to analyze the association between 14 single nucleotide polymorphisms (SNPs) in ACYP2 and the risk of CRC in a Chinese Han population.
RESULTS
A total of 247 CRC cases (107 men and 140 women; mean age, 58.32 ± 12.75 years) and 300 controls (180 men and 120 women; mean age, 60.42 ± 5.14 years) were included in the study. The clinical characteristics of the cases and controls are shown in Table 1. There were no significant differences in the age and gender distributions between the case and control groups (p < 0.05). The minor allele frequencies (MAFs) of the analyzed SNPs in the case and control groups are shown in Table 2. All SNPs were in Hardy-Weinberg equilibrium (HWE) in the controls (p > 0.05) with the exception of rs843740, which was excluded from subsequent analyses. The MAFs of the SNPs in the control group were similar to those reported for the HapMap Asian population. Using chi-square tests, we determined that rs843711 was associated with a 1.376-fold increase in the risk of CRC (95% confidence interval [CI] = 1.082-1.749; p = 0.009). Similarly, rs843706 was associated with a significant increase in the risk of CRC (odds ratio [OR] = 1.361, 95% CI = 1.069-1.733; p = 0.012). No significant associations were detected between the other SNPs and CRC risk.
Table 1: Characteristics of the cases and controls included in the study
Variables |
Case (N = 247) |
Control (N = 300) |
Total |
p value |
|---|---|---|---|---|
Sex, No. (%) |
< 0.001a |
|||
Male |
107 (43.3) |
180 (60) |
287 (52.5) |
|
Female |
140 (56.7) |
120 (40) |
260 (47.5) |
|
Mean age ± SD |
58.32 ± 12.75 |
60.42 ± 5.14 |
0.015b |
a The p value was calculated using Pearson’s chi-square tests.
b The p value was calculated using Welch’s t tests.
SD, standard deviation.
Table 2: Allele frequencies in cases and controls and odds ratio estimates for colorectal cancer
SNP ID |
Gene (s) |
Band |
Alleles Aa/B |
MAF |
HWE p-value |
ORs |
95% CI |
p-value |
|
|---|---|---|---|---|---|---|---|---|---|
Case |
Control |
||||||||
rs6713088 |
ACYP2 |
2p16.2 |
G/C |
0.429 |
0.377 |
0.623 |
1.243 |
0.974-1.585 |
0.080 |
rs12621038 |
ACYP2 |
2p16.2 |
T/C |
0.411 |
0.450 |
0.415 |
0.852 |
0.669-1.084 |
0.193 |
rs1682111 |
ACYP2 |
2p16.2 |
A/T |
0.309 |
0.333 |
0.604 |
0.894 |
0.692-1.155 |
0.391 |
rs843752 |
ACYP2 |
2p16.2 |
G/T |
0.287 |
0.248 |
0.877 |
1.216 |
0.929-1.592 |
0.154 |
rs10439478 |
ACYP2 |
2p16.2 |
C/A |
0.409 |
0.425 |
0.237 |
0.937 |
0.736-1.193 |
0.597 |
rs843645 |
ACYP2 |
2p16.2 |
G/T |
0.285 |
0.237 |
0.749 |
1.283 |
0.978-1.683 |
0.072 |
rs11125529 |
ACYP2 |
2p16.2 |
A/C |
0.198 |
0.170 |
0.411 |
1.208 |
0.889-1.643 |
0.227 |
rs12615793 |
ACYP2 |
2p16.2 |
A/G |
0.209 |
0.185 |
0.254 |
1.161 |
0.860-1.565 |
0.329 |
rs843711 |
ACYP2 |
2p16.2 |
T/C |
0.494 |
0.415 |
0.287 |
1.376 |
1.082-1.749 |
0.009* |
rs11896604 |
ACYP2 |
2p16.2 |
G/C |
0.213 |
0.177 |
1.000 |
1.258 |
0.931-1.699 |
0.134 |
rs843706 |
ACYP2 |
2p16.2 |
A/C |
0.496 |
0.419 |
0.341 |
1.361 |
1.069-1.733 |
0.012* |
rs17045754 |
ACYP2 |
2p16.2 |
C/G |
0.192 |
0.172 |
0.547 |
1.149 |
0.844-1.564 |
0.378 |
rs843740 |
ACYP2 |
2p16.2 |
A/G |
0.453 |
0.403 |
< 0.001# |
1.227 |
0.965-1.561 |
0.095 |
rs843720 |
ACYP2 |
2p16.2 |
G/T |
0.358 |
0.358 |
0.451 |
0.999 |
0.780-1.282 |
0.999 |
MAF, minor allelic frequency; HWE, Hardy-Weinberg Equilibrium; OR, odds ratio; CI: confidence interval.
a Minor allele; # HWE p-value ≤ 0.05 was excluded; *p value ≤ 0.05.
Bonferroni correction was performed with p ≤ 0.00036 (0.05/14) considered significant.
The genotype frequencies of the ACYP2 polymorphisms are shown in Table 3. Compared to the CC genotype, the frequency of the GG genotype of rs6713088 polymorphism in the case group significantly differed from the controls (GG vs. CC: OR = 1.750, 95% CI = 1.032-2.967; p = 0.038), suggesting that rs6713088 increased the risk of CRC. Similarly, compared to individuals with the CC genotype of rs843711, individuals with the TT genotype had a significantly increased risk of CRC (TT vs. CC: OR = 2.007, 95% CI = 1.218-3.308; p = 0.006). Individuals with the AA genotype of rs843706 also had an increased risk of CRC compared to those with the CC genotype (AA vs. CC: OR = 1.971, 95% CI = 1.184-3.280; p = 0.009).
Table 3: Genotype distributions of the SNPs and their associations with the risk of colorectal cancer
SNP ID |
Alleles Aa/B |
Genotype |
No. (frequency) |
Without adjustment |
With adjustment |
|||
|---|---|---|---|---|---|---|---|---|
Case (%) |
Control (%) |
OR (95% CI) |
P |
OR (95% CI) |
Pb |
|||
rs6713088 |
G/C |
CC |
80 (32.5) |
114 (38) |
1 |
1 |
||
GG |
45 (18.3) |
40 (13.3) |
1.603(0.960-2.678) |
0.071 |
1.750 (1.032-2.967) |
0.038* |
||
GC |
121 (49.2) |
146 (48.7) |
1.181 (0.813-1.716) |
0.383 |
1.232 (0.840-1.807) |
0.286 |
||
rs12621038 |
T/C |
CC |
86 (34.9) |
94 (31.4) |
1 |
1 |
||
TT |
42 (17.1) |
64 (21.4) |
0.717 (0.441-1.167) |
0.181 |
0.686 (0.417-1.129) |
0.138 |
||
TC |
118 (48) |
141 (47.2) |
0.915 (0.625-1.339) |
0.647 |
0.859 (0.581-1.271) |
0.447 |
||
rs1682111 |
A/T |
TT |
117 (47.6) |
131 (43.7) |
1 |
1 |
||
AA |
23 (9.3) |
31 (10.3) |
0.831 (0.459-1.505) |
0.541 |
0.877 (0.478-1.608) |
0.671 |
||
AT |
106 (43.1) |
138 (46) |
0.860 (0.603-1.227) |
0.406 |
0.894 (0.621-1.286) |
0.545 |
||
rs843752 |
G/T |
TT |
124 (50.4) |
170 (56.7) |
1 |
1 |
||
GG |
19 (7.7) |
19 (6.3) |
1.371 (0.697-2.697) |
0.301 |
1.385 (0.692-2.77) |
0.358 |
||
GT |
103 (41.9) |
111 (37) |
1.272 (0.893-1.813) |
0.183 |
1.322 (0.920-1.901) |
0.132 |
||
rs10439478 |
C/A |
AA |
83 (33.6) |
104 (34.8) |
1 |
1 |
||
CC |
38 (15.4) |
59 (19.7) |
0.807 (0.490-1.330) |
0.401 |
0.712 (0.427-1.190) |
0.195 |
||
CA |
126 (51) |
136 (45.5) |
1.161 (0.797-1.692) |
0.438 |
1.118 (0.760-1.645) |
0.570 |
||
rs843645 |
G/T |
TT |
126 (51.2) |
176 (58.7) |
1 |
1 |
||
GG |
20 (8.1) |
18 (6) |
1.552 (0.789-3.053) |
0.203 |
1.622 (0.811-3.246) |
0.172 |
||
GT |
100 (40.7) |
106 (35.3) |
1.318 (0.923-1.882) |
0.129 |
1.380 (0.958-1.988) |
0.084 |
||
rs11125529 |
A/C |
CC |
160 (64.8) |
204 (68) |
1 |
1 |
||
AA |
11 (4.5) |
6 (2) |
2.338 (0.846-6.457) |
0.101 |
2.631 (0.933-7.417) |
0.067 |
||
AC |
76 (30.7) |
90 (30) |
1.077 (0.745-1.557) |
0.695 |
1.003 (0.686-1.465) |
0.988 |
||
rs12615793 |
A/G |
GG |
156 (63.1) |
196 (65.3) |
1 |
1 |
||
AA |
12 (4.9) |
7 (2.4) |
2.154 (0.828-5.600) |
0.116 |
2.384 (0.899-6.314) |
0.081 |
||
AG |
79 (32) |
97 (32.3) |
1.023 (0.711-1.472) |
0.901 |
0.953 (0.655-1.385) |
0.799 |
||
rs843711 |
T/C |
CC |
67 (27.2) |
98 (32.7) |
1 |
1 |
||
TT |
64 (26) |
47 (15.7) |
1.992 (1.222-3.245) |
0.006* |
2.007 (1.218-3.308) |
0.006* |
||
TC |
115 (46.8) |
155 (51.6) |
1.085 (0.732-1.608) |
0.684 |
1.073 (0.718-1.603) |
0.732 |
||
rs11896604 |
G/C |
CC |
156 (63.2) |
203 (67.7) |
1 |
1 |
||
GG |
14 (5.7) |
9 (3) |
2.024 (0.854-4.798) |
0.109 |
2.219 (0.915-5.384) |
0.078 |
||
GC |
77 (31.1) |
88 (29.3) |
1.139 (0.786-1.649) |
0.492 |
1.050 (0.718-1.537) |
0.800 |
||
rs843706 |
A/C |
CC |
61 (25.3) |
96 (32.2) |
1 |
1 |
||
AA |
59 (24.5) |
48 (16.1) |
1.934 (1.175-3.183) |
0.009* |
1.971 (1.184-3.280) |
0.009* |
||
AC |
121 (50.2) |
154 (51.7) |
1.237 (0.829-1.844) |
0.298 |
1.256 (0.835-1.888) |
0.274 |
||
rs17045754 |
C/G |
GG |
164 (66.4) |
204 (68) |
1 |
1 |
||
CC |
12 (4.8) |
7 (2.3) |
2.132 (0.821-5.539) |
0.120 |
2.295 (0.867-6.077) |
0.095 |
||
CG |
71 (28.8) |
89 (29.7) |
0.992 (0.683-1.442) |
0.968 |
0.914 (0.622-1.342) |
0.646 |
||
rs843720 |
G/T |
TT |
100 (40.5) |
120 (40) |
1 |
1 |
||
GG |
30 (12.1) |
35 (11.7) |
1.029 (0.590-1.792) |
0.921 |
1.009 (0.573-1.780) |
0.974 |
||
GT |
117 (47.4) |
145 (48.3) |
0.968 (0.675-1.388) |
0.861 |
1.021 (0.706-1.476) |
0.914 |
||
a Minor alleles, OR: Odds ratio, CI: Confidence interval;
b: p values were calculated using unconditional logistic regression after adjusting for sex and age;
*: p ≤ 0.05.
Bonferroni correction was performed with p ≤ 0.00036 (0.05/14) considered significant.
We assumed that the minor allele of each SNP was a risk factor compared to the wild-type allele. Three genetic models (dominant, recessive, and additive) were applied to analyze the associations between the SNPs and CRC risk using an unconditional logistic regression analysis with adjustments for age and gender (Table 4). We found that the minor allele (G) of rs6713088 and rs843645 was associated with an increased risk of CRC under the additive model (rs6713088: OR = 1.304, 95% CI = 1.012-1.681; p = 0.04. rs843645: OR = 1.322, 95% CI = 1.001-1.746; p = 0.049). The minor allele (T) of rs843711 was associated with an increased risk of CRC under the additive model (OR = 1.38, 95% CI = 1.077-1.768; p = 0.011) and recessive model (OR = 1.921, 95% CI = 1.247-2.960; p = 0.003). Additionally, the minor allele (A) of rs843706 was associated with a significantly increased risk of CRC under the additive model (OR = 1.39, 95% CI = 1.079-1.791; p = 0.011) and recessive model (OR = 1.703, 95% CI = 1.101-2.633; p = 0.017). However, only rs843711 remained significant after Bonferroni correction for multiple comparisons (p ≤ 0.00036).
Table 4: Logistic regression analysis of the association between the SNPs and colorectal cancer (adjusted for sex and age)
SNP ID |
Minor allele |
Additive model |
Dominant model |
Recessive model |
||||||
|---|---|---|---|---|---|---|---|---|---|---|
OR |
95% CI |
p-value |
OR |
95% CI |
p-value |
OR |
95% CI |
p-value |
||
rs6713088 |
G |
1.304 |
1.012-1.681 |
0.040* |
1.340 |
0.932-1.928 |
0.115 |
1.549 |
0.962-2.496 |
0.072 |
rs12621038 |
T |
0.832 |
0.652-1.062 |
0.140 |
0.805 |
0.558-1.162 |
0.246 |
0.750 |
0.482-1.167 |
0.202 |
rs1682111 |
A |
0.920 |
0.706-1.199 |
0.538 |
0.891 |
0.630-1.260 |
0.513 |
0.927 |
0.520-1.654 |
0.798 |
rs843752 |
G |
1.243 |
0.942-1.640 |
0.124 |
1.331 |
0.941-1.884 |
0.106 |
1.230 |
0.626-2.417 |
0.548 |
rs10439478 |
C |
0.885 |
0.692-1.133 |
0.333 |
0.992 |
0.690-1.428 |
0.967 |
0.667 |
0.421-1.057 |
0.085 |
rs843645 |
G |
1.322 |
1.001-1.746 |
0.049* |
1.415 |
0.999-2.004 |
0.051 |
1.421 |
0.723-2.795 |
0.308 |
rs11125529 |
A |
1.183 |
0.862-1.624 |
0.299 |
1.097 |
0.761-1.581 |
0.618 |
2.628 |
0.938-7.364 |
0.066 |
rs12615793 |
A |
1.136 |
0.833-1.549 |
0.420 |
1.043 |
0.727-1.496 |
0.819 |
2.422 |
0.921-6.365 |
0.073 |
rs843711 |
T |
1.380 |
1.077-1.768 |
0.011* |
1.288 |
0.882-1.879 |
0.190 |
1.921 |
1.247-2.960 |
0.003* |
rs11896604 |
G |
1.216 |
0.898-1.649 |
0.207 |
1.151 |
0.801-1.655 |
0.447 |
2.187 |
0.908-5.265 |
0.081 |
rs843706 |
A |
1.390 |
1.079-1.791 |
0.011* |
1.425 |
0.968-2.097 |
0.073 |
1.703 |
1.101-2.633 |
0.017* |
rs17045754 |
C |
1.108 |
0.809-1.516 |
0.524 |
1.009 |
0.699-1.458 |
0.960 |
2.356 |
0.896-6.197 |
0.082 |
rs843720 |
G |
1.010 |
0.779-1.308 |
0.943 |
1.018 |
0.717-1.447 |
0.919 |
0.998 |
0.587-1.698 |
0.995 |
OR, odds ratio; CI: confidence interval.
*p ≤ 0.05.
Bonferroni correction was performed with p ≤ 0.00036 (0.05/14) considered significant.
We further characterized the SNPs in ACYP2 SNPs using linkage disequilibrium (LD) and haplotype analyses. Pairwise LD was calculated between all 13 SNPs and the haplotype structure of the ACYP2 gene was analyzed (D’ and r2). Haplotype blocks were divided using the D’ confidence interval method. Adjacent SNPs with D’ values and 95% CIs between 0.70-0.98 were classified as the same haplotype block. Two LD blocks were detected in the control group (Figure 1). Block 1 consisted of 8 closely linked SNPs (rs1682111, rs843752, rs10439478, rs843645, rs11125529, rs12615793, rs843711, and rs11896604) and block 2 consisted of two linked SNPs (rs843706 and rs17045754).
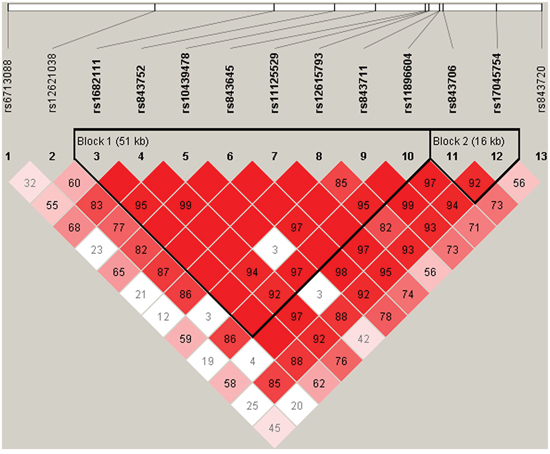
Figure 1: D’ linkage map for the 13 SNPs in ACYP2. A standard color scheme was used to display linkage disequilibrium (LD), with bright red corresponding to strong LD (LOD = 2, D’ = 1), white corresponding to no LD (LOD < 2, D’ < 1), and pink/red (LOD = 2, D’ < 1) and blue (LOD < 2, D’ = 1) corresponding to intermediate LD.
Finally, a haplotype-based association study was performed to evaluate the relationship between ACYP2 haplotypes and risk of CRC (Table 5). The “TTCTCGCC” haplotype was associated with a decreased risk of CRC (OR = 0.719; 95% CI, 0.529-0.978, p = 0.035). This haplotype consisted of rs1682111, rs843752, rs10439478, rs843645, rs11125529, rs12615793, rs843711, and rs11896604. Additionally, the “AG” haplotype of rs843706 and rs17045754 was associated with an increased risk of CRC (OR = 1.377; 95% CI, 1.044-1.815, p = 0.023). In contrast, the “CG” haplotype was associated with a decreased risk of CRC (OR = 0.732; 95% CI, 0.568-0.944, p = 0.016).
Table 5: ACYP2 haplotype frequencies and the association with the risk of colorectal cancer in cases and controls
Block ID |
SNPs |
Haplotype |
Freq (case) |
Freq (control) |
χ2 |
Pearson’s p |
OR |
95% CI |
p-adj |
|
|---|---|---|---|---|---|---|---|---|---|---|
1 |
rs1682111, rs843752, rs10439478, rs843645, rs11125529, rs12615793, rs843711, rs11896604 |
TGAGCGTC |
0.279 |
0.231 |
3.279 |
0.070 |
1.325 |
1.001 |
1.754 |
0.050 |
ATATCGCC |
0.303 |
0.327 |
0.674 |
0.412 |
0.930 |
0.713 |
1.213 |
0.592 |
||
TTCTAATG |
0.201 |
0.172 |
1.506 |
0.220 |
1.184 |
0.862 |
1.626 |
0.298 |
||
TTCTCGCC |
0.182 |
0.227 |
3.289 |
0.070 |
0.719 |
0.529 |
0.978 |
0.035* |
||
TTCTCACC |
0.008 |
0.015 |
1.092 |
0.297 |
0.542 |
0.160 |
1.837 |
0.326 |
||
2 |
rs843706, rs17045754 |
AC |
0.185 |
0.166 |
0.636 |
0.425 |
1.107 |
0.805 |
1.523 |
0.532 |
AG |
0.311 |
0.253 |
4.431 |
0.035 |
1.377 |
1.044 |
1.815 |
0.023* |
||
CG |
0.504 |
0.576 |
5.469 |
0.019 |
0.732 |
0.568 |
0.944 |
0.016* |
||
TA |
0.171 |
0.139 |
2.144 |
0.143 |
1.294 |
0.925 |
1.811 |
0.133 |
||
OR: odd ratio; CI: confidence interval.
p-adj: p-values were adjusted for sex and age;
*p value ≤ 0.05.
Bonferroni correction was performed, with p ≤ 0.00036 (0.05/14).
DISCUSSION
We investigated the associations between 14 SNPs in the ACYP2 gene and the risk of CRC in a Chinese Han population. We determined that four SNPs (rs6713088, rs843645, rs843711, and rs843706) were associated with an increased risk of CRC. Additionally, we demonstrated that three haplotypes in ACYP2 were associated with CRC risk.
Previous studies have revealed an association between the ACYP2 gene and cancer cell metabolism (i.e. pyruvate metabolism and glycolysis/gluconeogenesis) [15, 16]. Cancer cell survival and proliferation is associated with glucose uptake and altered expression of several metabolic intermediates in the glycolysis/gluconeogenesis pathway such as phosphofructokinase (PFK) and pyruvate kinase [17, 18]. PFK is essential for glycolysis and is a possible target for anticancer drugs. The transition of cancer cells to a highly proliferative state is correlated with reduced PFK expression [19]. Furthermore, pyruvate metabolism can generate lactate or alanine and is accompanied by the conversion of NADH to NAD+, which could provide substrates and energy for cancer cells to drive proliferation and differentiation [20]. Thus, stimulation of the pyruvate metabolic pathway may promote malignant transformation [18, 21]. We found that SNPs in ACPY2 were associated with CRC risk. Our data suggest that ACPY2 may play an important role in regulating glucose and pyruvate metabolism in CRC patients. However, the mechanistic details have not yet been elucidated.
Telomeres have a critical role in maintaining genomic stability [22, 23]. Telomere lengths become shorter following each cell division. Therefore, telomere length could serve as a marker of cellular and biological age [24]. It is possible that shortened telomeres may predispose individuals to certain diseases. Genome-wide association studies have demonstrated that rs11125529 in the ACYP2 gene was associated with reduced telomere length [12, 25]. Although we did not observe an association between rs11125529 and CRC risk in our study population, we did find that rs6713088, rs843645, rs843711, and rs843706 were associated with CRC risk. Furthermore, we found that the “TTCTCGCC” and “CG” haplotypes were protective against CRC while the “AG” haplotype may increase the risk of CRC. These results suggested that genetic variations in the ACYP2 gene may impact CRC risk by influencing telomere length.
The Bonferroni correction is commonly used to address false discovery rates resulting from multiple comparisons. We found that only the association between rs843711 and CRC was significant after Bonferroni correction, while rs843706, rs6713088, and rs843645 did not have a significant association with CRC. This may be due to our strict SNP filtering criteria and small sample size. The Bonferroni correction adjusts the value of alpha based on the number of tests performed and is relatively conservative. In some cases, truly significant differences may be deemed non-significant as a result of type II errors [26].
Our study had several intrinsic limitations. For example, CRC is a heterogeneous disease, and alcohol and tobacco consumption are important risk factors for CRC. Because our study had a relatively small size, and it did not incorporate data regarding alcohol and tobacco consumption, we could not explore the interactions between genetic polymorphisms and environmental factors in CRC patients. Therefore, the relationship between ACYP2 polymorphisms and drinking and smoking status in CRC must be evaluated in future studies.
In summary, our results indicate that SNPs in the ACYP2 gene are associated with CRC in a Chinese Han population. These SNPs may serve as a prognostic biomarkers for CRC in the Chinese population. Future studies will focus on elucidating the function of ACYP2 in CRC, which could be important for CRC prevention or early detection, and for improving patient prognosis.
MATERIALS AND METHODS
Study participants
All participants in our study were Han Chinese. A total of 247 patients and 300 controls were consecutively recruited between January 2011 and December 2014 at the LiaoNing Cancer Hospital and Institute, Affiliated Tumor Hospital of China Medical University, China. There were no gender, age, or disease stage restrictions for case recruitment. All cases were previously healthy individuals. The diagnosis of CRC was confirmed by histopathological examination. The control subjects had personal history of malignancy or chronic disease. We excluded patients who underwent radiotherapy or chemotherapy, as well as controls with chronic diseases. All participants in the current study were not related by blood.
Clinical data and demographic information
We used a standard epidemiological questionnaire and in-person interview to collect personal data including age, gender, residential region, education status, and family history of cancer. The case information was collected through consultation with the treating physicians or from medical chart reviews. All of the participants provided written informed consent. The Human Research Committee for Approval of Research Involving Human Subjects, LiaoNing Cancer Hospital and Institute, Affiliated Tumor Hospital of China Medical University, approved the use of human blood samples in this study.
SNP selection and genotyping
Among the 14 SNPs we selected, rs11125529 was chosen based on previously published polymorphisms associated with telomere length [12]. The others were randomly selected. All of the SNPs had MAFs > 5% in the HapMap Chinese Han Beijing population. DNA was extracted from whole blood samples using the GoldMag-Mini Whole Blood Genomic DNA Purification Kit (GoldMag Co. Ltd. Xi’an City, China). Quantification of the extracted DNA was performed using a NanoDrop 2000 (Thermo Scientific, Waltham, Massachusetts, USA). The multiplexed SNP MassEXTENDED assay was designed using the Sequenom MassARRAY Assay Design 3.0 Software [27]. Genotyping was performed on a Sequenom MassARRAY RS1000 platform using the manufacturer’s protocol. The PCR primers for each SNP are shown in Table 6. Data management and analysis was performed using the Sequenom Typer 4.0 Software [27, 28].
Table 6: Primers used in this study
SNP_ID |
1st_PCRP |
2st_PCRP |
UEP_SEQ |
|---|---|---|---|
rs6713088 |
ACGTTGGATGACACACACAGACTCCTTCAC |
ACGTTGGATGGTCACCAAAACACGTAATG |
gaggcCAGAATGGTCCACTAGAGA |
rs12621038 |
ACGTTGGATGATTGTGCTAGGCACTTTAGG |
ACGTTGGATGGGCATAAGTTTTATTGCCTC |
ccATTGCCTCAGCTAGACT |
rs1682111 |
ACGTTGGATGGAATTGCTGGGTTATTTGGC |
ACGTTGGATGGCCAGTGGGAATGCAAAATG |
tgtcATGCAAAATGAAACAGACACTT |
rs843752 |
ACGTTGGATGTCCTCTTTTCAGAAACCTGC |
ACGTTGGATGGAGACAACATAATGGAGGTC |
cGAGTTTGGGTTTGAGGT |
rs10439478 |
ACGTTGGATGTAGCACAAGACCTACACTGG |
ACGTTGGATGCTACACTCTCCAGAGGAATG |
TTGCTGTTTTCCCAGAA |
rs843645 |
ACGTTGGATGACAGTGCCTTTAGCAAGGTG |
ACGTTGGATGGAAATCTGAATACCACCTAC |
TCATAGGCACTACTGTATC |
rs11125529 |
ACGTTGGATGCCGAAGAAAAGAAGATGAC |
ACGTTGGATGGAGCTTAGTTGTTTACAGATG |
AGAAAAGAAGATGACTAAAACAT |
rs12615793 |
ACGTTGGATGATCTTGGCCCTTGAAGAA |
ACGTTGGATGTTTGAGCTTAGTTGTTTAC |
AAATTGAGTGACAAATATAAACTAC |
rs843711 |
ACGTTGGATGTGCCTTGTGGGAATTAGAGC |
ACGTTGGATGGACAAAGGACCTTACAACTC |
gggaTCAGGGAACCAGTGCAAA |
rs11896604 |
ACGTTGGATGTGTCTCTGACCTAGCATGTA |
ACGTTGGATGAAGTCAGAATAGTGCTTAC |
GTTAAGCTTGCAAGGAG |
rs843706 |
ACGTTGGATGTGAATAACTTGGTCTTATC |
ACGTTGGATGTGAAAGCCATAAATATTTTG |
cACTTGGTCTTATCTGATGC |
rs17045754 |
ACGTTGGATGCTGTAAAAGTTCTGGCATGG |
ACGTTGGATGGAAATCAGGGATATTAGTGC |
caggTATTCAGCTTCCTAGAGTTA |
rs843740 |
ACGTTGGATGTCACAGACCCCCATAGTTAG |
ACGTTGGATGTGAGGAAACTGAAGTTTAGC |
ccctcTTGCTTCTTGGGGCCTAACA |
rs843720 |
ACGTTGGATGCTTCACAACACTCCTGTAAG |
ACGTTGGATGAGTCAGAGCTAGACCTCTGG |
ccccAATCTGTCTCAGGGTCTT |
Statistical analysis
We used Microsoft Excel and the SPSS 18.0 statistical package (SPSS, Chicago, IL, USA) to perform statistical analyses. All p values presented in this study were two sided, and p = 0.05 was considered the cutoff for statistical significance. Differences in the characteristics of the case and control study populations were analyzed using chi-square tests for categorical variables and Welch’s t tests for continuous variables. In all analyses, the lower frequency allele was considered to be the ‘risk’ allele. Control genotype frequencies for each SNP were tested for departure from HWE using Fisher’s exact tests. Allele and genotype frequencies in the cases and controls were compared using chi-square tests [29]. Three models (additive, dominant, and recessive) were used to assess the association between each genotype and the risk of CRC. The effects of the polymorphisms on the risk of CRC were expressed as ORs with 95% CIs, which were calculated using unconditional logistic regression analysis after adjusting for age and gender [30]. Finally, LD patterns and haplotypes were evaluated using the Haploview software package (version 4.2) [31]. Bonferroni correction was performed on all p values, and the threshold for statistical significance was set at p ≤ 0.00036 (0.05/14).
ACKNOWLEDGMENTS
We are grateful to Dr. MingDi Yin for performing the statistical analysis. We also thank Yu Liu for providing technical support and performing the SNP association analysis.
CONFLICTS OF INTEREST
The authors declare that there are no conflicts of interest.
GRANT SUPPORT
This work was supported by grants from the Wu JiePing Medical Foundation (No. 320.6750.16063 to Zhong-guo Zhang) and the Project of the Scientific Research Foundation of Liaoning Province (No. 2016003002 to Zhong-guo Zhang).
REFERENCES
1. Center MM, Jemal A, Ward E. International trends in colorectal cancer incidence rates. Cancer epidemiology, biomarkers & prevention. 2009; 18:1688-1694.
2. Jemal A, Siegel R, Ward E, Hao Y, Xu J, Murray T, Thun MJ. Cancer statistics, 2008. CA Cancer J Clin. 2008; 58:71-96.
3. Lichtenstein P, Holm NV, Verkasalo PK, Iliadou A, Kaprio J, Koskenvuo M, Pukkala E, Skytthe A, Hemminki K. Environmental and heritable factors in the causation of cancer—analyses of cohorts of twins from Sweden, Denmark, and Finland. N Engl J Med. 2000; 45:167-168.
4. de Lange T, Shiue L, Myers RM, Cox DR, Naylor SL, Killery AM, Varmus HE. Structure and variability of human chromosome ends. Molecular and cellular biology. 1990; 10:518-527.
5. de Lange T. Shelterin: the protein complex that shapes and safeguards human telomeres. Genes & development. 2005; 19:2100-2110.
6. Blasco MA. Telomeres and human disease: ageing, cancer and beyond. Nature reviews Genetics. 2005; 6:611-622.
7. Hug N, Lingner J. Telomere length homeostasis. Chromosoma. 2006; 115:413-425.
8. Huffman KE, Levene SD, Tesmer VM, Shay JW, Wright WE. Telomere shortening is proportional to the size of the G-rich telomeric 3'-overhang. The Journal of biological chemistry. 2000; 275:19719-19722.
9. Allsopp RC, Vaziri H, Patterson C, Goldstein S, Younglai EV, Futcher AB, Greider CW, Harley CB. Telomere length predicts replicative capacity of human fibroblasts. Proceedings of the National Academy of Sciences of the United States of America. 1992; 89:10114-10118.
10. Wu X, Amos CI, Zhu Y, Zhao H, Grossman BH, Shay JW, Luo S, Hong WK, Spitz MR. Telomere dysfunction: a potential cancer predisposition factor. Journal of the National Cancer Institute. 2003; 95:1211-1218.
11. Degl'Innocenti D, Marzocchini R, Rosati F, Cellini E, Raugei G, Ramponi G. Acylphosphatase expression during macrophage differentiation and activation of U-937 cell line. Biochimie. 1999; 81:1031-1035.
12. Codd V, Nelson CP, Albrecht E, Mangino M, Deelen J, Buxton JL, Hottenga JJ, Fischer K, Esko T, Surakka I. Identification of seven loci affecting mean telomere length and their association with disease. Nature genetics. 2013; 45:422-427.
13. Yu WS, Jeong SJ, Kim JH, Lee HJ, Song HS, Kim MS, Ko E, Lee HJ, Khil JH, Jang HJ, Kim YC, Bae H, Chen CY, Kim SH. The genome-wide expression profile of 1,2,3,4,6-penta-O-galloyl-beta-D-glucose-treated MDA-MB-231 breast cancer cells: molecular target on cancer metabolism. Molecules and cells. 2011; 32:123-132.
14. Pooley KA, Bojesen SE, Weischer M, Nielsen SF, Thompson D, Amin Al Olama A, Michailidou K, Tyrer JP, Benlloch S, Brown J, Audley T, Luben R, Khaw K-T, et al. A genome-wide association scan (GWAS) for mean telomere length within the COGS project: identified loci show little association with hormone-related cancer risk. Human Molecular Genetics. 2013.
15. Yu WS, Jeong S-J, Kim J-H, Lee H-J, Song HS, Kim M-S, Ko E, Lee H-J, Khil J-H, Jang H-J. The genome-wide expression profile of 1, 2, 3, 4, 6-penta-O-galloyl-β-D-glucose-treated MDA-MB-231 breast cancer cells: molecular target on cancer metabolism. Molecules and cells. 2011; 32:123-132.
16. Won HH, Lee J, Park JO, Park YS, Lim HY, Kang WK, Kim JW, Lee SY, Park SH. Polymorphic markers associated with severe oxaliplatin-induced, chronic peripheral neuropathy in colon cancer patients. Cancer. 2012; 118:2828-2836.
17. Pradelli L, Villa E, Zunino B, Marchetti S, Ricci J. Glucose metabolism is inhibited by caspases upon the induction of apoptosis. Cell death & disease. 2014; 5:e1406.
18. Conde VR, Oliveira PF, Nunes AR, Rocha CS, Ramalhosa E, Pereira JA, Alves MG, Silva BM. The progression from a lower to a higher invasive stage of bladder cancer is associated with severe alterations in glucose and pyruvate metabolism. Experimental cell research. 2015; 335:91-98.
19. Vaz CV, Alves MG, Marques R, Moreira PI, Oliveira PF, Maia CJ, Socorro S. Androgen-responsive and nonresponsive prostate cancer cells present a distinct glycolytic metabolism profile. The international journal of biochemistry & cell biology. 2012; 44:2077-2084.
20. Israelsen WJ, Vander Heiden MG. (2015). Pyruvate kinase: function, regulation and role in cancer. Seminars in cell & developmental biology: Elsevier), pp. 43-51.
21. Szlosarek PW, Lee S, Pollard PJ. Rewiring mitochondrial pyruvate metabolism: switching off the light in cancer cells? Molecular cell. 2014; 56:343-344.
22. Blackburn EH. Telomere states and cell fates. Nature. 2000; 408:53-56.
23. Wong JM, Collins K. Telomere maintenance and disease. The Lancet. 2003; 362:983-988.
24. Harris SE, Martin-Ruiz C, von Zglinicki T, Starr JM, Deary IJ. Telomere length and aging biomarkers in 70-year-olds: the Lothian Birth Cohort 1936. Neurobiology of aging. 2012; 33:1486. e1483-1486. e1488.
25. Pooley KA, Bojesen SE, Weischer M, Nielsen SF, Thompson D, Al Olama AA, Michailidou K, Tyrer JP, Benlloch S, Brown J. A genome-wide association scan (GWAS) for mean telomere length within the COGS project: identified loci show little association with hormone-related cancer risk. Human molecular genetics. 2013:ddt355.
26. Perneger TV. What's wrong with Bonferroni adjustments. Bmj. 1998; 316:1236-1238.
27. Gabriel S, Ziaugra L, Tabbaa D. SNP genotyping using the Sequenom MassARRAY iPLEX platform. Current protocols in human genetics. 2009:2.12. 11-12.12. 16.
28. Thomas RK, Baker AC, DeBiasi RM, Winckler W, LaFramboise T, Lin WM, Wang M, Feng W, Zander T, MacConaill LE. High-throughput oncogene mutation profiling in human cancer. Nature genetics. 2007; 39:347-351.
29. Adamec C. Example of the use of the nonparametric test. Test X2 for comparison of 2 independent examples. Ceskoslovenské zdravotnictví. 1964; 12:613.
30. Bland JM, Altman DG. Statistics notes. The odds ratio. BMJ (Clinical research ed). 2000; 320:1468.
31. Yong Y, Lin H. SHEsis, a powerful software platform for analyses of linkage disequilibrium, haplotype construction, and genetic association at polymorphism loci. Cell research. 2005; 15:97-98.