
INTRODUCTION
Prostate cancer (PCa) is the most common cause of cancers in the Western population [1]. Although its incidence is lower in Asia, the relatively higher mortality rates and asymptomatic clinical features make early detection to remain a critical public health goal [1–5]. Transrectal ultrasound (TRUS)-guided prostate biopsy is currently the ‘gold standard’ for PCa diagnosis [6]. Nevertheless, there is a growing concern regarding the increasing incidence of serious infections, hematuria, hematospermia and bloody stool after biopsy [7].
Conventionally, the level of prostate-specific antigen (PSA), a serine protease secreted by prostate epithelial cells, determines whether a prostate biopsy should be performed [8]. However, the low sensitivity and specificity of PSA give rise to unnecessary biopsies, especially for patients with PSA ranging from 4 to 10 ng/mL, the so called “gray zone” [9–11]. In 2012, Wang et al. found TRUS-guided prostate biopsy positive diagnosis rates of 12.1%, 31.1%, 48.0% and 91.2% for PSA levels of <10, 10–20, 20–50 and >50 ng/mL group, respectively, in a cohort of Chinese patients [12]. Due to financial reasons, North Chinese individuals do not have so strong health examination consciousness as western people. They generally do not visit a doctor until they show lower urinary tract symptoms, which may account for the higher PSA level but lower positive diagnostic rates. Thus, the gray zone can be expanded to 4–50 ng/mL in North Chinese patients.
This study assessed clinical indexes in North Chinese patients with PSA levels of 4–10 and 10–50 ng/mL, respectively, who underwent biopsies. Then new risk assessment models of prostate cancer (RAM-PCa) were developed. These new models helped further formulate a reasonable follow-up strategy to overcome the limitations of PSA and the lack of health screening awareness. These findings might help increase PCa detection rates and reduce unnecessary prostate biopsies in North Chinese patients.
RESULTS
This retrospective study evaluated 702 patients, divided into two groups based on PSA levels: 326 and 376 with 4–10 and 10–50 ng/mL PSA, respectively. Patient characteristics are shown in Tables 1 and 2, respectively. In patients with 4–10 ng/mL PSA, significant differences were found in age (P<0.001), digital rectal examination (DRE) (P<0.001), PSA (P=0.003), fPSA (P=0.016), f/tPSA (P<0.001), PSA density (PSAD, the ratio of PSA to PV) (P<0.001), creatinine (P=0.005), prostate volume (PV) (P=0.018), hypoechoic lesions in transabdominal ultrasound (HL-TAUS) (P<0.001), hypointense lesions in magnetic resonance imaging (HL-MRI) (<0.001) and breaking through the envelope of prostate in magnetic resonance imaging (BTEP-MRI) (P<0.001); no statistically significant difference was found in blood urea nitrogen (BUN). In patients with 10–50 ng/mL PSA, significant differences were obtained in age (P<0.001), DRE (P<0.001), PSA (P<0.001), PSAD (P<0.001), HL-TAUS (P<0.001), PV (P<0.001), HL-MRI (P<0.001) and BTEP-MRI (P<0.001), except fPSA, f/tPSA, creatinine and BUN. Older patients had an overtly higher incidence of prostate cancer. No statistically significant differences in fPSA and f/tPSA were found between the PCa and Non-PCa groups at the PSA 10-50ng/mL level, suggesting a lower diagnostic value with increasing PSA level. Surprisingly, patients with 4–10 ng/mL PSA in the PCa group showed lower creatinine levels than those in the Non-PCa group.
Table 1: Characteristics of patients with 4-10 ng/mL PSA in the analysis-modeling stage
Variables |
Group |
P |
|
|---|---|---|---|
Non-PCa |
PCa |
||
No. of subjects, n(%) |
268(82.21) |
58(17.79) |
|
Age(year) |
68.08±8.34 |
76.88±9.59 |
<0.001a |
DRE, n(%) |
42(15.67) |
26(44.83) |
<0.001b |
PSA (ng/mL) |
6.31±2.57 |
7.69±2.55 |
0.003c |
fPSA(ng/mL) |
1.13±0.79 |
0.88±0.96 |
0.016c |
f/t PSA |
0.18±0.10 |
0.14±0.12 |
<0.001c |
PSAD |
0.11±0.08 |
0.14±0.09 |
<0.001c |
Creatinine (μmol/L) |
83.25±20.06 |
77.00±22.00 |
0.005c |
BUN(mmol/L) |
5.80±2.00 |
6.20±2.40 |
0.217c |
HL-TAUS, n(%) |
18(6.72) |
14(24.14) |
<0.001b |
PV(cm3) |
57.67±38.42 |
53.28±35.04 |
0.018c |
HL-MRI, n(%) |
62(23.13) |
30(51.72) |
<0.001b |
BTEP-MRI, n(%) |
6(2.24) |
12(20.69) |
<0.001b |
a: Student’s t-test, prensented as Mean ± Standard Deviation (SD).
b: Chi-square test or Fisher exact probability test.
c: Rank sum test, prensented as Median ± Interquartile Range (IQR).
Table 2: Characteristics of patients with 10-50 ng/mL PSA in the analysis-modeling stage
Variables |
Group |
P |
|
|---|---|---|---|
Non-PCa |
PCa |
||
No. of subjects, n(%) |
188(50.00) |
188(50.00) |
|
Age(year) |
68.98±7.80 |
76.12±9.85 |
<0.001a |
DRE, n(%) |
46(24.47) |
104(55.32) |
<0.001b |
PSA (ng/mL) |
17.50±10.90 |
21.91±18.30 |
0.001c |
fPSA(ng/mL) |
2.47±1.60 |
2.69±2.68 |
0.098c |
f/t PSA |
0.15±0.08 |
0.14±0.11 |
0.374c |
PSAD |
0.25±0.24 |
0.46±0.57 |
<0.001c |
Creatinine (μmol/L) |
81.36±19.90 |
77.80±24.70 |
0.194c |
BUN(mmol/L) |
5.65±2.00 |
5.90±2.30 |
0.138c |
HL-TAUS, n(%) |
22(11.70) |
70(37.23) |
<0.001b |
PV (mL) |
71.24±42.58 |
45.82±34.27 |
<0.001c |
HL-MRI, n(%) |
64(34.04) |
134(71.28) |
<0.001b |
BTEP-MRI, n(%) |
6(3.19) |
34(18.09) |
<0.001b |
a: Student’s t-test, prensented as Mean ± SD.
b: Chi-square test or Fisher exact probability test.
c: Rank sum test, prensented as Median ± IQR.
In the PSA 4–10 ng/mL group, a multivariate logistic analysis with a backward elimination selection procedure was performed, evaluating age, ten-fold f/tPSA, ten-fold PSAD, creatinine, HL-MRI and BTEP-MRI (Tables 3 and 4). Meanwhile, in the PSA 10–50 ng/mL group, age, DRE, PSA, PV, HL-TAUS and HL-MRI were entered in multivariate logistic analysis (Tables 5 and 6). Thus, new models were established based on logistic analysis results. The equations for the risk assessment model of prostate cancer risk (RAM-PCaR) were defined as follows:
Table 3: Univariate logistic regression analysis of the PSA 4-10 ng/mL group
Variables |
OR |
95%CI |
P |
|
|---|---|---|---|---|
Lower |
Upper |
|||
Age |
1.133 |
1.088 |
1.180 |
<0.001* |
DRE |
4.372 |
2.368 |
8.074 |
<0.001* |
PSA |
1.272 |
1.081 |
1.498 |
0.004* |
fPSA |
0.597 |
0.338 |
1.054 |
0.075 |
Ten-fold f/t PSA |
0.376 |
0.239 |
0.591 |
<0.001* |
Ten-fold PSAD |
2.341 |
1.606 |
3.411 |
<0.001* |
Creatinine |
0.981 |
0.965 |
0.997 |
0.024* |
BUN |
0.976 |
0.862 |
1.105 |
0.699 |
HL-TAUS |
4.419 |
2.049 |
9.529 |
<0.001* |
PV |
0.989 |
0.978 |
1.000 |
0.047* |
HL-MRI |
3.560 |
1.977 |
6.410 |
<0.001* |
BTEP-MRI |
11.391 |
4.071 |
31.869 |
<0.001* |
*P<0.05.
Table 4: Multivariate logistic regression analysis of the PSA 4-10 ng/mL group
Variables |
β |
OR |
95%CI |
P |
|
|---|---|---|---|---|---|
Lower |
Upper |
||||
Intercept |
-12.165 |
<0.001 |
|||
Age |
0.191 |
1.211 |
1.146 |
1.279 |
<0.001 |
Ten-fold f/t PSA |
-1.489 |
0.226 |
0.113 |
0.451 |
<0.001 |
Ten-fold PSAD |
0.838 |
2.312 |
1.212 |
4.411 |
0.011 |
Creatinine |
-0.033 |
0.967 |
0.945 |
0.990 |
0.006 |
HL-MRI |
1.073 |
2.923 |
1.254 |
6.812 |
0.013 |
BTEP-MRI |
3.375 |
29.233 |
6.782 |
126.016 |
<0.001 |
Six indexes above remained in the logistic analysis with a backward elimination selection procedure, and constructed an equation for RAM-PCa.
Table 5: Univariate logistic regression analysis of the PSA 10-50 ng/mL group
Variables |
OR |
95%CI |
P |
|
|---|---|---|---|---|
Lower |
Upper |
|||
Age |
1.096 |
1.068 |
1.126 |
<0.001* |
DRE |
3.822 |
2.463 |
5.932 |
<0.001* |
PSA |
1.043 |
1.024 |
1.064 |
<0.001* |
fPSA |
1.096 |
1.022 |
1.175 |
0.011* |
Ten-fold f/t PSA |
1.162 |
0.943 |
1.433 |
0.159 |
Ten-fold PSAD |
1.328 |
1.214 |
1.453 |
<0.001* |
Creatinine |
0.996 |
0.990 |
1.002 |
0.224 |
BUN |
1.036 |
0.950 |
1.130 |
0.425 |
HL-TAUS |
4.476 |
2.624 |
7.635 |
<0.001* |
PV |
0.987 |
0.981 |
0.993 |
<0.001* |
HL-MRI |
4.808 |
3.106 |
7.441 |
<0.001* |
BTEP-MRI |
6.694 |
2.738 |
16.366 |
<0.001* |
*P<0.05.
Table 6: Multivariate logistic regression analysis of the PSA 10-50 ng/mL group
Variables |
β |
OR |
95%CI |
P |
|
|---|---|---|---|---|---|
Lower |
Upper |
||||
Intercept |
-9.728 |
<0.001 |
|||
Age |
0.111 |
1.118 |
1.082 |
1.155 |
<0.001 |
DRE |
1.439 |
4.215 |
2.397 |
7.411 |
<0.001 |
PSA |
0.045 |
1.046 |
1.018 |
1.074 |
0.001 |
HL-TURS |
1.258 |
3.517 |
1.798 |
6.879 |
<0.001 |
PV |
-0.014 |
0.986 |
0.979 |
0.993 |
<0.001 |
HL-MRI |
1.356 |
3.882 |
2.231 |
6.755 |
<0.001 |
Six indexes above remained in the logistic analysis with a backward elimination selection procedure, and constructed an equation for RAM-PCa.
These results provided sufficient information to support the generation of nomograms (Figures 1 and 2). Predictive efficiency and accuracy were quantified by determining the areas under the receiver operating characteristic curves (AUCs) (Figures 3 and 4). In the PSA 4–10 ng/mL group, the RAM-PCa yielded a higher AUC (0.937) compared with values obtained for PSA (0.624), f/tPSA (0.679) and PSAD (0.661) (Figure 3). In the new model, a cut-off value of 0.1067 was derived, yielding sensitivity and specificity of 96.55% and 80.00%, respectively, both higher than those of PSA, f/tPSA and PSAD. In the PSA 10–50 ng/mL group, the RAM-PCa had remarkably higher AUC (0.873), compared with values obtained for PSA (0.595), f/tPSA (0.527) and PSAD (0.703) (Figure 4). In this new model, a cut-off value of 0.6183 was determined, with sensitivity and specificity of 71.28% and 90.43%, respectively, both higher than those of PSA, f/tPSA and PSAD. The validation curves of these new models are shown in Figures 5 and 6. Using bootstrapping, the predictive accuracy values calculated by the Hosmer’s concordance index were estimated at 0.937 and 0.873, respectively.
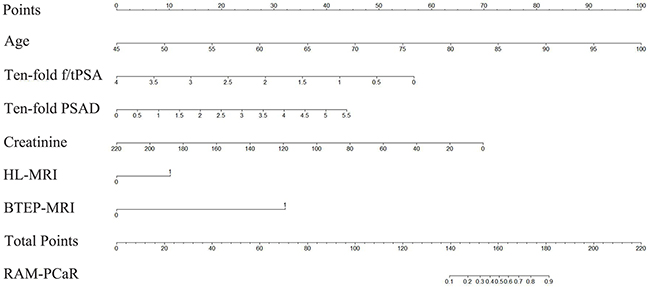
Figure 1: Nomogram of the RAM-PCa for the PSA 4-10 ng/mL group for predicting a positive prostate biopsy. Individual values were placed on each variable axis to obtain the corresponding point on the ‘Point’ axis. The sum of these points was projected to the ‘Total Points’ axis to determine the probability of prostate cancer on the ‘RAM-PCaR’ axis.
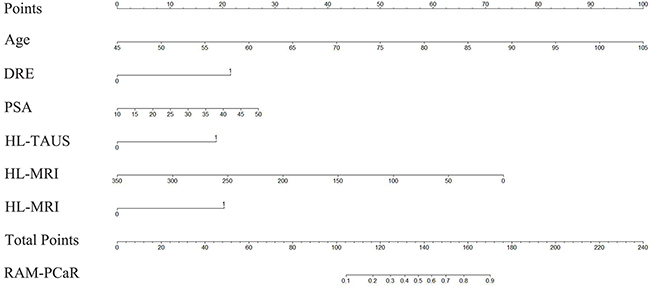
Figure 2: Nomogram of the RAM-PCa for the PSA 10-50 ng/mL group for predicting a positive prostate biopsy. Individual values were placed on each variable axis, to obtain the corresponding point on the ‘Point’ axis. The sum of these points was projected to the ‘Total Points’ axis to determine the probability of prostate cancer on the ‘RAM-PCaR’ axis.
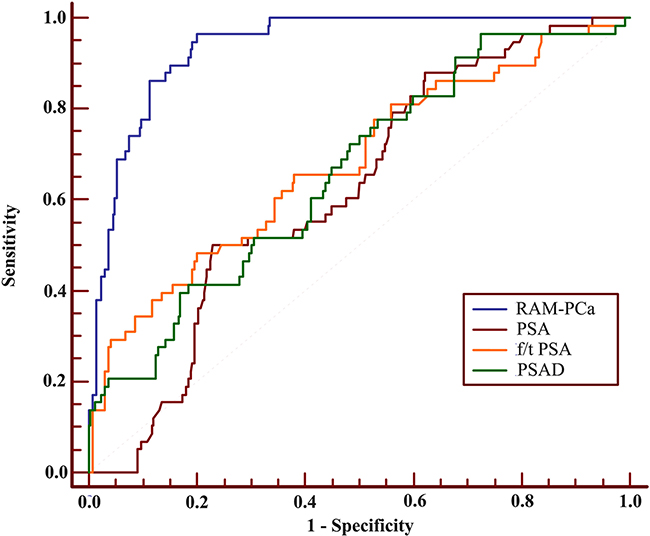
Figure 3: Receiver operating characteristic (ROC) curves of RAM-PCa, PSA, f/tPSA and PSAD for the PSA 4-10 ng/mL group. AUC values of these indexes were 0.937, 0.624, 0.679 and 0.661, respectively. Sensitivities were 96.55%, 50.00%, 48.28% and 96.55%, respectively, for specificities of 80.00%, 77.15%, 79.85% and 28.09%, respectively.
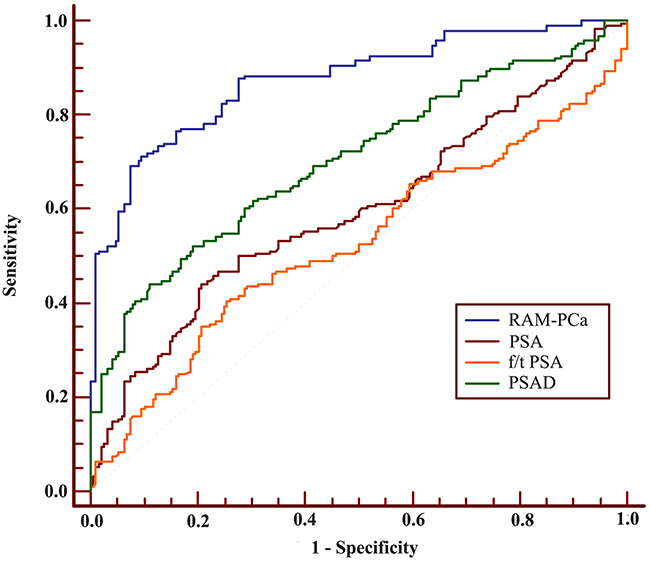
Figure 4: ROC of RAM-PCa, PSA, f/tPSA and PSAD for the PSA 10-50 ng/mL group. AUC values of these indexes were 0.873, 0.595, 0.527 and 0.703, respectively. Sensitivities were 71.28%, 44.15%, 40.43% and 44.15%, respectively, with specificities of 90.43%, 79.26%, 74.47% and 88.83%, respectively.
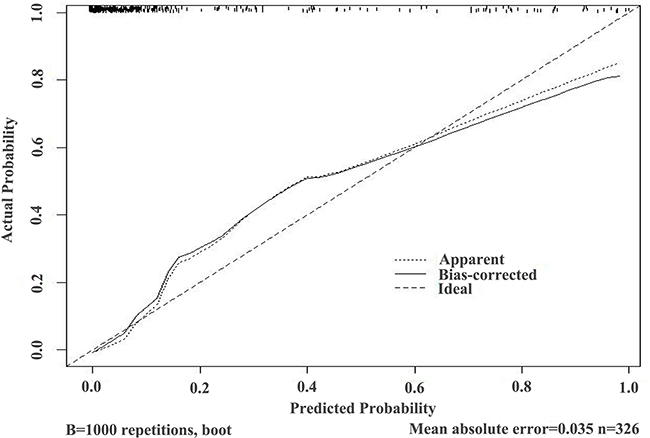
Figure 5: Validation curve of the predictive accuracy (93.7%) of RAM-PCa in the PSA 4-10 ng/mL group.
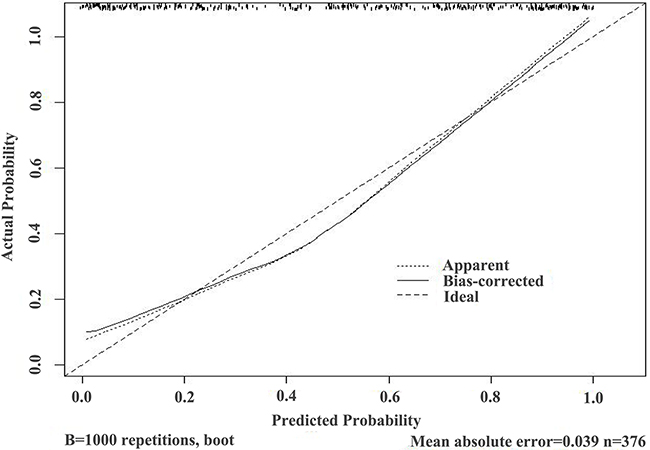
Figure 6: Validation curve of the predictive accuracy (87.3%) of RAM-PCa in the PSA 10-50 ng/mL group.
In the external validation study, 271 patients with PSA at 4–10 ng/mL and 10–50 ng/mL, respectively, in seven hospitals from January 2015 to July 2016, were assessed using the newly developed models. The high-risk group underwent biopsies while the remaining patients were under active monitoring. Statistical characteristics of the two stages are shown in Tables 7 and 8. For validation patients with 4–10 ng/mL PSA, the positive rate was improved from 17.79% to 39.29% (P=0.006) compared with the retrospective study. For validation patients with 10–50 ng/mL PSA, the positive rate was improved from 50.0% to 71.43% (P=0.015) compared with the retrospective stage. No significant differences were found in predictive indexes.
Table 7: Comparison of patient characteristics in two stages for the PSA 4-10 ng/mL group
Variables |
Stage 1* |
Stage 2* |
P |
|---|---|---|---|
No. of subjects, n(%) |
326(75.64) |
105(24.36) |
|
Age(year) |
69.65±9.20 |
68.24±6.86 |
0.095a |
DRE, n(%) |
68(20.86) |
16(15.24) |
0.206b |
PSA (ng/mL) |
6.40±2.80 |
6.97±2.81 |
0.166c |
fPSA(ng/mL) |
1.11±0.81 |
1.14±0.81 |
0.464c |
f/t PSA |
0.18±0.07 |
0.19±0.08 |
0.333a |
PSAD |
0.12±0.08 |
0.11±0.08 |
0.264c |
Creatinine (μmol/L) |
82.00±21.68 |
78.00±18.00 |
0.423c |
BUN(mmol/L) |
5.80±2.00 |
5.60±1.80 |
0.430c |
HL-TAUS, n(%) |
32(9.82) |
13(12.38) |
0.455b |
PV (mL) |
56.78±36.80 |
59.62±43.68 |
0.070c |
HL-MRI, n(%) |
92(28.22) |
24(22.86) |
0.281b |
BTEP-MRI, n(%) |
18(5.52) |
2(1.90) |
0.126b |
Biopsy case, n(%) |
326(100.00) |
28(26.67) |
<0.001b |
Positive cases, n(%) |
58(17.79) |
11(39.29)# |
0.006 |
a: Student’s t-test, prensented as Mean ± SD.
b: Chi-square test or Fisher exact probability test.
c: Rank sum test, prensented as Median ± IQR.
*: Stage 1: analysis-modeling stage; Stage 2: external validation stage.
#: The positive rate was discussed in high-risk patients in stage 2.
Table 8: Comparison of patient characteristics in two stages for the PSA 10-50 ng/mL group
Variables |
Stage 1* |
Stage 2* |
P |
|---|---|---|---|
No. of subjects, n(%) |
376(69.37) |
166(30.63) |
|
Age (year) |
72.55±9.56 |
71.15±8.05 |
<0.079a |
DRE, n(%) |
150(39.89) |
57(34.34) |
0.220b |
PSA (ng/mL) |
18.75±14.66 |
17.69±12.50 |
0.459c |
fPSA (ng/mL) |
2.59±2.11 |
2.45±1.49 |
0.196c |
f/t PSA |
0.14±0.10 |
0.14±0.09 |
0.476c |
PSAD |
0.31±0.38 |
0.33±0.32 |
0.612c |
Creatinine (μmol/L) |
79.21±20.80 |
78.00±12.00 |
0.155c |
BUN (mmol/L) |
5.80±2.25 |
5.90±2.10 |
0.102c |
HL-TAUS, n(%) |
92(24.47) |
31(18.67) |
0.138b |
PV (mL) |
60.97±43.56 |
58.36±39.89 |
0.878c |
HL-MRI, n(%) |
198(52.66) |
95(57.23) |
0.325b |
BTEP-MRI, n(%) |
40(10.64) |
12(7.23) |
0.214b |
Biopsy case, n(%) |
376(100.00) |
35(21.08) |
<0.001b |
Positive cases, n(%) |
188(50.00) |
25(71.43)# |
0.015b |
a: Student’s t-test, prensented as Mean ± SD.
b: Chi-square test or Fisher exact probability test.
c: Rank sum test, prensented as Median ± IQR.
*: Stage 1: analysis-modeling stage; Stage 2: external validation stage.
#: The positive rate was discussed in high-risk patients in stage 2.
DISCUSSION
Beside PCa, there are other physiological conditions, including benign prostatic hyperplasia, inflammation, infection, and trauma that increase PSA levels [8–11]. This could lead to unnecessary biopsies and over-diagnosis as well as over-treatment of PCa, causing pain, infection, bleeding, urinary obstruction, emotional distress and a waste of medical resources [13, 14]. Measures have been taken to reduce excessive biopsies in Western countries, including the addition of new predictive indexes such as [-2]proPSA (p2PSA), prostate health index (PHI), and prostate cancer antigen 3 (PCA3), to PSA screening models [11, 15, 16]. However, screening these new indexes on a large scale remains challenging for China. On the other hand, well-known models, such as prostate cancer prevention trial (PCPT) and European randomized study of screening for prostate cancer (ERSPC), based on Western populations, are not suitable for Chinese males owing to the overestimation of PCa risk due to population heterogeneity [17–20].
Instead of regular PSA checkups, Chinese individuals are usually examined for PSA when they have lower urinary tract symptoms, i.e., some individuals with high PSA levels but no serious lower urinary tract symptoms might not participate in PSA screening programs. This may account for the low positive diagnostic rate in the Chinese population at the same PSA level. In this study, the positive diagnosis rate of PSA 4–10 ng/mL was 17.79% while that of PSA 10–50 ng/mL was 50.00%. Thus, the gray zone could be expanded significantly from PSA 4–10 ng/mL to PSA 4–50 ng/mL among North Chinese individuals.
In both PSA 4–10 and 10–50 ng/mL groups of the analysis-modeling stage, patients with RAM-PCaR higher than respective cut-off values were assigned to the high-risk group while remaining constituted the low-risk group. Positive biopsy rates of high-risk and low-risk groups showed notable differences (50.90% vs. 0.93%, P<0.001 for PSA 4–10 ng/mL group; 87.58% vs. 24.22%, P<0.001 for PSA 10–50 ng/mL group). Specifically, in the low risk group of patients with 4–10 ng/mL PSA, only 2 patients were diagnosed with PCa out of 216 who underwent biopsy. The low-risk group of patients with 10–50 ng/mL PSA showed similar results, with 54 patients diagnosed with PCa out of 223 who underwent biopsy.
At the external validation stage, we prospectively verified the follow-up strategy in 105 patients with 4–10 ng/mL PSA and 166 individuals with 10–50 ng/mL PSA. A total of 28 out of 105 (26.67%) and 35 out of 166 (21.08%) patients underwent prostate biopsies due to RAM-PCaR higher than cutoff values. Interestingly, positive rates of PCa were improved significantly (PSA 4–10 ng/mL group, 17.79% vs. 39.29%, P=0.006; PSA 10–50 ng/mL group, 50.00% vs. 71.43%, P=0.015). In other words, a certain number of patients assigned to low risk groups could avoid immediate prostate biopsies and continue to enjoy good quality of life, but receiving active surveillance.
For retrospective study, creatinine acted as a protective factor in PSA 4-10 ng/ml group. Indeed, compared with the PCa group, the Non-PCa group had larger average prostate volumes (57.67 vs 53.28, p=0.018, Table 1), which might reflect more serious lower urinary tract symptoms, causing renal function impairment at a certain level. Current conventional assays show a positive correlation between blood creatinine and kidney damage [21]. Moreover, it can be concluded that PSA plays a more significant diagnostic role in patients with 10–50 ng/mL PSA, while f/t PSA and PSAD show obvious differences between the PCa and Non-PCa groups for individuals with 4–10 ng/mL PSA. This characteristic was in line with the Guidelines on Prostate Cancer of European Association of Urology using f/t PSA and PSAD to evaluate whether a prostate biopsy should be performed in the ‘grayzone’, PSA 4–10 ng/mL. And our previous study suggested that PSA other than PSAD, remained valuable predictor of the pathologic stage of PCa [22]. Thus, further study could be done to investigate the new model using PSA as well as other clinical indexes to predict the pathologic stage of PCa.
This study included 973 patients from January 2010 to July 2016 from seven hospitals across North China, with a population accounting for 25% of the whole country. In addition to the large-scale and multiple institutional sampling, this study expanded the gray-zone from PSA 4–10 ng/mL to PSA 4–50 ng/mL for North Chinese individuals. Thus, a widespread application of the current findings can be made, significantly reducing the unnecessary biopsies for such regions, where the economic foundation, cultural basis, and health awareness are not strong. Moreover, creatinine showed obvious statistical differences between the PCa and Non-PCa groups in 4-10 ng/mL PSA model and was absorbed in risk assessment models at the first time.
The study had several limitations. First, the total number of patients, 702 patients for analysis-modeling stage and 271 for external validation stage, was relatively small. In addition, prostate volumes were measured by MRI, with potential errors in the calculated outcome of volume formulation. Thirdly, the RAM-PCa receiver operating characteristic curve (ROC) for the PSA 10-50 ng/mL group showed lower sensitivity compared with that of the PSA 4-10 ng/mL group (71.28% vs 96.55%), indicating that a certain number of individuals would be misdiagnosed. However, larger sample size, more definite group and additional correlated indexes are being assessed by our team in order to establish a more convincing model in the future.
MATERIALS AND METHODS
Participants
The present study included two stages: analysis-modeling stage and external validation stage. The former was a multi-institutional retrospective study to develop risk assessment models. It included 702 patients with elevated PSA levels from 4 to 50 ng/mL, who had undergone a TRUS-guided prostate biopsy in seven hospitals (listed below) across North China, from January 2010 to December 2014. In the external validation stage, 271 patients with PSA levels ranging from 4 to 50 ng/mL from the same institutions, from January 2015 to July 2016, were assessed to advise regarding biopsy performance using the new model. In both stages, patients with a history of urinary infection, urinary tract trauma, transurethral prostate resection or prostate biopsy were excluded. The seven hospitals included Shandong Provincial Hospital Affiliated to Shandong University, Shandong Provincial Hospital Affiliated to Shandong University (East Branch), Lanling People’s Hospital, Dongying People’s Hospital, Yucheng People’s Hospital, Guangrao County Hospital of traditional Chinese Medicine and Weihai Municipal Hospital.
Study design
Analysis-modeling stage
This stage included 702 patients, with 326 and 376 in the PSA 4–10 ng/mL and 10–50 ng/mL groups, respectively. The patiens underwent TRUS-guided conventional systemic 12-core biopsy, in addition to a special core, derived from hypoechoic lesions in ultrasound, hypointense lesions in magnetic resonance imaging or the prostatic apex. According to biopsy pathology, each group was divided into two subgroups, PCa and Non-PCa. Basic clinical indexes, including age, PSA, fPSA, f/tPSA, DRE, PV (obtained by MRI of the prostate, as PV = 1/6 ×π× transverse diameter × anteroposterior diameter ×cephalocaudal diameter), PSAD, two renal function indexes [BUN and creatinine], HL-TAUS, HL-MRI, and BTEP-MRI were collected. Then differences in the above indexes between the PCa and Non-PCa groups were assessed by Student’s t-test, rank-sum test, chi-square test, or Fisher exact probability test. Multiple logistic regression analyses using a backward elimination selection procedure were applied to build risk assessment models followed by the appraisal of diagnostic efficiency (ROC) and accuracy (validation curve). Furthermore, the normograms assisted in predicting biopsy outcome, visually and intuitively.
External validation stage
In this stage, 271 patients were prospectively evaluated, including 105 and 166 with PSA levels of 4–10 ng/mL and 10–50 ng/mL, respectively, using the newly developed models. Based on the comparison between the cutoff values of ROC and the individual values calculated from the RAM-PCa equation, patients were classified into high-risk and low-risk groups, respectively. High-risk patients were advised to undergo prostate biopsies, and low-risk group was advised to undergo continuous observation. Finally, biopsy rates and other common indexes were assessed between the two stages, while the detection rate of PCa was compared between first stage groups and the high-risk group in the second stage.
Statistical analysis
Statistical analyses were carried out with the SPSS 19.0 software, R software version 2.15.0, and MedCalc software version 11.4.2.0. Differences in patient characteristics were analyzed by Student’s t-test for continuous variables with a Gaussian distribution, rank-sum test for continuous variables with non-normal distribution, and chi-square test or Fisher’s exact probability test for categorical variables. After selecting potential predictive factors, multiple logistic regression analyses with a backward elimination selection procedure were used to develop the new risk assessment models. ROC curves were used to evaluate the efficiency of the models and those of other indexes such as PSA, f/tPSA, and PSAD. The Hosmer-Lemeshow test using the concordance index on 1000 bootstrapped samples was employed for the validation of the new models.
CONCLUSIONS
Overall, we developed new models to assess whether TRUS-guided prostate biopsy should be performed in North Chinese patients with PSA level ranges 4 and 50 ng/mL. In addition, we developed a follow-up strategy for such regions lacking new PCa screening methods and health examination awareness. The current findings could help reduce the number of unnecessary prostate biopsies, also increasing the detection rate of PCa without delaying diagnosis and treatment for North Chinese patients.
Abbreviations
PCa, prostate cancer; PSA, prostate-specific antigen; TRUS, Transrectal ultrasound; fPSA, free PSA; f/tPSA, free/total PSA; PSAD, PSA density; PV, prostate volume; HL-TAUS, hypoechoic lesions in transabdominal ultrasound; HL-MRI, hypointense lesions in magnetic resonance imaging; BTEP-MRI, breaking through the envelope of prostate in magnetic resonance imaging; RAM-PCa, risk assessment models of prostate cancer; RAM-PCaR, risk of risk assessment model for prostate cancer; ROC, receiver operating characteristic curve; AUC, areas under curve; p2PSA, [-2]proPSA; PHI, prostate health index; PCA3, prostate cancer antigen 3; PCPT, prostate cancer prevention trial; ERSPC, European randomized study of screening for prostate cancer; SD, Standard Deviation; IQR, Interquartile Range.
ACKNOWLEDGMENTS
We gratefully acknowledge the help from Chinese Prostate Cancer Database (C-CaP), for easy access to data acquisition of prostate cancer patients from seven hospitals.
CONFLICTS OF INTEREST
The authors declare no conflicts of interest.
FUNDINGS
This study was funded by the National Natural Science Foundation of China (No.81602227), the Natural Science Foundation of Shandong Province (No.ZR2014HM111 and No.ZR2014HP015), the Shandong Province Natural Science Foundation, China (No.2014ZRB14081 and No.2014ZRB14513), the Science and Technology Development Plan Project of Shandong Province for 2014, P.R.China (No.2014GGB14146 and No.2014GSF118134), the Key Research and Development Program of Shandong Province (No.2014GGH218036 and No.2015GSF118055), the Projects of Medical and Health Technology Development Program of Shandong Province (No.2014WS0341 and No.2014WS0353) and the Science and Technology Research Foundation of Jinan City (No.201121060).
Author’s contributions
Jing Zhao and Shuai Liu are co-first authors, who contributed equally to draft and revised this manuscript. Jiaju Lu is the corresponding author who contributed to design of the study. Zhihong Niu, Hui Zhang, Zhilong Huang, Juhui Qiu, Qing Li, Ning Li, Fang Xie and Jilei Cui contirbuted to patient recruitment and collect the data. Dexuan Gao and Sentai Ding contirbuted to process the data.
Ethics statement
The institutional review board of Shandong Provincial Hospital Affiliated to Shandong University approved the present study. Written informed consent was obtained from all patients with regard to information storage for research purposes.
REFERENCES
1. Wang YJ, Huang CY, Hou WH, Wang CC, Lan KH, Yu HJ, Lai MK, Liu SP, Pu YS, Cheng JC. Dual-timing PSA as a biomarker for patients with salvage intensity modulated radiation therapy for biochemical failure after radical prostatectomy. Oncotarget. 2016; 7:44224-44235. doi: 10.18632/oncotarget.10000.
2. Tabayoyong W, Abouassaly R. Prostate Cancer Screening and the Associated Controversy. Surg Clin North Am. 2015; 95: 1023-39.
3. Siegel R, Naishadham D, Jemal A. Cancer statistics, 2012. CA Cancer J Clin. 2012; 62: 10-29.
4. Allemani C, Weir HK, Carreira H, Harewood R, Spika D, Wang XS, Bannon F, Ahn JV, Johnson CJ, Bonaventure A, Marcos-Gragera R, Stiller C, Azevedo e Silva G, et al. Global surveillance of cancer survival 1995-2009: analysis of individual data for 25,676,887 patients from 279 population-based registries in 67 countries (CONCORD-2). Lancet. 2015; 385: 977-1010.
5. Miller DC, Hafez KS, Stewart A, Montie JE, Wei JT. Prostate carcinoma presentation, diagnosis, and staging: an update form the National Cancer Data Base. Cancer. 2003; 98: 1169-78.
6. Heidenreich A, Bastian PJ, Bellmunt J, Bolla M, Joniau S, van der Kwast T, Mason M, Matveev V, Wiegel T, Zattoni F, Mottet N, European Association of U. EAU guidelines on prostate cancer. part 1: screening, diagnosis, and local treatment with curative intent-update 2013. Eur Urol. 2014; 65: 124-37.
7. Carignan A, Roussy JF, Lapointe V, Valiquette L, Sabbagh R, Pepin J. Increasing risk of infectious complications after transrectal ultrasound-guided prostate biopsies: time to reassess antimicrobial prophylaxis? Eur Urol. 2012; 62: 453-9.
8. Zhu X, Albertsen PC, Andriole GL, Roobol MJ, Schroder FH, Vickers AJ. Risk-based prostate cancer screening. Eur Urol. 2012; 61: 652-61.
9. Gronberg H, Adolfsson J, Aly M, Nordstrom T, Wiklund P, Brandberg Y, Thompson J, Wiklund F, Lindberg J, Clements M, Egevad L, Eklund M. Prostate cancer screening in men aged 50-69 years (STHLM3): a prospective population-based diagnostic study. Lancet Oncol. 2015; 16: 1667-76.
10. Lilja H, Ulmert D, Vickers AJ. Prostate-specific antigen and prostate cancer: prediction, detection and monitoring. Nat Rev Cancer. 2008; 8: 268-78.
11. Tan LG, Tan YK, Tai BC, Tan KM, Gauhar V, Tiong HY, Hawkins RC, Thamboo TP, Hong FS, Chiong E. Prospective validation of %p2PSA and the Prostate Health Index, in prostate cancer detection in initial prostate biopsies of Asian men, with total PSA 4-10 ng ml -1. Asian J Androl. 2016.
12. Wang JY, Shen YJ, Liu XH, Zhang HL, Zhu Y, Ye DW, Yao XD, Zhang SL, Dai B, Zhou LP. [The value of diffusion-weighted MR imaging combined with transrectal ultrasound for transrectal prostate biopsy]. Zhonghua Wai Ke Za Zhi. 2012; 50: 35-8.
13. Benecchi L, Pieri AM, Melissari M, Potenzoni M, Pastizzaro CD. A novel nomogram to predict the probability of prostate cancer on repeat biopsy. J Urol. 2008; 180: 146-9.
14. Scattoni V, Lazzeri M, Lughezzani G, De Luca S, Passera R, Bollito E, Randone D, Abdollah F, Capitanio U, Larcher A, Lista G, Gadda GM, Bini V, et al. Head-to-head comparison of prostate health index and urinary PCA3 for predicting cancer at initial or repeat biopsy. J Urol. 2013; 190: 496-501.
15. Veltri RW. Serum marker %[-2]proPSA and the Prostate Health Index improve diagnostic accuracy for clinically relevant prostate cancer. BJU Int. 2016; 117: 12-3.
16. Neveu B, Jain P, Tetu B, Wu L, Fradet Y, Pouliot F. A PCA3 gene-based transcriptional amplification system targeting primary prostate cancer. Oncotarget. 2016; 7: 1300-10. doi: 10.18632/oncotarget.6360.
17. Chen R, Xie L, Xue W, Ye Z, Ma L, Gao X, Ren S, Wang F, Zhao L, Xu C, Sun Y, Chinese Prostate Cancer C. Development and external multicenter validation of Chinese Prostate Cancer Consortium prostate cancer risk calculator for initial prostate biopsy. Urol Oncol. 2016; 34: 416 e1-7.
18. Thompson IM, Ankerst DP, Chi C, Goodman PJ, Tangen CM, Lucia MS, Feng Z, Parnes HL, Coltman CA, Jr. Assessing prostate cancer risk: results from the Prostate Cancer Prevention Trial. J Natl Cancer Inst. 2006; 98: 529-34.
19. Yoon DK, Park JY, Yoon S, Park MS, Moon du G, Lee JG, Schroder FH. Can the prostate risk calculator based on Western population be applied to Asian population? Prostate. 2012; 72: 721-9.
20. Zhu Y, Wang JY, Shen YJ, Dai B, Ma CG, Xiao WJ, Lin GW, Yao XD, Zhang SL, Ye DW. External validation of the Prostate Cancer Prevention Trial and the European Randomized Study of Screening for Prostate Cancer risk calculators in a Chinese cohort. Asian J Androl. 2012; 14: 738-44.
21. Hokamp JA, Nabity MB. Renal biomarkers in domestic species. Vet Clin Pathol. 2016; 45: 28-56.
22. Liu S, Lu J, FU Q, Zhang H, Gao D, Liu Z. Total PSA, PSA density and biopsy Gleason score in predicting the pathologic stage of prostate cancer. National Journal of Andrology. 2010; 16: 415-9.