
INTRODUCTION
At the early developmental stage, prostate cancer usually requires a constant supply of androgens for the development. However, metastatic prostate cancer flourishes despite the lack of androgens in the bloodstream, creating castration-resistant prostate cancer (CRPC). CPRC is an advanced form of prostate cancer characterized by disease progression following surgical or pharmaceutical castration (androgen deprivation). Compared with castration-sensitive prostate cancer patients, the survival rate of CRPC patients is low and its treat mentsarealso urgently needed to be improved [1].Therefore, it’s very important to understand the mechanism of its development, such as the role of the critical genes regulating CRPC, to identify the effective therapeutic and diagnosis targets for the treatment of CRPC.
Gene expression and copy number profiling studies have identified recurrent gene fusions, chromosomal gains and losses, and deregulated pathways that drive prostate cancer progression to metastatic and lethal CRPC. These genomic changes include ETS gene family fusions, PTEN loss and androgen receptor (AR) amplification [2, 3]. Mutations of ETS gene family member, CHD1 and ETS2, were found in CRPC [3]. Recurrent mutationsin multiple chromatin- and histone-modifying genes, such as MLL2, were also identified in CRPC [3]. Mutation of AR collaborating factor FOXA1 repressed androgen signaling and increased tumor growth in CRPC. Other proteins, including ERG gene fusion product UTX (also known as KDM6A) and ASXL1, were mutated in CRPC and physically interacted with androgen receptor [3]. The mutation of N367T in 3β-hydroxysteroid dehydrogenase type 1 (3βHSD1) was observed in CRPC tumors and could enhanceihydrotestosterone (DHT) production in CRPC [4]. Despite those progresses, more efforts are needed to identify more promising targets for the treatment of CRPC.
In order to identify the target genes, which play important roles in the development of CRPC, we screened GEO and other related databases and mined relevant literatures through bioinformatic analyses. We identified PRKAR2B, a gene encoding cAMP-dependent protein kinase type II-beta regulatory subunit, to be an important oncogenic gene in CPRC. Knock-down of PRKAR2B in CRPC cells increased cell apoptosis and inhibited cell proliferation and invasion. The downstream genes and pathways of PRKAR2B in CRPC cells were identified by the whole genome transcriptomic and GO enrichment analyses. Therefore, we concluded thatPRKAR2B seemed to be a novel oncogenic gene involved CRPC development.
RESULTS
Identify the potential gene over expressing in CRPC through screening online databases
In order to identify the key novel genes regulating the development of CRPC, we screened the GEO databases and analyzed one of representative databases (Table 1). The comparisons of differentially changed gene expression in prostate cancer were made among human prostate cancer xenograft models in the stages of androgen-dependent growth (AD samples), castration-induced regression nadir (ND samples) and castration-resistant growth (CR samples) (Table 1). We performed two comparisons. One was performed between ND and AD samples (Comparison 1) and the other was analyzed between CR and ND samples (Comparison 2). Table 2 showed the distribution of differentially expressed genes (DEGs) in Comparison 1 and Table 3 showed the distribution of DEGs in Comparison 2. We analyzed 22300 probes and 12222 genes in both comparisons. In those comparisons, we used this criterion (|log(fold change)| >1 and p value < 0.05) to define the differentially changed genes to be statistically significant. In Comparison 1(ND vs AD), we identified 377 out of 12222 genes had significant changes (Table 2). Among those genes, 63 genes were up-regulated and 314 genes were down-regulated (Table 2). Comparison 1 (ND vs AD) was to identify those genes contributing the androgen-dependent prostate cancer development. In contrast, in Comparison 2(CR vs ND), only 112 genes were significantly changed, among which 91 genes were up-regulated and 21 genes were down-regulated (Table 3). Comparison 2 (CR vs ND) was to identify those genes contributing the castration-resistant prostate cancer development. However, those changed genes identified in Comparison 2 also included the androgen-dependent genes which might be induced during the CRPC development. To exclude those genes, we did the overlapping analysis between Comparisons 1 and 2 to specifically identify those genes only changed in the CRPC. Those genes only changed in Comparison 2 were regarded to be more important in CRPC development. We summarized DEGs regulation status in Comparison 1 and Comparison 2 in Table 4. We identified 72 up-regulated genes and 18 down-regulated genes exclusively in Comparison 2 but not in Comparison 1 ((log2(fold change) > 1 & adjusted p value < 0.05) (Table 5 and Table 6). Among those specifically dysregulated genes in castration-resistant samples, EP4 (PTGER4) was listed in our Table 5 and it’s a validated target for the treatment of castration-resistant prostate cancer [5]. By further combined Oncomine analysis of other database (Figure 1), we identified PRKAR2B as one of the potential target genes contributing to CRPC development. In detail, the expression of PRKAR2B was significantly increased in the prostate patients with hormone refractory (Figure 1A) [6], and elevated expression of PRKAR2B was also found in metastasized prostate tumors (Figure 1C–1D) compared to that in primary prostate tumors [7–9]. These evidences suggested that undefined function of PRKAR2B might play an important role in the development of CRPC.
Table 1: Comparisons of gene expression in prostate cancer were made among human prostate cancer xenograft in the stage of androgen-dependent growth (AD samples), castration-induced regression nadir (ND samples) and castration-resistant regrowth (CR samples) in GEO database
Title |
|||
|---|---|---|---|
Organism |
Homo sapiens |
||
GEO ID |
GSE21887 |
||
Sample Information |
|||
Data Contents |
Human prostate cancer xenograft in the stage of androgen-dependent growth (AD samples) |
Human prostate cancer xenograft in the stage of castration-induced regression nadir (ND samples) |
Human prostate cancer xenograft in the stage of castration-resistant regrowth (CR samples) |
GSM544229.CEL GSM544230.CEL GSM544231.CEL GSM544232.CEL |
GSM544233.CEL GSM544234.CEL GSM544235.CEL GSM544236.CEL |
GSM544237.CEL GSM544238.CEL GSM544239.CEL GSM544240.CEL |
|
Platform |
Affymetrix Human Genome U133 Plus 2.0 Array |
||
Table 2: Statistical distribution of DEGs in comparison 1 (The up or down level was obtained by comparing ND samples to AD samples)
Probe |
Gene |
|||
|---|---|---|---|---|
All |
22300 |
12222 |
||
|log2(fold change)| > 1 && |
491 |
81 (up) 410 (down) |
377 |
63 (up) 314 (down) |
Table 3: Statistical distribution of DEGs in comparison 2 (The up or down level was obtained by comparing CR samples to ND samples)
Probe |
Gene |
|||
|---|---|---|---|---|
All |
22300 |
12222 |
||
|log2(fold change)| > 1 && |
129 |
105 (up) 24 (down) |
112 |
91 (up) 21 (down) |
Table 4: DEGs regulation status in two comparisons (comparison 1 was between ND samples and AD samples, while comparison 2 was between CR samples and ND samples)
DEGs regulation status in comparison 1&2 |
Gene Count |
|
|---|---|---|
Commonly changed |
Commonly up-regulated |
0 |
Commonly down-regulated |
0 |
|
Changed only in comparison 1 |
Up in comparison 1 while no change in comparison 2 |
60 |
Down in comparison 1 while no change in comparison 2 |
295 |
|
Changed only in comparison 2 |
Up in comparison 2 while no change in comparison 1 |
72 |
Down in comparison 2 while no change in comparison 1 |
18 |
|
Others |
Up in comparison 1 while down in comparison 2 |
3 |
Down in comparison 1 while up in comparison 2 |
19 |
|
Table 5: 72 up-regulated genes only changed in comparison 2 (log2(fold change) > 1 && adjusted p value < 0.05)
Gene Symbol |
Log2(Fold Change) |
P Value |
Adjusted P Value |
Gene Symbol |
Log2(Fold Change) |
P Value |
Adjusted P Value |
|---|---|---|---|---|---|---|---|
GUCY1A2 |
6.94 |
3.17E–10 |
3.79E–06 |
TSPAN5 |
1.67 |
3.87E–05 |
2.07E–02 |
LINC00844 |
6.03 |
1.25E–04 |
3.42E–02 |
APBB2 |
1.67 |
4.39E–05 |
2.22E–02 |
GRIN3A |
5.65 |
1.68E–10 |
3.79E–06 |
HMGCS1 |
1.65 |
1.55E–04 |
3.57E–02 |
PTGER4 |
5.31 |
9.09E–05 |
2.99E–02 |
CASP4 |
1.62 |
5.73E–05 |
2.52E–02 |
LUM |
4.63 |
1.75E–04 |
3.78E–02 |
C2orf76 |
1.53 |
2.27E–04 |
4.19E–02 |
NPR3 |
4.27 |
7.19E–05 |
2.73E–02 |
WWC3 |
1.5 |
1.06E–04 |
3.16E–02 |
STXBP6 |
3.88 |
6.79E–05 |
2.66E–02 |
AQP3 |
1.47 |
3.08E–04 |
4.82E–02 |
NR5A2 |
3.41 |
9.43E–07 |
2.86E–03 |
PARP9 |
1.46 |
7.36E–05 |
2.75E–02 |
GABRA1 |
3.33 |
2.36E–04 |
4.21E–02 |
PPAP2A |
1.45 |
3.26E–04 |
4.87E–02 |
NUDT11 |
3.25 |
2.93E–06 |
5.01E–03 |
STX19 |
1.43 |
1.17E–05 |
1.09E–02 |
ADAM7 |
3.25 |
6.20E–07 |
2.12E–03 |
EIF4E3 |
1.42 |
1.19E–05 |
1.09E–02 |
SHISA9 |
3.08 |
1.20E–07 |
6.55E–04 |
ZFY |
1.4 |
3.34E–04 |
4.87E–02 |
CCDC68 |
3.06 |
1.46E–07 |
6.63E–04 |
NEDD4L |
1.39 |
3.47E–04 |
4.89E–02 |
PRR16 |
3 |
9.53E–05 |
3.04E–02 |
MTHFD2L |
1.37 |
1.99E–05 |
1.47E–02 |
NLGN1 |
2.92 |
2.17E–04 |
4.18E–02 |
RIT1 |
1.3 |
3.55E–04 |
4.92E–02 |
PCDHB6 |
2.84 |
2.95E–04 |
4.71E–02 |
SRPK2 |
1.26 |
1.96E–04 |
3.87E–02 |
PRKAR2B |
2.63 |
1.28E–05 |
1.09E–02 |
GABARAPL1 |
1.22 |
2.95E–04 |
4.71E–02 |
PPP1R3D |
2.51 |
1.43E–04 |
3.51E–02 |
CEP192 |
1.19 |
1.80E–05 |
1.40E–02 |
ERO1LB |
2.49 |
5.89E–06 |
8.94E–03 |
TLE4 |
1.19 |
1.43E–04 |
3.51E–02 |
KATNAL1 |
2.39 |
3.41E–04 |
4.87E–02 |
TMEM87A |
1.18 |
3.64E–05 |
2.03E–02 |
SYTL4 |
2.36 |
1.81E–04 |
3.78E–02 |
SLC44A2 |
1.15 |
3.16E–04 |
4.85E–02 |
PKIB |
2.34 |
8.16E–06 |
9.42E–03 |
ELF4 |
1.15 |
3.39E–04 |
4.87E–02 |
ZDHHC14 |
2.24 |
6.12E–05 |
2.65E–02 |
CDC42SE2 |
1.13 |
3.37E–04 |
4.87E–02 |
PTPRJ |
2.23 |
4.49E–05 |
2.23E–02 |
OSTM1 |
1.11 |
3.09E–04 |
4.82E–02 |
RERG |
2.18 |
1.45E–05 |
1.20E–02 |
KCTD16 |
1.09 |
1.23E–04 |
3.40E–02 |
FAM105A |
2.06 |
1.67E–04 |
3.78E–02 |
PTPRK |
1.08 |
1.31E–04 |
3.42E–02 |
ST8SIA1 |
2 |
2.92E–05 |
1.80E–02 |
BMPR2 |
1.08 |
9.59E–05 |
3.04E–02 |
COBLL1 |
1.94 |
1.46E–04 |
3.54E–02 |
JKAMP |
1.07 |
3.28E–04 |
4.87E–02 |
MIA2 |
1.86 |
2.69E–04 |
4.51E–02 |
EIF1AY |
1.07 |
3.40E–04 |
4.87E–02 |
FAM49A |
1.82 |
7.42E–06 |
9.42E–03 |
FAM115A |
1.06 |
3.13E–04 |
4.85E–02 |
ZNF697 |
1.81 |
2.60E–05 |
1.69E–02 |
CREM |
1.06 |
1.81E–04 |
3.78E–02 |
ZNF124 |
1.79 |
2.08E–05 |
1.49E–02 |
JADE1 |
1.04 |
6.44E–05 |
2.66E–02 |
FBXO6 |
1.76 |
2.25E–04 |
4.19E–02 |
SAE1 |
1.04 |
3.41E–04 |
4.87E–02 |
GLYATL2 |
1.76 |
8.12E–05 |
2.91E–02 |
SHANK2 |
1.03 |
1.33E–04 |
3.42E–02 |
RND3 |
1.74 |
2.08E–04 |
4.06E–02 |
ZMIZ1 |
1.02 |
3.20E–04 |
4.87E–02 |
ZNF275 |
1.7 |
5.03E–05 |
2.37E–02 |
UPP1 |
1.01 |
1.26E–05 |
1.09E–02 |
Table 6: 18 down-regulated genes only changed in comparison (log2(fold change) < −1 && adjusted p value < 0.05)
Gene Symbol |
Log2 (Fold Change) |
P Value |
Adjusted P Value |
|---|---|---|---|
ACADVL |
−1.10 |
3.52E–05 |
2.03E–02 |
ACSM3 |
−1.34 |
2.63E–04 |
4.49E–02 |
BEND4 |
−3.12 |
3.71E–04 |
5.00E–02 |
CGN |
−1.45 |
2.25E–04 |
4.19E–02 |
DCUN1D1 |
−1.23 |
1.31E–04 |
3.42E–02 |
EFNB2 |
−3.63 |
2.20E–04 |
4.18E–02 |
FAM120A |
−1.31 |
1.11E–04 |
3.22E–02 |
ISYNA1 |
−1.75 |
2.52E–05 |
1.68E–02 |
LSM12 |
−2.10 |
2.96E–05 |
1.80E–02 |
MAPT-AS1 |
−1.01 |
1.31E–04 |
3.42E–02 |
MTMR11 |
−1.26 |
1.28E–04 |
3.42E–02 |
NTM |
−1.10 |
2.76E–04 |
4.56E–02 |
PON2 |
−1.13 |
2.56E–04 |
4.44E–02 |
RBM39 |
−1.02 |
8.87E–05 |
2.99E–02 |
SCUBE2 |
−4.38 |
1.13E–04 |
3.23E–02 |
TMEM184A |
−1.56 |
4.87E–05 |
2.33E–02 |
WASL |
−1.64 |
6.70E–05 |
2.66E–02 |
ZNF385B |
−2.39 |
1.74E–04 |
3.78E–02 |
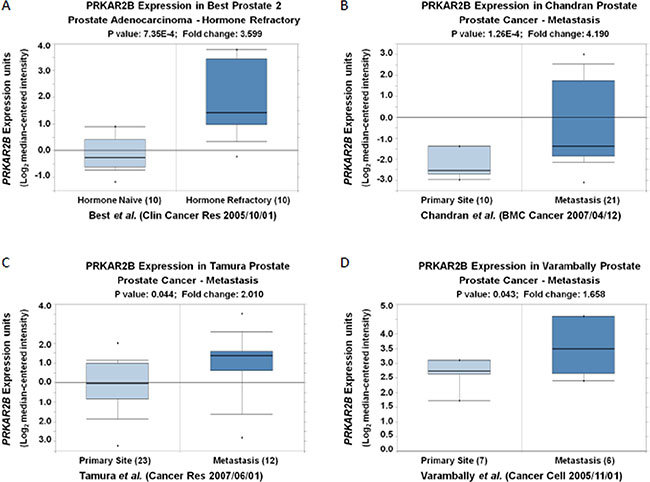
Figure 1: The mRNA expression of PRKAR2B is increased in the patients with hormone refractory and/or metastatic prostate tumors compared to that in controls. (A) Oncomine analysis show that the expression of PRKAR2B (Log2 median-centered intensity) in hormone naïve prostate adenocarcinoma and hormone refractory prostate adenocarnoma (P < 0.001). (B–D) Oncomine analysis show that the expression of PRKAR2B (Log2 median-centered intensity) in prostate tumor tissue from primary site and metastatic site (P < 0.05).
PRKAR2B promotes CRPC cell growth, invasion and survival
To investigate the expression of PRKAR2B in prostate cancer cells, we examined PRKAR2B expression by real-time PCR for RNA expression and by western blot for protein expression in four prostate cancer cell lines,DU-145, PC-3,22RV1 and LNCaP. DU-145, PC-3 and 22RV1 are castration resistant prostate cancer cell lines and LNCaP is castration sensitive prostate cancer cell line which is sensitive to castration [10, 11]. Figure 2 showed that DU-145 and PC-3 has higher expression of PRKAR2B than22RV1 and LNCaP (Figure 2A and 2B). The castration sensitive prostate cancer cell line, LNCap, had the lowest expression of PRKAR2B among the four cell lines(Figure 2A and 2B).
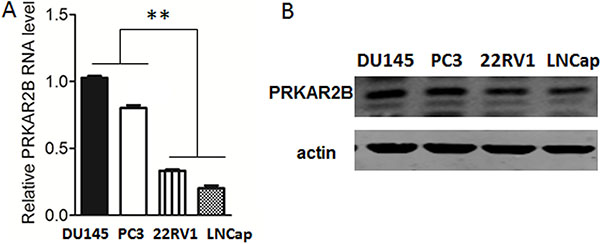
Figure 2: Expression of PRKAR2B in prostate cancer cell lines. (A) The mRNA expression level of PRKAR2B in DU145, PC3, 22RV1 and LNCap cells was detected by Real-Time qPCR. (B) The protein expression level of PRKAR2B in DU145, PC3, 22RV1 and LNCap cells was detected by western-blot, and β-actin was the internal loading control (**P < 0.01).
To investigate the function of PRKAR2B in these prostate cancer cell lines, we knock-downed PRKAR2B in DU-145and PC-3using siRNA and observed cell proliferations of both cell lines were inhibited by the knock-down of PRKAR2B (Figure 3A and 3B). Over expression of PRKAR2B in 22RV1 through PRKAR2B plasmid transfection promoted cell proliferation without androgen supplementation. Interestingly, over expression of PRKAR2B in LNCaP also increased cell proliferation but it’s not significant as that in 22RV1 (Figure 3C and 3D). Meanwhile, knock-down of PRKAR2B expression in LNCaP did not significantly change cell proliferation though there’s a decreased trend (Supplementary Figure S1B). These results suggested that PRKAR2B had more effect to regulate cell proliferation in castration-resistant prostate cancer cell compared to that in castration-sensitive prostate cancer cell.
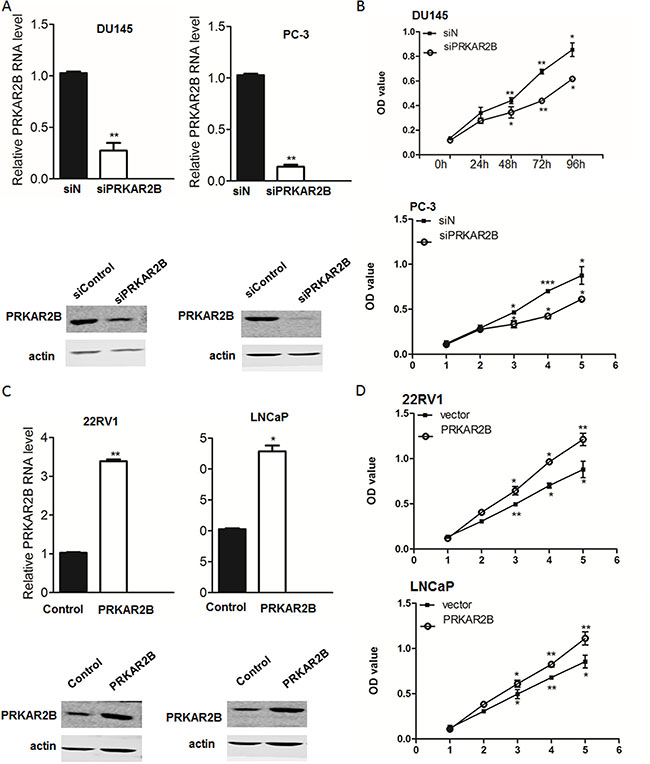
Figure 3: PRKAR2B promotes CRPC cell proliferation. (A) The mRNA and protein expression level of PRKAR2B was examined by Real-Time qPCR (bar graph) and western blot, respectively, in DU145 and PC3 cells with or without PRKAR2B knockdown. (B) MTT assay shows cell viability of DU145 cells (upper panel) and PC3 cells (lower panel) withor without PRKAR2Bknockdown. OD value at 570nmwas tested at 0 h, 24 h, 48 h, 72 h and 96 h after siRNA transfection. siN: negative control siRNA;siPRKAR2B: PRKAR2B siRNA. (C) The mRNA and protein expression level of PRKAR2B was examined by Real-Time qPCR (bar graph) and western blot, respectively, in 22RV1 and LNCap cells after transfection of PRKAR2B plasmid for 48 hours. (D) MTT assay showed cell proliferation of 22RV1 cells(upper panel) and LNCap cells(lower panel) with or without PRKAR2B plasmid transfection. OD value at 570nmwas tested at 0 h, 24 h, 48 h, 72 h and 96 h after plasmid transfection (*P < 0.05; **P < 0.01; ***P < 0.001).
The function of PRKAR2Bin regulating cell invasion was also investigated in DU-145 and 22RV1 cells. Knock-down of PRKAR2B expression through siRNA in DU-145 cell impaired DU-145 cell invasion capability (Figure 4A) and over-expression of PRKAR2B through PRKAR2B plasmid transfection in 22RV1 enhanced cell invasion capability (Figure 4B). However, knock-down of PRKAR2B expression through siRNA in LNCaP did not significantly alter cell invasion capability (Supplementary Figure S1C), indicating that PRKAR2B plays more oncogenic roles, such as cell invasion, in castration-resistant prostate cancer cell compared to that in castration-sensitive prostate cancer cell.
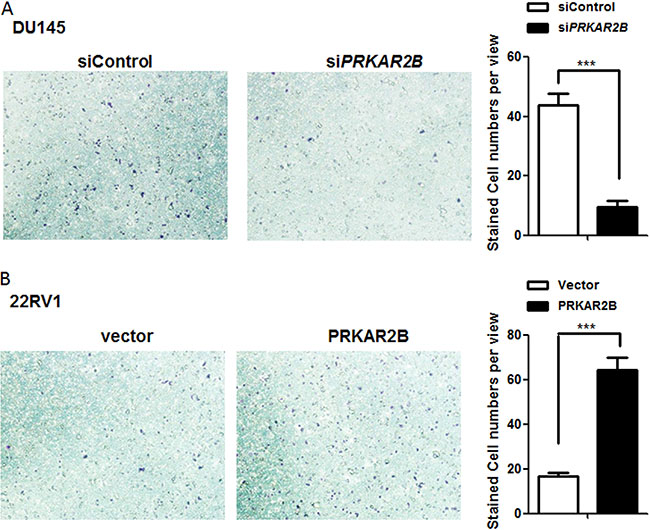
Figure 4: PRKAR2B promotes CRPC cell invasion. (A) DU145 cell invasion ability was examined by invasion chamber assay after transfection of PRKAR2B siRNA for 48 hours. The bar graph shows the average number of the invaded cells per field. (B) Cell invasion ability of 22RV1 was examined by invasion chamber assay after transfection of PRKAR2B plasmid for 48 hours. The bar graph shows the average number of the invaded cells per field(***P < 0.001).
Furthermore, knock-down of PRKAR2B in DU-145 cell using siRNA increased the expression of cleaved PARP (Figure 5A, left panel), a cell apoptosis marker, indicating PRKAR2B is required for prostate cancer cell survival and knockdown of PRKAR2B expression will induce cell apoptosis. Cisplatin is a common drug for the chemotherapy treatment of diverse cancers, including prostate cancer, and also can induce cell apoptosis [12–15]. We observed that knock-down of PRKAR2B expression in DU-145 sensitized the cell to cisplatin induced cell apoptosis, indicated by the increased PARP cleavage (Figure 5A, right panel), suggestingPRKAR2B cause the anti-apoptosis of CRPC cells under the treatment of cisplatin. In consistent with this results, over expression of PRKAR2B in 22RV1decreased cell apoptosis caused by cisplatin treatment (Figure 5B, right panel) though this effect was hard to observe without cisplatin (Figure 5B, left panel).
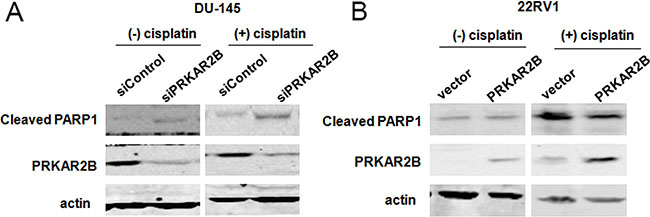
Figure 5: PRKAR2B plays the role of anti-apoptosis in CRPC cells. (A) DU145 cell was transfected with PRKAR2B siRNA for 48 hours, and then treated with DMSO (left panel) or 10 μM cisplatin (right panel) for 24 hours. The protein expression of PRKAR2B and cleaved PARP1 were examined through western blot. Actin was the internal loading control. (B) 22RV1 cells was transfected with PRKAR2B plasmid for 48 hours, and then treated with 10 μM cisplatin for 24 hours. The protein expression of PRKAR2B and cleaved PARP1 were examined through western blot. Actin was the internal loading control.
Taken together, PRKAR2B promotes cell proliferation, invasion and survival in castration-resistant prostate cancer cells.
Whole genome transcriptomic analysis of the target genes of PRKAR2B in CRPC cells
To investigate the mechanism how PRKAR2B regulates CRPC, we knock-downed PRKAR2B in DU-145 cells, and then performed the RNA-SEQ to examine the whole genomic gene expression profile after inhibition of PRKAR2B. We identified 385 genes which were significantly changed after knock-down of PRKAR2B in DU145 cells (Figure 6A). GO biological process analysis indicated that those genes were significantly involved in mitotic cell cycle, cell cycle, mitotic cell cycle process, cell cycle process, mitotic nuclear division, nuclear division, cell division, organelle fission, single-organism cellular process and cell cycle phase transition (Figure 6B). KEGG pathway analysis also showed those genes mainly participated in regulation of cell cycle and DNA replication signaling pathways (Figure 6C). These results indicated there’sastrong correlation between PRKAR2B and cell cycle and cell proliferation processes.
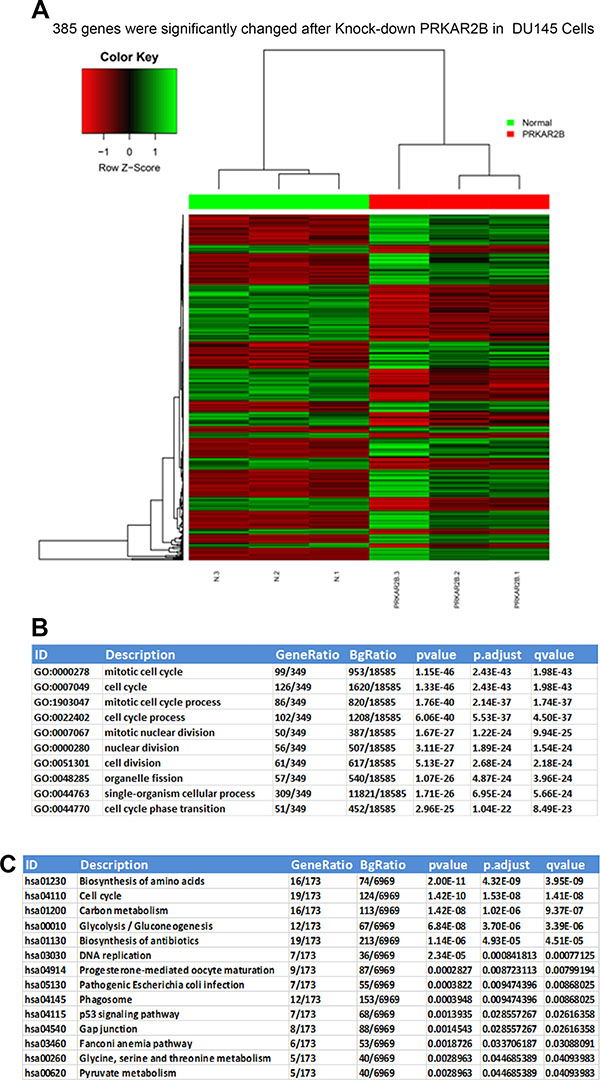
Figure 6: Whole genome transcriptome and pathway analyses of significantly and differentially changed genes regulated by PRKAR2B in DU145 cells. (A) Heat-map of RNA-SEQ shows that385 genes were significantly changed in DU145 cells after knockdown of PRKAR2B expression. (B and C)The summary of top 10 changed biological processes or pathways after knock-down of PRKAR2B in DU145 cells by using GO biological process analysis (B) and KEGG pathway analysis (C).
Identify key downstream genes involved in PRKAR2B signaling pathway
To determine the key cell cycle genes regulated by PRKAR2B in CRPC cells, we further analyzed those significantly changed genes related to cell cycle in Figure 6B. We extracted those cell cycle genes (Figure 7A) and Table 7, and then performed the network analysis on these significantly changed genes (Figure 7B). We chose some hub genes, which had more connections to other genes in the whole network, such as CCNB1MCM2, PLK1 and AURKB, to validate their mRNA expression changes after knock-down of PRKAR2B. In DU145 cells, the expression of those target genes, CCNB1MCM2, PLK1 and AURKB, were decreased after knock-down of PRKAR2B usingsiRNA (Figure 8A). Meanwhile, over expression of PRKAR2B in 22RV1 cells led to the increased expressions of CCNB1, MCM2, PLK1 and AURKB (Figure 8B). Notably, in the same prostate cancer patient databases as those in Figure 1, the higher mRNA expression of CCNB1 was observed in the patients with hormone refractory compared to that in the patients having hormone naïve prostate cancer (Figure 9A), and the mRNA expression levels of CCNB1 (Figure 9B), MCM2 (Figure 9C and 9D), PLK1 (Figure 9E and 9F) and AURKB (Figure 9G and 9H) were also increased in patients with metastatic prostate tumors compared to those in patients with primary prostate tumors. These results indicate that those hub genes might be the key downstream genes for PRKAR2B to regulate the development of CRPC.
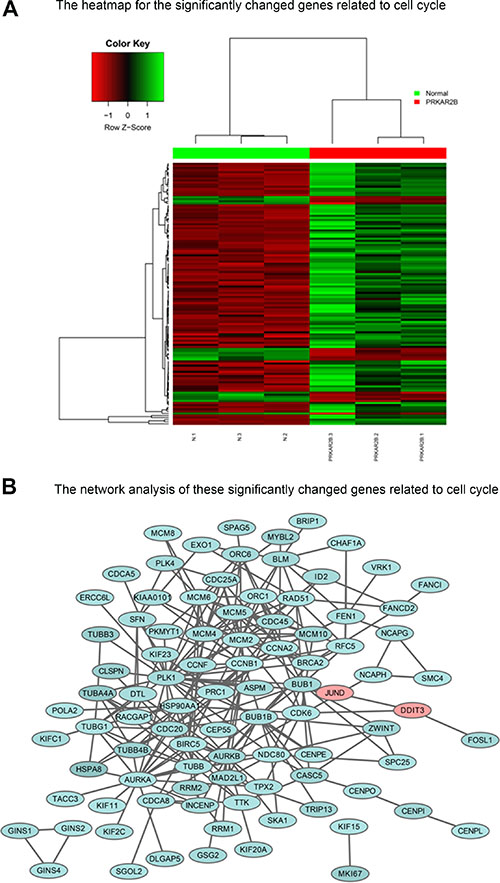
Figure 7: The cell cycle genes regulated by PRKAR2B in DU145 cells. (A) Heat-map of the significantly and differentially changed cell cycle genes in DU145 cells after knock-down of PRKAR2B. (B) Network analysis of the significantly and differentially changed cell cycle genes DU145 cells after knock-down of PRKAR2B.
Table 7: GO pathways consisted of significantly and differentially changed cell cycle genes in DU145 cells after knock-down of PRKAR2B (p value < 0.01)
ID |
Description |
P value |
Adjust p value |
|---|---|---|---|
GO:0000278 |
mitotic cell cycle |
1.15E-46 |
2.43E-43 |
GO:0007049 |
cell cycle |
1.33E-46 |
2.43E-43 |
GO:1903047 |
mitotic cell cycle process |
1.76E-40 |
2.14E-37 |
GO:0022402 |
cell cycle process |
6.06E-40 |
5.53E-37 |
GO:0007067 |
mitotic nuclear division |
1.67E-27 |
1.22E-24 |
GO:0000280 |
nuclear division |
3.11E-27 |
1.89E-24 |
GO:0051301 |
cell division |
5.13E-27 |
2.68E-24 |
GO:0048285 |
organelle fission |
1.07E-26 |
4.87E-24 |
GO:0044763 |
single-organism cellular process |
1.71E-26 |
6.95E-24 |
GO:0044770 |
cell cycle phase transition |
2.96E-25 |
1.04E-22 |
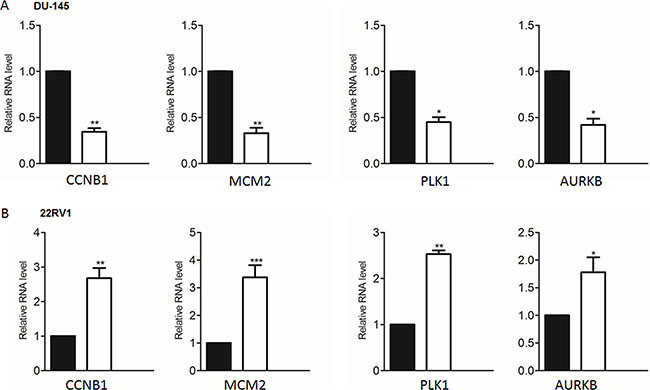
Figure 8: Validate the representative cell cycle genes regulated by PRKAR2B in castration-resistant prostate cancer cell lines. (A) Real-Time qPCR was used to examine the expression levels of four cell cycle genes in DU145 cells after knock-down of PRKAR2B. (B) Real-Time qPCR was performed to examine the expression levels of four cell cycle genes in 22RV1 cells after overexpression of PRKAR2B by transfection of its plasmid (*P < 0.05; **P < 0.01; ***P < 0.001).
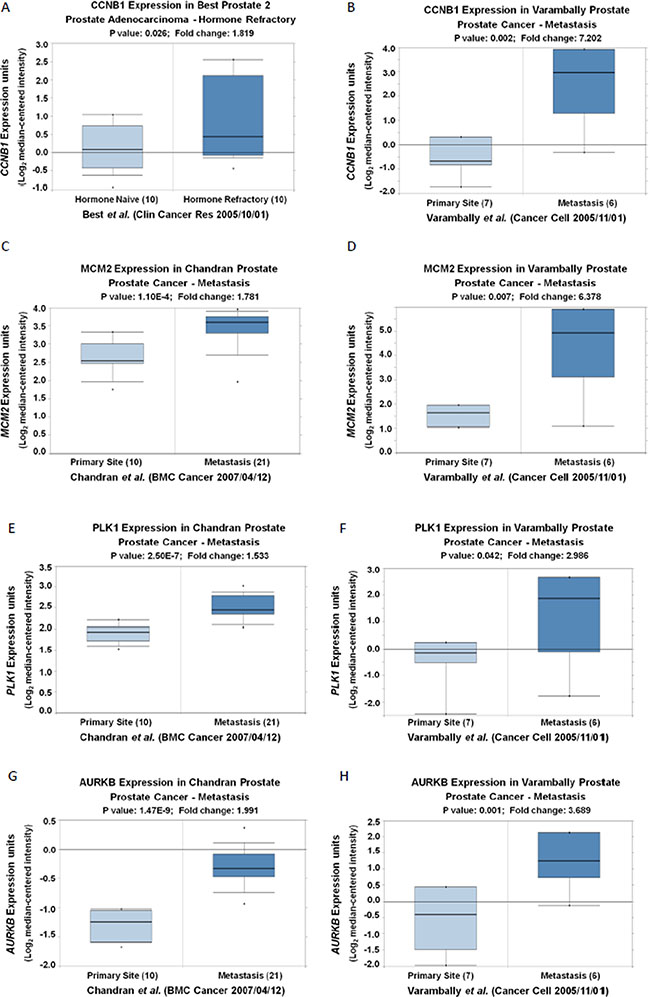
Figure 9: The mRNA expression levels of CCNB1, MCM2, PLK1 and AURKB are increased in patients with hormone refractory and/or metastatic prostate tumors compared to those in controls. (A) Oncomine analysis show that the expression of CCNB1 (Log2 median-centered intensity) in hormone naïve prostate adenocarcinoma and hormone refractory prostate adenocarnoma (P < 0.05). (B–H) Oncomine analysis show that the expression of CCNB1 (B), MCM2 (C and D), PLK1 (E and F) and AURKB (G and H) (Log2 median-centered intensity) in prostate tumor tissues from primary site and metastatic site (P < 0.05).
DISCUSSION
Castration-resistant prostate cancer (CRPC) is a lethal form of prostate cancer that arises when tumors develop resistance to hormonal therapies. Genomic aberrations drive the acquisition of castration-resistant in CRPC. By analysis of GEO and other databases, we identified that PRKAR2B was anovel gene over-expressing in CRPC and showed that it promotedcell proliferation, invasion and survival. The whole genome transcriptomic analysis of the knock-down of PRKAR2B in CRPC cells showed that PRKAR2B mainly modulates cell cycle gene expression in CRPC, such as CCNB1, MCM2, PLK1 and AURKB. Our study firstly revealed the undefined function of PRKAR2B in CRPC and provided a promising target gene for further study in treatment of CRPC.
cAMP is an important molecule for a variety of cellular functions. cAMP exerts its effects by activating the cAMP-dependent protein kinase (PKA), which transduces the signal through phosphorylation of different target proteins. PKA is a holoenzyme that is formed by 2 regulatory subunits, type I (R1A and R1B) and type II (R2A and R2B), and 4 catalytic subunits (Cα, Cβ, Cγ, and Cx). The PKA R1A and R2B proteins are the most abundant regulatory subunits of PKA in endocrine tissues.PRKAR2B is the gene encoding PKA type II-beta regulatory subunit(R2B). In adrenocortical human cell line, inactivation of PRKAR2B enhanced cell proliferation and reduced apoptosis [16]. Activation of PKAR2B by selective cAMP analogs alters the growth of adrenocortical cells [17]. A dramatic decrease in PKAR2B protein levels is observed in a subset of adrenocortical adenomas, however, its function is not clear [18]. In contrast to the tumor suppressive function in adrenocortical cells, PKAR2B expression is up-regulated in hormone refractory prostate cancer patients as well as in metastasized prostate tumors [7, 19, 20]. Here, we showed that knockdown of PRKAR2B in CRPC cell line impaired cell survival and invasion, the topaffected biological process is cell cycle progression and also identified that CCNB1, MCM2, PLK1 and AURKB were down-regulated by knock-down of PRKAR2B. Those genes are all critical elements for cell proliferation and mitosis. CyclinB 1 encoded by CCNB1 is a regulatory protein involved in mitosis. Silencing of cyclin B1 in tumor cells increases susceptibility to taxol and leads to growth arrest in vivo [21]. MCM2 belongs to the minichromosome maintenance protein family and plays a major role in DNA replication during the G1-phase of the cell cycle. MCM2 can serve as a cell proliferation marker to differentiate normal and cancer cells [22, 23]. PLK1 is implicated in the dynamic function of the mitotic spindle during chromosome segregation, supporting the functional maturation of the centrosome in late G2/early prophaseand establishment of the bipolar spindle [24, 25]. PLK1 activates Cdc2/cyclin B complex via phosphorylation and activation of Cdc25C and is an early trigger for G2/M transition [26]. Cancer cells depends on PLK1 for survival more than normal cells [27]. Aurora kinases B encoded by AURKB is associate with microtubules during chromosome movement and segregation [28]. Abnormally elevated levels of Aurora B kinase in cancerous cells cause unequal chromosomal separation resulting in formation of cells with abnormal numbers of chromosomes [29]. Regulation of those critical genes of cell cycle progression indicates the important function of PRKAR2B in CRPC.
Although we identified PRKAR2B from CRPC mouse models, and verified its expression in online CRPC patient databases and investigated its function in CRPC cells, some following studies should be performed in the future, such as in vivo functional studies and the large scale examination of its expression in CRPC patients.
In summary, we identified that PRKAR2B over expressed in CRPC mouse models and patients, and showed it promoted CRPC cell proliferation, invasion and survival by mainly modulates cell cycle gene expression. Therefore, we conclude that PRKAR2B is a novel oncogenic gene in CRPC, which sheds light on elucidating PRKAR2B function in CRPC and suggest PRKAR2B to be a promising target for future study and treatment of CRPC.
MATERIALS AND METHODS
Cell lines and reagents
PC-3,DU-145 and 22RV1 are androgen-independent (castration-resistant) human prostate cancer (Pca) cell lines derived from metastatic sites. LNCaP are androgen-dependent (castration-sensitive) human prostate cancer (Pca) cell line. All the cells are cultured in RPMI1640 supplemented with 10% fetal bovine serum (FBS), 2 mmol/l glutamine, 100units/mL penicillin and 100 μg/mL streptomycin and cultured in a humidified atmosphere of 95% air and 5% CO2 at 37°C.
Antibody directed against totalPRKAR2B was purchased from Thermofisher (Cat. PA5-13799), and antibody directed against Cleaved PARP1 (Cat. 9541S) was purchased from Cell signaling, and Antibody directed against Beta-Actinwas purchased from Sigma (Cat. A2228)
siRNA interference
PRKAR2BSMART pool (Cat. L-009152-00-0005) was purchased from Dharmacon/Thermo Fisher Scientific. Transfection of the siRNA oligonucleotide duplexes was performed in a 6-well plate (1 × 10⁵cells per well) with Lipofectamine 2000 (Invitrogen, Inc.), using the methods recommended by the manufacturer. Knockdown of PRKAR2B with siRNA was examined after siRNA transfection through western blotting and real-time PCR.
MTT
Cells were cultured in 24-well plates with 0.5 ml medium per well at 37°C. After transient transfection of the cells with PRKAR2B siRNA SMART pool or control siRNA for 24 h,48 h, 72 h and 96 h, the cells were added 50 μL/well of 10 mg/mL 3-(4,5-dimethyl-thiazol-2-yl)-2,5-diphenyltetrazolium bromide (MTT) and incubated for an additional 2 h at 37°C. The supernatant was aspirated, and the MTT formazan crystals formed by the cells were dissolved in 500 ul of DMSO. The absorbance was measured at a wavelength of 570nmby a microplate reader [30].
Western blot
Cells were lysed in a lysis buffer containing 50 mmol/L TRIS-HCl, pH7.4, 150 mmol/L NaCl, 0.5% NP40, 50 mmol/L NaF, 1 mmol/L Na3VO4, 1 mmol/L phenyl-methylsulfonyl fluoride, 25 μg/mL leupeptin, and 25 μg/Ml aprotinin and clarified by centrifugation (14,000 g for 30 min at 4°C). The protein concentration of the cell lysates was determined using the Bradford Coomassie blue method (Pierce Chemical Corp.). Whole-cell lysates were separated by sodium dodecyl sulfate (SDS)-PAGE and transferred onto nitrocellulose membrane. The membranes were blocked with PBS containing 5% (w/v) skim milk at 4°C for 2 h, washed with PBST(PBS with 0.05% Tween-20), and then incubated overnight with primary antibody. After washed with PBST, the membrane was incubated with second antibody at room temperature for 2 h, washed with PBST and then developed with the ECL system. The results of Western blot were analyzed with Odyssey software version 3.0.
RNA sequencing and differentially expressed genes (DEGs) analysis
DU-145 cell lines with or without PRKAR2B knockdown were subjected to RNA sequencing. RNA sequencing tags were mapped to the human (Homo sapiens) genome (version hg19) using TopHat [31], then the expression abundance (FPKM) value of each gene was estimated by running cufflinks [32] and the differential expressed genes were assessed by cuffdiff. Statistically differentially expressed genes between two groups were those genes with |fold change| > 2 and adjusted p value < 0.01. The adjusted p value was obtained through applying Benjamini and Hochberg’s (BH) false discovery rate correction on the original p value, and fold change threshold was selected based on our purpose of focusing on significantly differentially expressed genes.
Hierarchical clustering
Hierarchical clustering was conducted [33] to classify analyzed samples based on gene expression profiles. Hierarchical clustering using differentially expressed genes (DEGs) demonstrated the global gene expression patterns in the samples. In addition, the DEGs were further extracted and classified in specific biological processes (Gene Ontology terms) and KEGG pathways. The expression pattern of those DEGs was characterized and heat maps of the DEGs were classified in targeted biological processes or KEGG pathways using R package.
Go and kegg pathway analysis
We utilized R packages–GO.db, KEGG.db and KEGGREST to detect Gene Ontology categories and KEGG pathways with significant enrichment in DEGs comparing to which across all measured genes. The significantly enriched biological processes were identified as p value less than threshold value 0.01. As to KEGG pathway, p value was set to less than 0.05.
Real-time qPCR
The mRNA abundances of cell cycle related genes were determined by quantitative real-time PCR assays. The ΔΔCt method of relative quantification and SYBR Green chemistry were used, and β -actin was used as an endogenous control for normalization.
PCR primer sets were designed using Primer Premier 5, and the sequences were as follows: PRKAR2B, 5- TT CGGCGAACTGGCCTTAATG -3 (forward) and 5- ACT TTCAGGCGTTCAGAAAACT -3 (reverse); MCM2, 5 - A TGGCGGAATCATCGGAATCC -3 (forward) and 5 -GGT GAGGGCATCAGTACGC -3 (reverse); AURKB, 5 - CAG TGGGACACCCGACATC-3 (forward) and 5 - GTACACG TTTCCAAACTTGCC -3 (reverse); PLK1, 5 -AAAGAG ATCCCGGAGGTCCTA-3 (forward) and 5 -GGCTGCG GTGAATGGATATTTC-3 (reverse); CCNB1, 5 - AATAAG GCGAAGATCAACATGGC -3 (forward) and 5 - TTTGTT ACCAATGTCCCCAAGAG -3 (reverse);β-actin, 5 - CGTC ATACTCCTGCTTGCTG -3 (forward) and 5 - GTACG CCAACACAGTGCTG.-3 (reverse).
Cell invasion assay
Cell invasion potential was measured with a Boyden transwell chamber consisting of upper inserts with 8-μm-pore-size filter membranes at the bottom of the inserts and lower wells in 24-well cell culture plates (Corning Life Sciences). Add 20 μl of 1:6 diluted Matrigel (2–3 mg/ml protein) to the center of each cell well inserts. Place coated inserts in incubator to allow the Matrigel to solidify for 20–30 min. Cells (3.5 × 10⁵ cells in 0.2 mL) suspended in serum-free medium with 0.1% bovine serum albumin were seeded into the inserts of the chambers. The inserts were then placed over the wells filled with 0.5 mL 10% FBS culture medium and incubated in a 37°C incubator for 16 h. Cells that had not penetrated the filter membrane in the inserts were wiped off with cotton swabs, and the cells on the underside of the filter membrane were fixed and stained with the HEMA-3 kit (Fisher Diagnostics). Invaded cells were counted in total 10 fields for each sample under microscope with 10X objective and stained cell number per field was calculated [34].
ACKNOWLEDGMENTS AND FUNDING
This study was supported by National Natural Science Foundation of China (81572536, 81672850), Science and Technology Commission of Shanghai Municipality (14140901700, 16411969800,15ZR1425500), the Joint Research Foundation for Innovative Medical Technology of Shanghai Shenkang Hospital Development Center (SHDC12015125), Shanghai Municipal Education Commission (15ZZ058), Shanghai Municipal Commission of Health and Family Planning (201640247), Shanghai Municipal Education Commission-Gaofeng Clinical Medicine Grant Support (20152215), Key Disciplines Group Construction Project of Pudong Health Bureau of Shanghai (PWZxq2014-05), Innovation Fund for Translational Research of Shanghai Jiao Tong University School of Medicine (15ZH4002), and Incubating Program for clinical Research and Innovation of Renji Hospital Shanghai Jiao Tong University School of Medicine (PYZY16-008, PYXJS16-015 ).
CONFLICTS OF INTEREST
None.
REFERENCES
1. Crawford ED, Petrylak D. Castration-resistant prostate cancer: descriptive yet pejorative? J Clin Oncol. 28:p. e408.
2. Shen MM, Abate-Shen C. Molecular genetics of prostate cancer: new prospects for old challenges. Genes Dev. 24:p. 1967–2000
3. Grasso CS, Wu YM, Robinson DR, Cao X, Dhanasekaran SM, Khan AP, Quist MJ, Jing X, Lonigro RJ, Brenner JC, Asangani IA, Ateeq B, Chun SY, et al. The mutational landscape of lethal castration-resistant prostate cancer. Nature. 487:p. 239–43.
4. Chang KH, Li R, Kuri B, Lotan Y, Roehrborn CG, Liu J, Vessella R, Nelson PS, Kapur P, Guo X, Mirzaei H, Auchus RJ. Sharifi N. A gain-of-function mutation in DHT synthesis in castration-resistant prostate cancer. Cell. 154:p. 1074–84.
5. Terada N, Shimizu Y, Kamba T, Inoue T, Maeno A, Kobayashi T, Nakamura E, Kamoto T, Kanaji T, Maruyama T, Mikami Y, Toda Y, Matsuoka T, et al. Identification of EP4 as a potential target for the treatment of castration-resistant prostate cancer using a novel xenograft model. Cancer Res. 2010; 70:p. 1606–15.
6. Best CJ, Gillespie JW, Yi Y, Chandramouli GV, Perlmutter MA, Gathright Y, Erickson HS, Georgevich L, Tangrea MA, Duray PH, Gonzalez S, Velasco A, Linehan WM, et al. Molecular alterations in primary prostate cancer after androgen ablation therapy. Clin Cancer Res. 2005; 11:p. 6823–34.
7. Chandran UR, Ma C, Dhir R, Bisceglia M, M. Lyons-Weiler, Liang W, Michalopoulos G, Becich M, Monzon FA. Gene expression profiles of prostate cancer reveal involvement of multiple molecular pathways in the metastatic process. BMC Cancer. 2007; 7:p. 64.
8. Tamura K, Furihata M, Tsunoda T, Ashida S, Takata R, Obara W, Yoshioka H, Daigo Y, Nasu Y, Kumon H, Konaka H, Namiki M, Tozawa K, et al. Molecular features of hormone-refractory prostate cancer cells by genome-wide gene expression profiles. Cancer Res. 2007; 67:p. 5117–25.
9. Varambally S, Yu J, Laxman B, Rhodes DR, Mehra R, Tomlins SA, Shah RB, Chandran U, Monzon FA, Becich MJ, Wei JT, Pienta KJ, Ghosh D, et al. Integrative genomic and proteomic analysis of prostate cancer reveals signatures of metastatic progression. Cancer Cell. 2005; 8:p. 393–406.
10. Kregel S, Chen JL, Tom W, Krishnan V, Kach J, Brechka H, Fessenden TB, Isikbay M, Paner GP, Szmulewitz RZ, Vander Griend DJ. Acquired resistance to the second-generation androgen receptor antagonist enzalutamide in castration-resistant prostate cancer. Oncotarget. 2016; 7:26259–74. doi: 10.18632/oncotarget.8456.
11. Cunningham, D, You Z. In vitro and in vivo model systems used in prostate cancer research. J Biol Methods. 2015.
12. Barabas K, Milner R, Lurie D, Adin C. Cisplatin: a review of toxicities and therapeutic applications. Vet Comp Oncol. 2008; 6:p. 1–18.
13. Dasari S, Tchounwou PB. Cisplatin in cancer therapy: molecular mechanisms of action. Eur J Pharmacol. 740:p. 364–78
14. Dhar S, Gu FX, Langer R, Farokhzad OC, Lippard SJ. Targeted delivery of cisplatin to prostate cancer cells by aptamer functionalized Pt(IV) prodrug-PLGA-PEG nanoparticles. Proc Natl Acad Sci USA, 2008. 105:p. 17356–61.
15. Dhar S, Kolishetti N, Lippard SJ, Farokhzad OC. Targeted delivery of a cisplatin prodrug for safer and more effective prostate cancer therapy in vivo. Proc Natl Acad Sci USA. 108:p. 1850–5
16. Basso F, Rocchetti F, Rodriguez S, Nesterova M, Cormier CA, Stratakis B, Ragazzon B, Bertherat J. Rizk-Rabin M. Comparison of the effects of PRKAR1A and PRKAR2B depletion on signaling pathways, cell growth, and cell cycle control of adrenocortical cells. Horm Metab Res. 46:p. 883–8
17. Bouizar Z, Ragazzon B, Viou L, Hortane MJ. Bertherat M. Rizk-Rabin, 8Cl-cAMP modifies the balance between PKAR1 and PKAR2 and modulates the cell cycle, growth and apoptosis in human adrenocortical H295R cells. J Mol Endocrinol. 44:p. 331–47
18. Vincent-Dejean C, Cazabat L, Groussin L, Perlemoine K, Fumey G, Tissier F, X. Bertagna and Bertherat J. Identification of a clinically homogenous subgroup of benign cortisol-secreting adrenocortical tumors characterized by alterations of the protein kinase A (PKA) subunits and high PKA activity. Eur J Endocrinol. 2008;1 58:p. 829–39.
19. Strom SS, Wang X, Pettaway CA, Logothetis CJ, Yamamura Y, Do KA, Babaian RJ, Troncoso P. Obesity, weight gain, and risk of biochemical failure among prostate cancer patients following prostatectomy. Clin Cancer Res. 2005; 11:p. 6889–94.
20. Porkka KP, Pfeiffer MJ, Waltering KK, Vessella RL, Tammela TL, Visakorpi T. MicroRNA expression profiling in prostate cancer. Cancer Res. 2007; 67:p. 6130–5.
21. Yuan J, Kramer A, Matthess Y, Yan R, Spankuch B, Gatje R, Knecht R, Kaufmann M, Strebhardt K. Stable gene silencing of cyclin B1 in tumor cells increases susceptibility to taxol and leads to growth arrest in vivo. Oncogene. 2006; 25:p. 1753–62.
22. Davies RJ, Freeman A, Morris LS, Bingham S, Dilworth S, Scott I, Laskey RA, Miller R, Coleman N. Analysis of minichromosome maintenance proteins as a novel method for detection of colorectal cancer in stool. Lancet. 2002; 359:p. 1917–9.
23. Maiorano D, Lutzmann M, Mechali M. MCM proteins and DNA replication. Curr Opin Cell Biol. 2006; 18:p. 130–6.
24. Golsteyn RM, Mundt KE, Fry AM, Nigg EA. Cell cycle regulation of the activity and subcellular localization of Plk1, a human protein kinase implicated in mitotic spindle function. J Cell Biol. 1995; 129:p. 1617–28.
25. van de Weerdt BC, Medema RH. Polo-like kinases: a team in control of the division. Cell Cycle. 2006; 5:p. 853–64.
26. Kumagai A, Dunphy WG. Purification and molecular cloning of Plx1, a Cdc25-regulatory kinase from Xenopus egg extracts. Science. 1996; 273:p. 1377–80.
27. Liu X, Lei M. Erikson RL. Normal cells, but not cancer cells, survive severe Plk1 depletion. Mol Cell Biol. 2006; 26:p. 2093–108.
28. Bischoff JR, Anderson L, Zhu Y, Mossie K, Ng L, Souza B, Schryver B, Flanagan P, Clairvoyant F, Ginther C, Chan CS, Novotny M, Slamon DJ, et al. A homologue of Drosophila aurora kinase is oncogenic and amplified in human colorectal cancers. Embo J. 1998; 17:p. 3052–65.
29. Kallio MJ, McCleland ML, Stukenberg PT and Gorbsky GJ. Inhibition of aurora B kinase blocks chromosome segregation, overrides the spindle checkpoint, and perturbs microtubule dynamics in mitosis. Curr Biol. 2002; 12:p. 900–5.
30. Liu J, Yu G, Zhao Y, Zhao D, Wang Y, Wang L, Liu J, Li L, Zeng Y, Dang Y, Wang C, Gao G, Long W, et al. REGgamma modulates p53 activity by regulating its cellular localization. J Cell Sci. 2010; 123:p. 4076–84.
31. Trapnell C, Pachter L, Salzberg SL. TopHat: discovering splice junctions with RNA-Seq. Bioinformatics. 2009; 25:p. 1105–11.
32. Trapnell C, Williams BA, Pertea G, Mortazavi A, Kwan G, van Baren MJ, Salzberg SL, Wold BJ, Pachter L. Transcript assembly and quantification by RNA-Seq reveals unannotated transcripts and isoform switching during cell differentiation. Nat Biotechnol. 28:p. 511–5
33. Tavazoie S, Hughes JD, Campbell MJ, Cho RJ, Church GM. Systematic determination of genetic network architecture. Nat Genet. 1999; 22:p. 281–5.
34. Liu J, Cho SN, Akkanti B, Jin N, Mao J, Long W, Chen T, Zhang Y, Tang Wistub X, II, Creighton CJ, Kheradmand F, DeMayo FJ. ErbB2 Pathway Activation upon Smad4 Loss Promotes Lung Tumor Growth and Metastasis. Cell Rep. 2015.