
INTRODUCTION
Esophageal squamous cell carcinoma (ESCC) is one of the most deadly tumors worldwide, with 5 year survival of only 10%. ESCC related death rates are particularly high in China, in part due to the lack of early screening tools and limited treatment options [1].
Superficial ESCC has significant better prognosis than the advanced ESCC, and can be treated effectively by endoscopic resection, including both mucosal resection and submucosal dissection [2, 3]. Endoscopic resection remains the most widely used treatment option for superficial ESCCs because it is safe and esophagus-preserving. However, 26-53% of superficial ESCCs have lymph node metastasis, and require additional esophagectomy or radiochemotherapy after endoscopic resection [4, 5]. Thus identifying biomarkers that can assess the metastatic risk in superficial ESCC is of particular importance.
Several clinicopathological features have been associated with high metastatic risk in superficial ESCC, including invasion depth, tumor size, angiolymphatic invasion and histological differentiation [4–6]. ESCCs are also characterized by CNAs [7, 8]. Among those characteristic CNAs, amplifications of 11q13.3-13.4 (CCND1), 3q26.33 (SOX2), 8q24.2 (MYC) and deletion of 3p14.2 (FHIT) have been associated with metastatic diseases [8–12]. Nevertheless, a comprehensive set of CNAs that can be used to predict metastasis risk in clinical samples are not yet available and would be important to select the appropriate treatment option for superficial ESCCs.
Genomic instabilities, in the form of chromosome instability (CIN), microsatellite instability (MIN) and point mutations, are characteristic for human cancers. CIN, including chromosome structural and number changes, is a major form of genomic instability [13]. According to their size, CNAs can be classified into focal or arm-level CNAs. Focal CNAs are very informative and often involve important oncogenes or tumor suppressor genes [14–17]. CNAs could be detected by next-generation sequencing, comparative array genomic hybridization or single nucleotide polymorphism (SNP) microarray. The OncoScan® assay is a SNP microarray including over 220,000 SNPs across human genome with increased probe density within 891 cancer related genes and are uniquely suited to detect subtle CNAs with high sensitivity and specificity.
Here we reported the analyses of 38 superficial ESCCs originated from radical surgery with both metastatic and metastasis-free samples with Affymetrix OncoScan™ array. The CNAs landscape of superficial ESCC were determined, and the focal recurrent CNAs were compared between the metastasis and metastasis-free cases.
RESULTS
Genome wide CNA of superficial ESCCs
The whole genome CNA profiles of all 38 samples were shown in Supplementary Figure S1. The microarray data has been deposited in the Gene Expression Omnibus (GEO) with the accession number GSE78926. Weighted GII was plotted to show the genome wide CNAs. Weighted GII was 45.5% in all superficial ESCC samples, and was 49.9% and 41.1% in metastasis group and non-metastasis group, respectively. The comparison of weighted GII in metastasis and non-metastasis group was shown in Figure 1A (p = 0.07). In addition, the comparison of GII on each chromosome in non-metastasis and metastasis groups was also performed. In non-metastasis group, chromosomes 3 (65.7%), 8 (78.2%) and 20 (59.8%) have the highest GII, whereas chromosomes 4 (29.5%), 12 (28.7%) and 21(25.2%) have lowest GII. In metastasis group, chromosomes 3 (75.2%), 8 (72.1%) and 14 (60.0%) have the highest GII, whereas chromosomes 15 (35.9%), 21 (31.8%) and 22 (38.1%) have the lowest GII. Chromosome 18 has higher GII in metastasis group than in the non-metastasis group (p = 0.03) (Figure 1B).
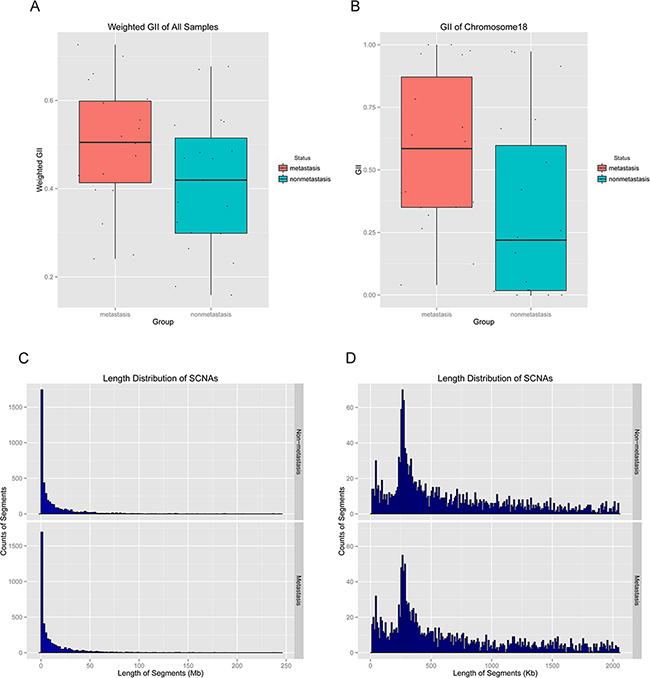
Figure 1: The whole genome copy number alteration (CNA) profiles of all 38 samples were shown. A. Comparison of weighted genome instability index (GII) of all chromosomes between metastasis and non-metastasis groups (p = 0.07). B. Comparison of GII of Chromosome 18 between metastasis and non-metastasis groups (p = 0.03). C. Length distribution of all the CNAs in metastasis and non-metastasis groups. D. Length distribution of CNAs (< 2 Mb) in metastasis and non-metastasis groups.
The average number of genome segments with CNAs in all 38 samples was 218, and the average length was 13.26 Mb (minimal length was 13.14 Kb and maximal length was 242.64 Mb). In metastasis group, the average number of segments with CNAs was 217, and the average length was 13.35 Mb (minimal length was 13.16 Kb and maximal length was 239.80 Mb). In non-metastasis group, the average number of segments with CNAs was 210, and the average length was 13.05 Mb (minimal length was 13.14 Kb and maximal length was 242.64 Mb). The distribution of size of CNAs length was shown in Figure 1C and 1D.
Recurrent CNAs in metastasis and non-metastasis groups
We found 28 significantly recurrent focal CNAs, including 16 amplifications and 12 deletions in all 38 superficial ESCCs (Supplementary Table S1) (Figure 2). The most common CNAs were amplifications of 11q13.3 (FGF4), 3q28 (TP63), 14q21.1 (FOXA1), 8q24.21 (MYC), and deletions of 9p21.3 (CDKN2A), 22q11.23 (GSTT1), 3p13 (MITF) and 2q22.1 (LRP1B). In metastasis group, eight recurrent focal CNAs were found, including 4 amplifications and 4 deletions (Supplementary Table S2). The most common CNAs were amplifications of 11q13.3 (FGF4), 14q21.1 (FOXA1), 3q26.33 (SOX2-OT), 8q24.21 (MYC) and deletions of 22q11.23 (GSTT1), 9p21.3 (CDKN2A). In non-metastasis group, fourteen recurrent focal CNAs were found, including 12 amplifications and 2 deletions (Supplementary Table S3). The most common CNAs were amplifications of 11q13.3 (FGF4), 2q33.1 (PLCL1), 3q28 (TP63) and deletions of 22q11.23 (GSTT1) and 9p21.3 (CDKN2A). In conclusion, amplifications of 11q13.3 (FGF4), 8q24.21 (MYC) and deletions of 9p21.3 (CDKN2A) and 2q22.1 (LRP1B), which previously reported in ESCCs were also found in all 38 superficial ESCCs in our study. Furthermore, deletions of 3p13 (MITF) and 22q11.23 (GSTT1) were also found as CNAs targets of ESCC but were not previously reported. Amplification of 3q26.33 (SOX2-OT) was the most significantly recurrent CNA in metastasis group whereas amplification of 3q28 (TP63) was the most significantly recurrent CNA in non-metastasis group.
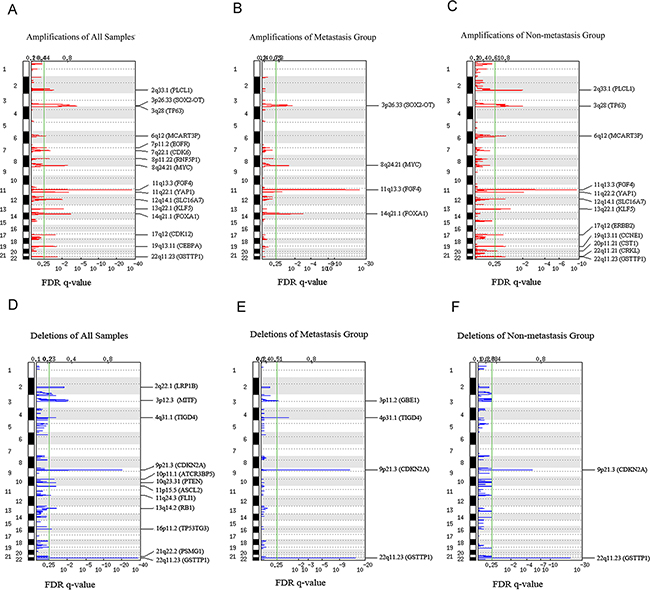
Figure 2: GISTIC analysis of copy number alterations in esophageal squamous cell carcinoma (ESCC). False discovery rate (FDR) q-values are plotted along the x axis with chromosomal position along the y axis. Regions with q values < 0.25 (green lines) were considered significantly altered. Known or putative gene targets within the peak regions and the regions are indicated for significant peaks. A. Amplifications of all superficial ESCCs. B. Amplifications of superficial ESCCs with metastasis. C. Amplifications of superficial ESCCs without metastasis. D. Deletions of all superficial ESCC. E. Deletions of superficial ESCCs with metastasis. F. Deletions of superficial ESCCs without metastasis.
Comparison of CNAs between metastasis and non-metastasis groups of 891 cancer genes
Given Oncoscan microarray has increased probe density within 891 cancer genes, these 891 cancer genes were analyzed separately. Among these 891 genes, 39 genes had significantly different CNAs between metastasis and non-metastasis groups (Mann-Whitney U-test, p < 0.05). Hierarchical clustering was performed on the CNA profiles of these 39 genes and two groups were obtained, including metastasis and non-metastasis groups. In general, good separated performance of metastasis and non-metastasis was obtained with a small amount of misclassification (two metastasis misclassified and five non-metastasis misclassified) (Figure 3).
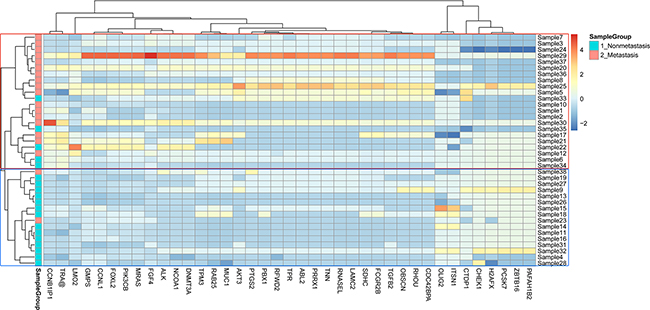
Figure 3: Heat map generated by unsupervised hierarchical clustering based on contributions of copy number alteration profiles of 39 gene signatures identified by Mann-Whitney U-test in 38 esophageal squamous cell carcinoma genomes. The blue and red color columns represent non-metastasis and metastasis groups respectively.
The genomic distribution and copy numbers of these 39 genes was shown in Figure 4 and Supplementary Figure S1. The comparison of the 39 genes was shown in Table 1. Among the 39 genes, average copy number of FGF4 in all cases (11q13.3, Mann-Whitney U-test, p = 0.045) were 5.14. Amplification of FGF4 happened in 68% cases in metastasis group, and 58% in non-metastasis group. FGF4 gene was located on chromosome 11q13.3, which were found to be amplified in ESCCs from previous studies. Average copy number of MRAS gene (3q22.3, Mann-Whitney U-test, p = 0.029) in all cases was 2.61, and 68% cases had amplification of MRAS gene in metastasis and 84% cases had amplifications in non-metastasis group. Average copy number of ALK (2p21, Mann-Whitney U-test, p = 0.024) in all cases was 2.25. Amplification of ALK gene happened in 26% of non-metastasis cases, and 63% of metastasis cases. Average copy number of CHEK1 (11q24.2, Mann-Whitney U-test, p = 0.017) in all cases was 1.91. In non-metastasis group 3 cases (16%) had amplification of CHEK1 and 3 cases (16%) had deletion of CHEK1, and in metastasis group only one case had amplification and 10 cases (53%) had deletion of CHEK1.
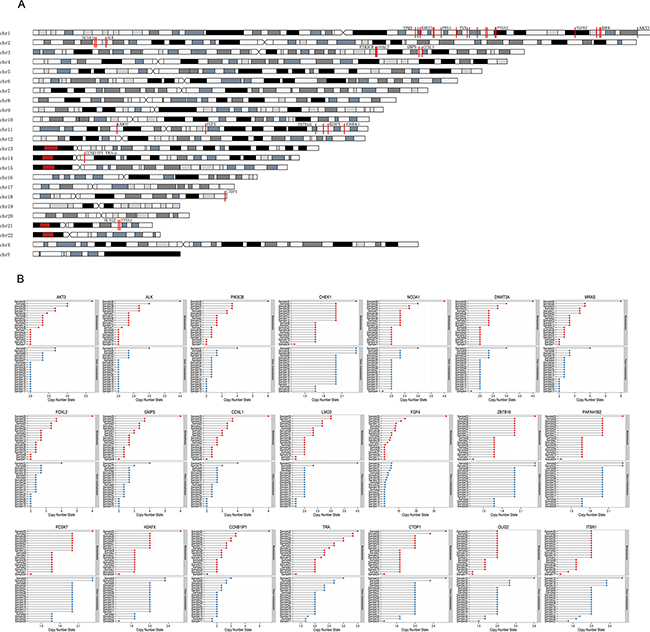
Figure 4: The genomic distribution and copy number of 39 genes identified by Mann-Whitney U-test in 38 esophageal squamous cell carcinoma genomes. A. The red lines marked on chromosomes represented the position of the 39 genes on genome. B. The copy numbers of the part of the 39 genes in metastasis and non-metastasis groups were shown. The copy numbers of other part of the 39 genes were shown in Supplementary Figure S2.
Table 1: The significantly different copy numbers of thirty nine genes in metastasis and non-metastasis groups
Gene name |
Position |
Average CN |
P value |
Non-metastasis |
Metastasis |
||||
|---|---|---|---|---|---|---|---|---|---|
Average CN |
Amplification |
Deletion |
Average CN |
Amplification |
Deletion |
||||
TPM3 |
Chr1:154117779-154165725 |
2.32 |
0.021 |
2.16 |
8 (0.42) |
0 (0) |
2.49 |
13 (0.68) |
0 (0) |
MUC1 |
Chr1:155148299-155172706 |
2.28 |
0.023 |
2.14 |
8 (0.42) |
1 (0.05) |
2.42 |
13 (0.68) |
0 (0) |
RAB25 |
Chr1:156020966-156050295 |
2.31 |
0.029 |
2.16 |
8 (0.42) |
1 (0.05) |
2.46 |
13 (0.68) |
0 (0) |
SDHC |
Chr1:161274165-161344535 |
2.35 |
0.021 |
2.17 |
8 (0.42) |
0 (0) |
2.53 |
14 (0.74) |
0 (0) |
FCGR2B |
Chr1:161622904-161658444 |
2.34 |
0.022 |
2.17 |
8 (0.42) |
0 (0) |
2.51 |
14 (0.74) |
0 (0) |
PBX1 |
Chr1:164518596-164831060 |
2.32 |
0.049 |
2.17 |
8 (0.42) |
0 (0) |
2.46 |
13 (0.68) |
0 (0) |
PRRX1 |
Chr1:170623312-170718541 |
2.30 |
0.023 |
2.14 |
7 (0.37) |
0 (0) |
2.46 |
13 (0.68) |
0 (0) |
TNN |
Chr1:175026993-175127202 |
2.30 |
0.023 |
2.14 |
7 (0.37) |
0 (0) |
2.46 |
13 (0.68) |
0 (0) |
RFWD2 |
Chr1:175903966-176186370 |
2.28 |
0.025 |
2.12 |
7 (0.37) |
1 (0.05) |
2.45 |
13 (0.68) |
0 (0) |
ABL2 |
Chr1:179058461-179122224 |
2.30 |
0.023 |
2.14 |
7 (0.37) |
0 (0) |
2.46 |
13 (0.68) |
0 (0) |
RNASEL |
Chr1:182532768-182568394 |
2.29 |
0.023 |
2.14 |
7 (0.37) |
0 (0) |
2.44 |
13 (0.68) |
0 (0) |
LAMC2 |
Chr1:183145173-183220406 |
2.29 |
0.023 |
2.14 |
7 (0.37) |
0 (0) |
2.44 |
13 (0.68) |
0 (0) |
TPR |
Chr1:186270785-186354457 |
2.28 |
0.045 |
2.14 |
7 (0.37) |
0 (0) |
2.42 |
12 (0.63) |
0 (0) |
PTGS2 |
Chr1:186630943-186659559 |
2.30 |
0.034 |
2.14 |
7 (0.37) |
0 (0) |
2.46 |
12 (0.63) |
0 (0) |
TGFB2 |
Chr1:218508675-218627961 |
2.28 |
0.045 |
2.14 |
7 (0.37) |
0 (0) |
2.42 |
12 (0.63) |
0 (0) |
CDC42BPA |
Chr1:227167565-227515826 |
2.30 |
0.043 |
2.16 |
6 (0.32) |
0 (0) |
2.44 |
12 (0.63) |
0 (0) |
OBSCN |
Chr1:228385860-228558951 |
2.30 |
0.043 |
2.16 |
6 (0.32) |
0 (0) |
2.44 |
12 (0.63) |
0 (0) |
RHOU |
Chr1:228770393-228892416 |
2.30 |
0.043 |
2.16 |
6 (0.32) |
0 (0) |
2.44 |
12 (0.63) |
0 (0) |
AKT3 |
Chr1:243641534-244016584 |
2.26 |
0.047 |
2.14 |
6 (0.32) |
0 (0) |
2.39 |
12 (0.63) |
0 (0) |
NCOA1 |
Chr2:24797345-25003570 |
2.23 |
0.036 |
2.10 |
5 (0.26) |
1 (0.05) |
2.35 |
11 (0.58) |
0 (0) |
DNMT3A |
Chr2:25445829-25485184 |
2.23 |
0.036 |
2.10 |
5 (0.26) |
1 (0.05) |
2.35 |
11 (0.58) |
0 (0) |
ALK |
Chr2:29405639-30154477 |
2.25 |
0.024 |
2.12 |
5 (0.26) |
0 (0) |
2.37 |
12 (0.63) |
0 (0) |
MRAS |
Chr3:138056489-138134377 |
2.61 |
0.029 |
2.37 |
13 (0.68) |
0 (0) |
2.86 |
16 (0.84) |
0 (0) |
PIK3CB |
Chr3:138361539-138436463 |
2.62 |
0.029 |
2.37 |
13 (0.68) |
0 (0) |
2.88 |
16 (0.84) |
0 (0) |
FOXL2 |
Chr3:138653065-138675982 |
2.62 |
0.043 |
2.39 |
13 (0.68) |
0 (0) |
2.86 |
16 (0.84) |
0 (0) |
GMPS |
Chr3:155578324-155665520 |
2.74 |
0.042 |
2.51 |
15 (0.79) |
0 (0) |
2.96 |
18 (0.95) |
0 (0) |
CCNL1 |
Chr3:156855585-156888482 |
2.75 |
0.032 |
2.51 |
15 (0.79) |
0 (0) |
2.98 |
18 (0.95) |
0 (0) |
LMO2 |
Chr11:33870122-33901371 |
2.15 |
0.031 |
2.05 |
2 (0.11) |
4 (0.21) |
2.25 |
9 (0.47) |
2 (0.11) |
FGF4 |
Chr11:69577796-69600171 |
5.14 |
0.045 |
3.15 |
11 (0.58) |
0 (0) |
7.12 |
13 (0.68) |
0 (0) |
ZBTB16 |
Chr11:113920430-114131397 |
1.90 |
0.049 |
1.97 |
2 (0.11) |
4 (0.21) |
1.83 |
1 (0.05) |
10 (0.53) |
PAFAH1B2 |
Chr11:117004999-117051761 |
1.90 |
0.049 |
1.97 |
2 (0.11) |
4 (0.21) |
1.83 |
1 (0.05) |
10 (0.53) |
PCSK7 |
Chr11:117065787-117112811 |
1.90 |
0.049 |
1.97 |
2 (0.11) |
4 (0.21) |
1.83 |
1 (0.05) |
10 (0.53) |
H2AFX |
Chr11:118954584-118976177 |
1.89 |
0.041 |
1.95 |
2 (0.11) |
4 (0.21) |
1.83 |
1 (0.05) |
11 (0.58) |
CHEK1 |
Chr11:125485030-125537042 |
1.91 |
0.017 |
2.00 |
3 (0.16) |
3 (0.16) |
1.83 |
1 (0.05) |
10 (0.53) |
CCNB1IP1 |
Chr14:20769528-20807533 |
2.36 |
0.039 |
2.14 |
6 (0.32) |
2 (0.11) |
2.58 |
12 (0.63) |
1 (0.05) |
TRA@ |
Chr14:22080057-23031075 |
2.29 |
0.040 |
2.13 |
6 (0.32) |
3 (0.16) |
2.45 |
12 (0.63) |
1 (0.05) |
CTDP1 |
Chr18:77429800-77524510 |
1.91 |
0.041 |
1.98 |
2 (0.11) |
3 (0.16) |
1.84 |
2 (0.11) |
11 (0.58) |
OLIG2 |
Chr21:34388215-34411503 |
1.94 |
0.036 |
2.04 |
4 (0.21) |
3 (0.16) |
1.84 |
0 (0) |
7 (0.37) |
ITSN1 |
Chr21:35004783-35220802 |
1.94 |
0.030 |
2.03 |
4 (0.21) |
3 (0.16) |
1.85 |
0 (0) |
7 (0.37) |
The most significantly enriched pathway/functional terms were “Proto-oncogene” (p = 7.59E-11), “Chromosomal rearrangement” (p = 8.64E-9), “Pathways in cancer” (p = 6.66E-04) and “Nucleotide-binding” (p = 0.015).
DISCUSSION
The main purpose of this study is to identify CNAs that could differentiate superficial ESCC patients with high risk of metastasis. Although several whole genome copy number analyses on ESCC have been reported, there has been no systematic study on superficial ESCC. In this study, we used Affymetrix OncoScan™ (SNP microarray) to analyze genome wide CNAs of 38 superficial ESCCs and compared recurrent focal CNAs level, and the CNAs of 891 cancer genes between ESCCs with and without metastasis.
The Oncoscan SNP microarray is an ideal platform to perform analyses on FFPE-derived tumor materials with increased probe density within 891 cancer genes at 50-100 kb resolution. Among the 891 cancer genes, 39 cancer genes had significantly different CNAs between the metastasis and non-metastasis cases. These genes might represent candidate biomarkers for superficial ESCC patients with high risk of metastasis after surgery. Previous studies focus on using gene expression profiles to guide prognosis prediction and diagnosis [18, 19]. Here we suggested that DNA copy number may be used for the same purpose with the advantage of being more stable [20]. FGF4, PIK3CB, MRAS, ALK, LMO2, AKT3 and CHEK1 genes were included in the 39-gene signature. Copy number of CHEK1 gene was significantly lower in metastasis than in non-metastasis groups (p = 0.017). Checkpoint kinase 1 (Chk1) which encoded by CHEK1 gene trigger cell cycle arrest upon DNA damage [21] Although CHEK1 was initially thought to be a tumor suppressor gene due to its role in checkpoint activation and cell cycle arrest, several studies documented a positive correlation between Chk1 expression and tumor grade and disease recurrence, suggesting that Chk1 may promote tumor growth [22–24]. So the role of CHEK1 in ESCC should be explored further. In addition, FGF4 gene located in 11q13.3 was also recurrently amplified in superficial ESCC.
In discovery and validation experiments, there were 88.5% (23/26) cases showed the identical copy number aberrations of CCNL1 gene, and 76% (19/25) cases for PIK3CB gene. The difference of calculation of copy number alterations in these two experiments might lead to inconsistency of results.
The recurrent focal CNAs which determined by GISTIC2.0 were more likely to identify cancer-causing genes [14, 25]. Among all 38 superficial ESCC samples, recurrent focal amplifications of 11q13.3 (FGF4 and FGF19), 8q24.21 (MYC), 7q22.1 (CDK6) and deletions of 9p21.3 (CDKN2A), 3p12.3 (MITF), 2q22.1 (LRP1B), 13q14.2 (RB1) which were previously reported in all stage of ESCC [8, 11, 12, 26–30] were also found in our study. This indicated that those CNAs might be the driver events in early stage of ESCC. In addition, amplification of 11q21.1 (FOXA1), which has not been previously reported as associated with ESCCs, was found in 20 cases (52.6%) in our study. Forkhead box protein A1 (FOXA1), the representative member of the Forkhead-box (FOX) proteins subfamily, is a DNA-binding transcription factor. Amplification of FOXA1 gene has been found in lung cancer, esophageal adenocarcinoma, [31] estrogen receptor (ER)-positive breast cancer [32] and anaplastic thyroid cancer [33]. And the levels of FOXA1 protein have been correlated with the prognosis of breast cancer and gastric cancer [34, 35]. Deletions of 22q11.23 (GSTT1, GSTTP1, and GSTT2) occurred in 20 superficial ESCC samples (57.9%) in our study. Glutathione S-transferase (GST) theta 1 (GSTT1) which encoded by GSTT1 gene is a member metabolizing dimeric phase II enzymes superfamily. These enzymes play a vital role in cellular defense system by catabolism of a broad range of xenobiotics and carcinogen [36, 37]. Many previous studies have found that GSTT1 gene deletion polymorphisms increases susceptibility to lymphoma, breast cancer, colon cancer and lung cancer [38–40]. So the results of our study suggested that the role of GSTT1 deletion in the etiology of ESCC should be explored further.
Amplifications of 3p26.33 (SOX2-OT), 8q24.21 (MYC), 14q21.1 (FOXA1) and deletion of 3p12.1 (GBE1) were found as the recurrent CNAs in metastasis group only, which indicated that those CNAs might be associated with metastasis in superficial ESCC. Deletion of 3p12.1 (GBE1) has been associated with prognosis in cervical cancer [41], but not in ESCC previously. Sex determining region Y-box 2 (SOX2), a key transcription factor involved in self-renewal and pluripotency of embryonic stem cells, plays an important role in tumor cell metastasis and apoptosis [42]. SOX2 gene embedded in the introns of SOX2 overlapping transcript (SOX2OT) gene, which encodes a long non-coding RNA (lncRNA) [43]. Amplifications of SOX2 have been associated with metastasis or poor prognosis in previous studies of ESCC [9, 44–46]. In our study, amplification of SOX2OT gene on 3p26.33 was found as recurrent CNA in metastasis group. SOX2OT gene encodes the lncRNA which have been demonstrated that involved in regulation of SOX2 expression and/or other related processes. And expression of SOX2 and SOX2OT were concordant in ESCC and breast cancer [47, 48]. The role of SOX2OT gene and expression in ESCC metastasis should be explored further.
In conclusion, our study constructed a 39-gene signature associated with metastasis from superficial ESCCs. The comparison of recurrent CNAs between superficial ESCCs with and without metastasis also revealed a subset of metastasis specific events. A larger set of independent samples are warranted to validate and refine this 39-gene signature from our study.
MATERIALS AND METHODS
Patients and genomic DNA extraction
Thirty eight superficial ESCC patients, at stage T1N0M0, were collected from Cancer Hospital, Chinese Academy of Medical Sciences between 2004 and 2010. The most recent follow-up visit was dated in June 2015 and the follow was conducted via telephone interview or clinical data consultation. Among the 38 cases, 19 metastasis cases have lymph node metastasis or distant metastasis within five years from radical surgery, and the 19 metastasis-free cases have no detectably metastasis within five years after radical surgery. All the patients underwent radical resection without radiotherapy or chemotherapy prior to surgery. The clinicopathological characters of 38 patients were summarized in Table 2. The Institute Review Board of the Cancer Hospital, CAMS, agreed to waive the need for consent for this study and approved the study protocol.
Table 2: Clinicopathological features of 38 superficial ESCC cases
Features |
Non-metastasis |
Metastasis |
|
|---|---|---|---|
Gender |
Female |
7 |
7 |
Male |
12 |
12 |
|
Age |
>=57 |
10 |
13 |
<57 |
9 |
6 |
|
Family history |
Yes |
4 |
4 |
No |
15 |
15 |
|
Smoking |
Yes |
14 |
9 |
No |
5 |
10 |
|
Drinking |
Yes |
12 |
5 |
No |
7 |
14 |
|
Differentiation |
Well |
6 |
5 |
Moderately |
12 |
12 |
|
Poorly |
1 |
2 |
|
Location |
Upper thoracic |
1 |
3 |
Middle thoracic |
7 |
7 |
|
Lower thoracic |
11 |
9 |
|
Depth |
mucosa |
1 |
0 |
Submucosa |
18 |
19 |
|
Lymphovascular invasion |
Yes |
1 |
2 |
No |
18 |
17 |
Genomic DNA were extracted from formalin-fixed and paraffin-embedded (FFPE) tissues of 38 superficial ESCCs using QIAamp DNA Mini kit (Qiagen, Hilgen, Germany) according to the manufacturer’s instruction. H&E sections of all cases were reviewed to manually identify areas with minimum of 85% malignant cells for microdissection.
Single nucleotide polymorphism (SNP) array
Molecular Inversion Probe (MIP) based Oncoscan Array was used to detect CNAs, loss of heterozygosity, and somatic point mutations. The experiments were performed according to the user guide of Affymetrix OncoScan™ FFPE Assay Kit (Affymetrix, CA). Briefly, 75 ng FFPE DNA were hybridized to MIP probes and allowed to anneal 58°C overnight (16-18h) after denaturation at 95°C for 5 min. Then each sample was split into two tubes and gap fill reaction was performed by adding dATP (A) and dTTP (T) (A/T) in one tube and dGTP (G) and dCTP (C) (G/C) to another. After removing the un-circularized MIP probes through exonuclease treatment, the cleavage enzyme was added to linearize the gap-filled circular MIP Probes. Then the circular MIP probes were amplified by first and second round PCR. The enriched product was digested by HaeIII enzyme and the 44bp fragments were hybridized to the OncoScan™ Array for 16-18h. The hybridized arrays were washed, stained using the GeneChip® Fluidics Station 450 and scanned through GeneChip® Scanner 3000 7G (Affymetrix, CA).
Real time PCR (qPCR)
Real Time PCR (qPCR) was used to validate CNAs of CCNL1 and PIK3CB genes with the internal control HBB gene using SYBR-Green II fluorescence and Mx3005P System (Agilent Technologies, CA, USA)) (Supplementary Table S4). The results were analysed using the MxPro QPCR software. Comparative CT method was used to calculate the copy numbers of target genes. Cases with 2-ΔΔCT > 1 were considered as amplification of genes, and cases with 2-ΔΔCT < 1 were considered as deletion of genes [49].
Data and statistical analysis
The intensity (CEL) files generated by the scanner were imported into Oncoscan Console Software (Biodiscovery, Inc., CA USA) and analyzed by the Affymetrix TuScan algorithm (a modified ASCAT algorithm) to create segmentation to differentiate between adjacent clusters of probes and determines the CNAs. Amplification was defined as copy number which was calculated using Affymetrix TuScan algorithm > 2, and copy number < 2 was considered to be deletion. In addition, the copy number information of 891 cancer genes were obtained as Gene Report text files from the Console software.
The recurrent CNAs were determined using GISTIC2.0 (Genomic Identification of Significant Targets in Cancer) with a Q-value cutoff < 0.25. And the significant recurrent focal CNAs has a 90% likelihood of containing the targeted genes.
The Mann-Whitney U-test was used to detect the significantly different CNAs of 891 cancer genes between metastasis group and non-metastasis group. And then, hierarchical clustering was performed on significantly differential CNAs of cancer genes. Pheatmap function in R pheatmap package was used to draw heat maps to visualize the clustering results.
Genome instability index (GII) was used to evaluate the levels of DNA copy number changes in all 38 samples. To take the variation of chromosome size into consideration, weighted GII was used. First, percentage of aberrant SNPs for each chromosome was calculated separately to obtain GII of each chromosome. For individual chromosome, numbers of SNPs with aberrant copy number were divided by numbers of all SNPs in each chromosome to get the GII of each chromosome. Then the mean percentage aberration of all 22 autosomes in each sample was calculated to generate the weighted GII [50, 51]. Paired t-test was used to compare the difference between metastasis and non-metastasis groups (p < 0.05). All the statistical analyses were performed on R (version 3.2.1). Significance were deemed as < 0.05 for all statistical analyses.
Functional enrichment analyses was performed on the 39 genes using DAVID (Database for Annotation, Visualization and Integrated Discovery) tool. These terms achieved significant enrichment p values after adjusted with the Benjamini method.
ACKNOWLEDGEMENTS
All authors would like to thank Ying Yang for help in technique support, and Peng Zhang and Xuexin Yu for help in data analysis.
CONFLICTS OF INTEREST
Professional judgment concerning a primary interest would not be influenced by a secondary interest. There is no financial/personal interest or belief that could affect objectivity.
GRANT SUPPORT
This work was supported by project grants from National Natural Science Foundation of China (81272308), the PUMC Youth Fund and the Funderental Research Funds the Central Universities (3332013162), the Youth Backbone Program (to Jianming Ying) of Cancer Hospital, CAMS, Beijing, China.
REFERENCES
1. Pennathur A, Gibson MK, Jobe BA, Luketich JD. Oesophageal carcinoma. Lancet. 2013; 381: 400-12.
2. Green S, Bhandari P, DeCaestecker J, Barr H, Ragunath K, Jankowski J, Singh R, Longcroft-Wheaton G, Bennett C. Endoscopic therapies for the prevention and treatment of early esophageal neoplasia. Expert Rev Gastroenterol Hepatol. 2011; 5: 731-43.
3. Ishihara R, Iishi H, Uedo N, Takeuchi Y, Yamamoto S, Yamada T, Masuda E, Higashino K, Kato M, Narahara H, Tatsuta M. Comparison of EMR and endoscopic submucosal dissection for en bloc resection of early esophageal cancers in Japan. Gastrointest Endosc. 2008; 68: 1066-72.
4. Eguchi T, Nakanishi Y, Shimoda T, Iwasaki M, Igaki H, Tachimori Y, Kato H, Yamaguchi H, Saito D, Umemura S. Histopathological criteria for additional treatment after endoscopic mucosal resection for esophageal cancer: analysis of 464 surgically resected cases. Mod Pathol. 2006; 19: 475-80.
5. Araki K, Ohno S, Egashira A, Saeki H, Kawaguchi H, Sugimachi K. Pathologic features of superficial esophageal squamous cell carcinoma with lymph node and distal metastasis. Cancer. 2002; 94: 570-5.
6. Xue L, Ren L, Zou S, Shan L, Liu X, Xie Y, Zhang Y, Lu J, Lin D, Dawsey SM, Wang G, Lu N. Parameters predicting lymph node metastasis in patients with superficial esophageal squamous cell carcinoma. Mod Pathol. 2012; 25: 1364-77.
7. Gao YB, Chen ZL, Li JG, Hu XD, Shi XJ, Sun ZM, Zhang F, Zhao ZR, Li ZT, Liu ZY, Zhao YD, Sun J, Zhou CC, et al. Genetic landscape of esophageal squamous cell carcinoma. Nat Genet. 2014; 46: 1097-102.
8. Song Y, Li L, Ou Y, Gao Z, Li E, Li X, Zhang W, Wang J, Xu L, Zhou Y, Ma X, Liu L, Zhao Z, et al. Identification of genomic alterations in oesophageal squamous cell cancer. Nature. 2014; 509: 91-5.
9. Bass AJ, Watanabe H, Mermel CH, Yu S, Perner S, Verhaak RG, Kim SY, Wardwell L, Tamayo P, Gat-Viks I, Ramos AH, Woo MS, Weir BA, et al. SOX2 is an amplified lineage-survival oncogene in lung and esophageal squamous cell carcinomas. Nat Genet. 2009; 41: 1238-42.
10. Hu N, Wang C, Ng D, Clifford R, Yang HH, Tang ZZ, Wang QH, Han XY, Giffen C, Goldstein AM, Taylor PR, Lee MP. Genomic characterization of esophageal squamous cell carcinoma from a high-risk population in China. Cancer Res. 2009; 69: 5908-17.
11. Miyawaki Y, Kawachi H, Ooi A, Eishi Y, Kawano T, Inazawa J, Imoto I. Genomic copy-number alterations of MYC and FHIT genes are associated with survival in esophageal squamous-cell carcinoma. Cancer Sci. 2012; 103: 1558-66.
12. Ying J, Shan L, Li J, Zhong L, Xue L, Zhao H, Li L, Langford C, Guo L, Qiu T, Lu N, Tao Q. Genome-wide screening for genetic alterations in esophageal cancer by aCGH identifies 11q13 amplification oncogenes associated with nodal metastasis. PLoS One. 2012; 7: e39797.
13. Negrini S, Gorgoulis VG, Halazonetis TD. Genomic instability--an evolving hallmark of cancer. Nat Rev Mol Cell Biol. 2010; 11: 220-8.
14. Beroukhim R, Mermel CH, Porter D, Wei G, Raychaudhuri S, Donovan J, Barretina J, Boehm JS, Dobson J, Urashima M, Mc Henry KT, Pinchback RM, Ligon AH, et al. The landscape of somatic copy-number alteration across human cancers. Nature. 2010; 463: 899-905.
15. Weir BA, Woo MS, Getz G, Perner S, Ding L, Beroukhim R, Lin WM, Province MA, Kraja A, Johnson LA, Shah K, Sato M, Thomas RK, et al. Characterizing the cancer genome in lung adenocarcinoma. Nature. 2007; 450: 893-8.
16. Zender L, Spector MS, Xue W, Flemming P, Cordon-Cardo C, Silke J, Fan ST, Luk JM, Wigler M, Hannon GJ, Mu D, Lucito R, Powers S, et al. Identification and validation of oncogenes in liver cancer using an integrative oncogenomic approach. Cell. 2006; 125: 1253-67.
17. Tang YC, Amon A. Gene copy-number alterations: a cost-benefit analysis. Cell. 2013; 152: 394-405.
18. Yin ZQ, Liu JJ, Xu YC, Yu J, Ding GH, Yang F, Tang L, Liu BH, Ma Y, Xia YW, Lin XL, Wang HX. A 41-gene signature derived from breast cancer stem cells as a predictor of survival. J Exp Clin Cancer Res. 2014; 33: 49.
19. Park YH, Jung HH, Do IG, Cho EY, Sohn I, Jung SH, Kil WH, Kim SW, Lee JE, Nam SJ, Ahn JS, Im YH. A seven-gene signature can predict distant recurrence in patients with triple-negative breast cancers (TNBCs) who receive adjuvant chemotherapy following curative surgery of the primary breast cancer. Cancer Research. 2015; 75.
20. van de Wiel MA, Picard F, van Wieringen WN, Ylstra B. Preprocessing and downstream analysis of microarray DNA copy number profiles. Briefings in Bioinformatics. 2011; 12: 10-21.
21. Sanchez Y, Wong C, Thoma RS, Richman R, Wu RQ, PiwnicaWorms H, Elledge SJ. Conservation of the Chk1 checkpoint pathway in mammals: Linkage of DNA damage to Cdk regulation through Cdc25. Science. 1997; 277: 1497-501.
22. Zhang Y, Hunter T. Roles of Chk1 in cell biology and cancer therapy. Int J Cancer. 2014; 134: 1013-23.
23. Solyom S, Pylkas K, Winqvist R. Screening for large genomic rearrangements of the BRIP1 and CHK1 genes in Finnish breast cancer families. Fam Cancer. 2010; 9: 537-40.
24. Tort F, Hernandez S, Bea S, Camacho E, Fernandez V, Esteller M, Fraga MF, Burek C, Rosenwald A, Hernandez L, Campo E. Checkpoint kinase 1 (CHK1) protein and mRNA expression is downregulated in aggressive variants of human lymphoid neoplasms. Leukemia. 2005; 19: 112-7.
25. Mermel CH, Schumacher SE, Hill B, Meyerson ML, Beroukhim R, Getz G. GISTIC2.0 facilitates sensitive and confident localization of the targets of focal somatic copy-number alteration in human cancers. Genome Biol. 2011; 12: R41.
26. Shi ZZ, Shang L, Jiang YY, Hao JJ, Zhang Y, Zhang TT, Lin DC, Liu SG, Wang BS, Gong T, Zhan QM, Wang MR. Consistent and differential genetic aberrations between esophageal dysplasia and squamous cell carcinoma detected by array comparative genomic hybridization. Clin Cancer Res. 2013; 19: 5867-78.
27. Shi ZZ, Jiang YY, Hao JJ, Zhang Y, Zhang TT, Shang L, Liu SG, Shi F, Wang MR. Identification of putative target genes for amplification within 11q13.2 and 3q27.1 in esophageal squamous cell carcinoma. Clin Transl Oncol. 2014; 16: 606-15.
28. Shi ZZ, Shang L, Jiang YY, Hao JJ, Zhang Y, Zhang TT, Lin DC, Liu SG, Wang BS, Gong T, Zhan QM, Wang MR. Consistent and Differential Genetic Aberrations between Esophageal Dysplasia and Squamous Cell Carcinoma Detected By Array Comparative Genomic Hybridization. Clinical Cancer Research. 2013; 19: 5867-78.
29. Shi ZZ, Jiang YY, Hao JJ, Zhang Y, Zhang TT, Shang L, Liu SG, Shi F, Wang MR. Identification of putative target genes for amplification within 11q13.2 and 3q27.1 in esophageal squamous cell carcinoma. Clinical & Translational Oncology. 2014; 16: 606-15.
30. Carneiro A, Isinger A, Karlsson A, Johansson J, Jonsson G, Bendahl PO, Falkenback D, Halvarsson B, Nilbert M. Prognostic impact of array-based genomic profiles in esophageal squamous cell cancer. Bmc Cancer. 2008; 8.
31. Lin L, Miller CT, Contreras JI, Prescott MS, Dagenais SL, Wu R, Yee J, Orringer MB, Misek DE, Hanash SM, Glover TW, Beer DG. The hepatocyte nuclear factor 3 alpha gene, HNF3alpha (FOXA1), on chromosome band 14q13 is amplified and overexpressed in esophageal and lung adenocarcinomas. Cancer Res. 2002; 62: 5273-9.
32. Hu X, Stern HM, Ge L, O’Brien C, Haydu L, Honchell CD, Haverty PM, Peters BA, Wu TD, Amler LC, Chant J, Stokoe D, Lackner MR, et al. Genetic alterations and oncogenic pathways associated with breast cancer subtypes. Mol Cancer Res. 2009; 7: 511-22.
33. Nucera C, Eeckhoute J, Finn S, Carrol JS, Ligon AH, Priolo C, Fadda G, Toner M, Sheils O, Attard M, Pontecorvi A, Nose V, Loda M, et al. FOXA1 Is a Potential Oncogene in Anaplastic Thyroid Carcinoma. Clinical Cancer Research. 2009; 15: 3680-9.
34. Ren HY, Zhang P, Tang Y, Wu MP, Zhang WK. Forkhead box protein A1 is a prognostic predictor and promotes tumor growth of gastric cancer. Oncotargets and Therapy. 2015; 8: 3029-39.
35. Badve S, Nakshatri H. Oestrogen-receptor-positive breast cancer: towards bridging histopathological and molecular classifications. Journal of Clinical Pathology. 2009; 62: 6-12.
36. Boyer TD. The glutathione S-transferases: an update. Hepatology. 1989; 9: 486-96.
37. Baxter SW, Thomas EJ, Campbell IG. GSTM1 null polymorphism and susceptibility to endometriosis and ovarian cancer. Carcinogenesis. 2001; 22: 63-5.
38. Masood N, Mubashar A, Yasmin A. Epidemiological factors related to GSTM1 and GSTT1 genes deletion in colon and rectum cancers: A case-control study. Cancer Biomark. 2015; 15: 583-9.
39. Han LY, Liu K, Lin XL, Zou BB, Zhao JS. Lack of Any Association of GST Genetic Polymorphisms with Susceptibility to Ovarian Cancer - a Meta-analysis. Asian Pacific Journal of Cancer Prevention. 2014; 15: 6131-6.
40. Yang F, Xiong J, Jia XE, Gu ZH, Shi JY, Zhao Y, Li JM, Chen SJ, Zhao WL. GSTT1 Deletion Is Related to Polycyclic Aromatic Hydrocarbons-Induced DNA Damage and Lymphoma Progression. Plos One. 2014; 9.
41. Lando M, Wilting SM, Snipstad K, Clancy T, Bierkens M, Aarnes EK, Holden M, Stokke T, Sundfor K, Holm R, Kristensen GB, Steenbergen RD, Lyng H. Identification of eight candidate target genes of the recurrent 3p12-p14 loss in cervical cancer by integrative genomic profiling. J Pathol. 2013; 230: 59-69.
42. Yang N, Wang Y, Hui L, Li XT, Jiang XJ. Silencing SOX2 Expression by RNA Interference Inhibits Proliferation, Invasion and Metastasis, and Induces Apoptosis through MAP4K4/JNK Signaling Pathway in Human Laryngeal Cancer TU212 Cells. Journal of Histochemistry & Cytochemistry. 2015; 63: 721-33.
43. Fantes J, Ragge NK, Lynch SA, McGill NI, Collin JRO, Howard-Peebles PN, Hayward C, Vivian AJ, Williamson K, van Heyningen V, FitzPatrick DR. Mutations in SOX2 cause anophthalmia. Nature Genetics. 2003; 33: 461-3.
44. Gen Y, Yasui K, Zen Y, Zen K, Dohi O, Endo M, Tsuji K, Wakabayashi N, Itoh Y, Naito Y, Taniwaki M, Nakanuma Y, Okanoue T, et al. SOX2 identified as a target gene for the amplification at 3q26 that is frequently detected in esophageal squamous cell carcinoma. Cancer Genetics and Cytogenetics. 2010; 202: 82-93.
45. Miyawaki Y, Kawachi H, Ooi A, Eishi Y, Kawano T, Inazawa J, Imoto I. Genomic copy-number alterations of MYC and FHIT genes are associated with survival in esophageal squamous-cell carcinoma. Cancer Science. 2012; 103: 1558-66.
46. Song YM, Li L, Ou YW, Gao ZB, Li EM, Li XC, Zhang WM, Wang JQ, Xu LY, Zhou Y, Ma XJ, Liu LY, Zhao ZT, et al. Identification of genomic alterations in oesophageal squamous cell cancer. Nature. 2014; 509: 91-+.
47. Shahryari A, Rafiee MR, Fouani Y, Oliae NA, Samaei NM, Shafiee M, Semnani S, Vasei M, Mowla SJ. Two Novel Splice Variants of SOX2OT, SOX2OT-S1, and SOX2OT-S2 are Coupregulated with SOX2 and OCT4 in Esophageal Squamous Cell Carcinoma. Stem Cells. 2014; 32: 126-34.
48. Askarian-Amiri ME, Seyfoddin V, Smart CE, Wang JL, Kim JE, Hansji H, Baguley BC, Finlay GJ, Leung EY. Emerging Role of Long Non-Coding RNA SOX2OT in SOX2 Regulation in Breast Cancer. Plos One. 2014; 9.
49. D’Haene B, Vandesompele J, Hellemans J. Accurate and objective copy number profiling using real-time quantitative PCR. Methods. 2010; 50: 262-70.
50. Chin SF, Teschendorff AE, Marioni JC, Wang Y, Barbosa-Morais NL, Thorne NP, Costa JL, Pinder SE, van de Wiel MA, Green AR, Ellis IO, Porter PL, Tavare S, et al. High-resolution aCGH and expression profiling identifies a novel genomic subtype of ER negative breast cancer. Genome Biol. 2007; 8: R215.
51. Burrell RA, McClelland SE, Endesfelder D, Groth P, Weller MC, Shaikh N, Domingo E, Kanu N, Dewhurst SM, Gronroos E, Chew SK, Rowan AJ, Schenk A, et al. Replication stress links structural and numerical cancer chromosomal instability (vol 494, pg 492, 2013). Nature. 2013; 500: 490-.