
Introduction
Cancers are characterized by rapid progress and have now become a major cause of morbidity and mortality in most region worldwide [1], despite the development of effective drugs and supportive care, the majority of cancers are characterized by their incurability, low overall survival, and recurrence [2]. Given this, a lot of biomarkers were carried out to help with prognosis of cancer [3-5].
Red blood cell distribution width (RDW) is a parameter usually reported in a complete blood cell count panels that contains RDW-SD (RDW standard deviation) and RDW-CV (RDW coefficient of variation) value, and it reflects the size heterogeneity of red blood cells. For several decades, it has been used to analyze and discriminate the types of anemia in clinical practices [6]. Recently, RDW was considered as a inflammatory associated marker, and emerging studies suggested it was an potential factor for predicting overall mortality in a variety of human inflammation diseases [7, 8].
It is well known that Inflammation is a hallmark of cancer [9], accumulating studies have investigated the role of RDW in patients with various cancer, and RDW was proved to be an independent prognosis factor in lung cancer [10], prostate cancer [11], chronic lymphocytic leukemia [12] and so on. However, different comments came into view with increasing researches referring to RDW and cancer [13, 14], and the reliability of RDW acting as a prognostic biomarker in various malignancies is being challenged. Therefore, the prognostic value of RDW in cancer patients remains controversial. In comparison to the limitation of single study, meta-analysis can provide a useful tool for the detection of effects that may be missed by individual studies. To date, no meta-analysis has been carried out to identify the prognostic value of RDW in cancer patients. Here, to better understand the role of RDW in cancer patients, a meta-analysis and a systematic review are performed to assess the correlation between RDW and the survival outcomes in cancer patients.
Results
Characteristics of included studies
As shown in Figure 1, a total of 350 articles meeting our included criteria were initially collected through our search strategy. After removed duplicate and irrelevant papers, a total of 16 articles were included in this analysis. For case ascertainment, fifteen articles [13-27] performed retrospective analysis (3953 participants), and one article [28] had both a retrospective design and a prospectively design in two independent patients population (314 participants). Therefore, a total of 16 articles including 17 studies with 4267 patients were included in this analysis with a median sample size of 179 (from 81 to 938). One study used RDW-SD for RDW [17] and others used RDW-CV. All studies were published between 2013 and 2016 in English peer-reviewed journals. These studies were from China, Japan, Italy, Korea, America, Turkey and Croatia, which evaluated various type of cancers, including four for esophageal cancer, three for lung cancer, two for hepatocellular carcinoma, two for breast cancer, one for multiple myeloma, one for diffuse large B-cell lymphoma, one for chronic myeloid leukemia, one for malignant mesothelioma, and one for upper tract urothelial Carcinoma.
3846 patients from fifteen studies reported OS, 616 patients from three studies reported CSS, 1096 patients from four studies reported DFS, 165 patients from two studies reported EFS and 146 patients from one studies reported PFS. Fourteen studies provided HR and 95% CI for OS, CSS, DFS and PFS, whereas three studies showed a survival curve for OS, one showed a survival curve for EFS, one showed a survival curve for DFS, and one summarized the total observed events and P value for DFS. The cutoff value of RDW in these studies was not uniform and ranged from 13.45 to 50. Fourteen studies used a cutoff value that was between 13.45 and 15, two studies used a cutoff value that was greater than 20. Age, tumor size and tumor stage at diagnosis are commonly investigated covariates that were adjusted for in Cox’s proportional-hazard model evaluation of the relationship between the RDW and survival. The characteristics of included studies were listed in Table 1.
Table 1: The characteristics of included studies
First author |
Year |
Country |
Ethnicity |
Cancer type |
Sample size |
Outcome |
Cutoff value |
HR |
NOS |
Koma[19] |
2013 |
Japan |
Asian |
Lung cancer |
332 |
OS |
15 |
Reported |
6 |
Abakay[15] |
2014 |
Turkey |
Caucasian |
Mesothelioma |
152 |
OS |
20 |
Reported |
6 |
Lee[13] |
2014 |
Korea |
Asian |
Multiple myeloma |
146 |
OS, PFS |
14.5 |
Reported |
7 |
Yao[21] |
2014 |
China |
Asian |
Breast cancer |
608 |
OS, DFS |
13.45 |
Reported |
7 |
Chen[16] |
2015 |
China |
Asian |
ESCC |
277 |
CSS |
14.5 |
Reported |
7 |
Cheng[27] |
2015 |
Taiwan |
Asian |
UTUC |
195 |
OS, CSS |
14 |
Reported |
7 |
Iriyama[18] |
2015 |
Japan |
Asian |
CML |
84 |
OS, EFS |
15 |
Estimated |
7 |
Perisa[20] |
2015 |
Croatia |
Caucasian |
DLBCL |
81 |
OS, EFS |
15 |
Reported |
7 |
Smirne[28] |
2015 |
Italy |
Caucasian |
Hepatocellular carcinoma |
106 and 208 |
OS |
14.6 |
Reported |
8 |
Xie[25] |
2015 |
America |
Caucasian |
Lung cancer |
938 |
OS |
15 |
Estimated |
7 |
Hirahara[17] |
2016 |
Japan |
Asian |
ESCC |
144 |
CSS |
50* |
Reported |
8 |
Huang[24] |
2016 |
China |
Asian |
Breast cancer |
203 |
OS, DFS |
13.75 |
Reported |
8 |
Kos[14] |
2016 |
Turkey |
Caucasian |
Lung cancer |
146 |
OS |
14.2 |
Estimated |
7 |
Sun[26] |
2016 |
China |
Asian |
ESCC |
362 |
OS |
13.6 |
Reported |
6 |
Wan[22] |
2016 |
China |
Asian |
ESCC |
179 |
OS, DFS |
15 |
Reported |
7 |
Zhao[23] |
2016 |
China |
Asian |
Hepatocellular carcinoma |
106 |
OS, DFS |
14.5 |
Reported |
7 |
Abbreviations: UTUC: upper tract urothelial carcinoma; CML: chronic myeloid leukemia; DLBCL: diffuse large B-cell lymphoma; ESCC, esophageal squamous cell carcinoma.
*: RDW was present as RDW-SD
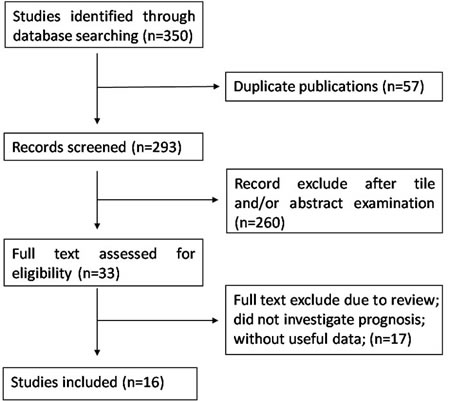
Figure 1: Flowchart presenting the steps of literature search and selection
Meta-analysis results
As shown in Figure 2, the combined results of 16 studies showed elevated RDW was associated with poor OS (HR = 1.47, 95%CI: 1.29-1.66) with a small heterogeneity (I2 = 34.5%, Pheterogeneity = 0.092). Figure 3 summarized HR for CSS (HR = 1.46, 95%CI:1.08-1.85), DFS (HR = 1.91, 95%CI:1.27-2.56), EFS (HR = 2.98, 95%CI:0.57-5.39) and PFS (HR = 3.21 , 95%CI:-0.33-6.75), and there were no heterogeneity between the studies (I2 = 0, Pheterogeneity = 0.843; I2 = 0, Pheterogeneity = 0.412; I2 = 0, Pheterogeneity = 0.642).
Subgroup analysis for OS was also performed stratified by cancer type, sample size, cutoff value and ethnicity. As shown in Table 2, however, the summary HR remained significant in the subgroup.
Table 2: Subgroup analysis of the associations between RDW and overall survival.
Subgroup |
No. of studies |
HR (95%CI) |
P |
Model |
Heterogeneity |
|
I2(%) |
P |
|||||
Caner types |
||||||
Hepatocellular carcinoma |
3 |
2.25(1.70,2.80) |
0.000 |
Fixed |
24.3% |
0.267 |
ESCC |
2 |
1.46(0.97,1.95) |
0.000 |
Fixed |
0% |
0.456 |
Breast cancer |
2 |
2.49(0.38,4.59) |
0.020 |
Fixed |
0% |
0.475 |
Lung cancer |
3 |
1.32(1.09,1.56) |
0.000 |
Fixed |
0% |
0.540 |
Hematologic malignancies |
3 |
1.07(0.15,1.99) |
0.023 |
Fixed |
0% |
0.399 |
Other |
2 |
2.78(1.42,4.14) |
0.000 |
Fixed |
0% |
0.993 |
Sample size |
||||||
<200 |
9 |
1.57(1.20,1.94) |
0.000 |
Fixed |
39.5% |
0.104 |
≥200 |
6 |
1.46(1.23,1.68) |
0.000 |
Fixed |
35.1% |
0.174 |
Cutoff value |
||||||
13≤ and >14 |
3 |
1.45(0.93-1.97) |
0.000 |
Fixed |
0% |
0.471 |
14≤ and >15 |
6 |
1.87(1.20-2.53) |
0.000 |
Random |
65.1% |
0.014 |
=15 |
5 |
1.39(1.14-1.65) |
0.000 |
Fixed |
0% |
0.589 |
>15 |
1 |
2.77(0.41-5.13) |
0.021 |
- |
- |
- |
Ethnicity |
||||||
Caucasian |
6 |
1.80(1.20,2.41) |
0.000 |
Random |
62.5% |
0.021 |
Asian |
9 |
1.59(1.23,1.96) |
0.000 |
Fixed |
0 |
0.494 |
Abbreviations: ESCC: esophageal squamous cell carcinoma; No.: number; HR: hazard ratio; CI: confidence interval. Random-effects model was employed when the p-value for heterogeneity test< 0.05.
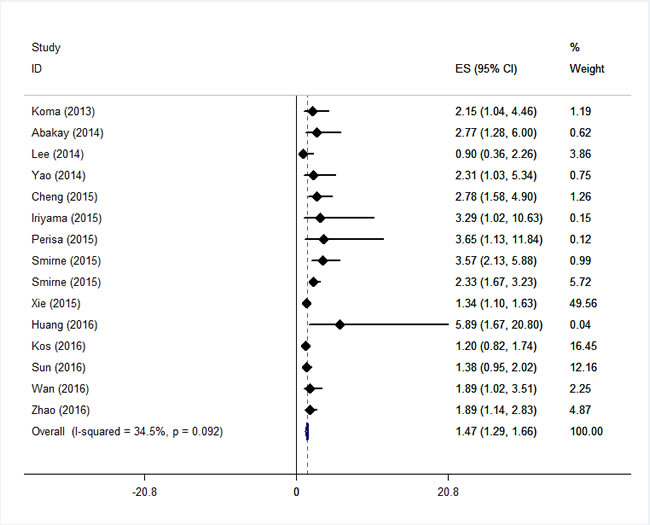
Figure 2: Forest plot for the association between RDW and the overall survival of patients with cancers.
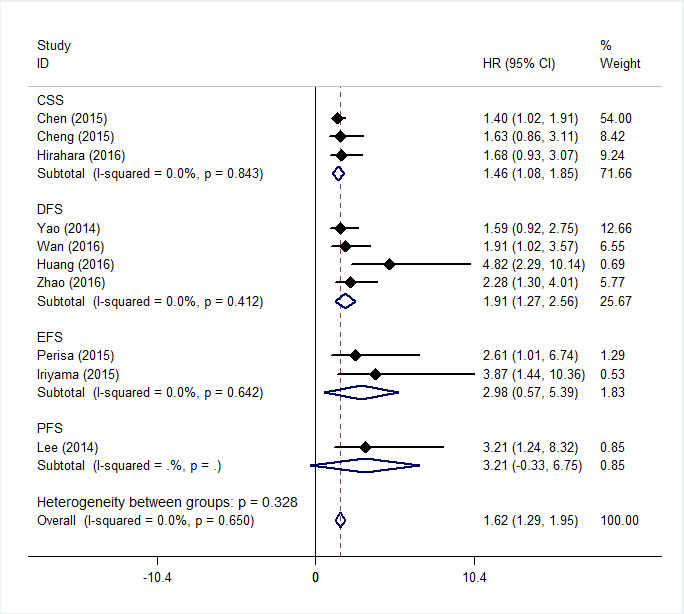
Figure 3: Forest plot for the association between RDW and the CSS, DFS, EFS and PFS of patients with cancer.
Publication bias
To assess publication bias in this study, the included studies were conducted by using Begg’s funnel plots and Egger’s test. The funnel plot for OS was asymmetry (Figure 4) and the result of Begg’s (P = 0.138) and Egger’s (P = 0.019) test indicated the possibility of publication bias. However, the pooled HR of 1.56 (95% CI, 1.26-1.99) obtained from trim and fill method was remained statistically significant with a symmetrical funnel plot (Figure 5), indicating that our results were robust and not affected by publication bias. Additionally, no publication bias was identified by Begg’s and Egger’s test for DFS (P = 0.308, P = 0.125) and CSS (P = 1.000, P = 0.121).
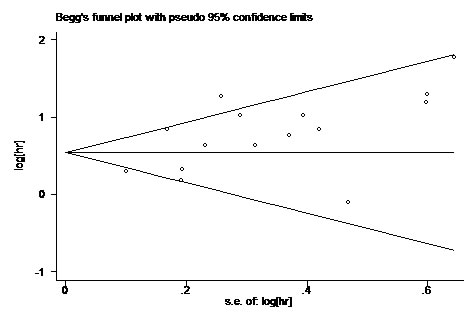
Figure 4: Begg’s Funnel plot analysis of potential publication bias.
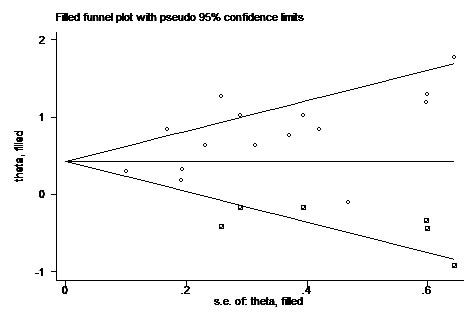
Figure 5: Funnel plot with trim and fill. Circle represent identified studies, square represent estimated missing studies after adjustment for publication bias.
Discussion
This meta analysis included 17 studies with a total of 4267 patients to clarify the prognostic value of RDW in the pretreatment patients with cancer. The combined results indicated that elevated RDW significantly predicted poor OS, poor CSS, poor DFS, poor EFS and poor PFS of patients with cancer. Furthermore, the similar results were observed in subgroup analysis stratified by cancer type, cutoff value of RDW, sample size and ethnicity .To our knowledge, this was the first meta-analysis to explore the prognostic value of RDW in patients with cancers.
Cancer associated inflammation is recognized as a hallmark feature of tumor development and progression [9]. A lot of tumor secreted factors and cytokines secreted by inflammatory cells in the tumor microenvironment can influence the tumor cell proliferation, survival, drug resistance and migration. In the meanwhile, a variety of inflammation associated markers were carried out in the hope of developing cost-effective prognostic biomarkers in cancer patients [4, 5, 29]. RDW was found to have a strong, graded association with circulating high-sensitivity C-reactive protein (hsCRP) and erythrocyte sedimentation rate (ESR), which were the two most widely used plasma inflammatory biomarkers, in a large cohort of unselect adult outpatients [30]. Besides, in the healthy population, RDW correlated with inflammatory parameters such as plasma viscosity, ESR, fibrinogen, leukocyte and neutrophil counts [31]. And recently, RDW has emerged as a consistent and strong predictor of overall and disease-specific mortality in middle-age and older adults [8]. Based on these results, the prognostic value of RDW was investigated in a variety of cancer patients and gathering evidences suggested that RDW was an independent factor for prognosis [32, 33]. The mechanism remains unknown, but may be that, firstly, RDW correlated with IL-6, tumor necrosis factor-alpha, hepcidin and other circulating cytokines that can affect the tumor cell biological behavior [34, 35]; secondly, RDW may present the constitutive level of IGF-1 signaling, the critical factor accountable for metabolic aging and longevity [12]; thirdly, RDW showed the nutritional status of patients including iron, folate, and vitamin B12 [22], and lower RDW was associated with poor nutritional status which was another hallmark of cancer [36]. Furthermore, RDW is easily obtained from complete blood cell count panels, which is cost-effective, reproducible and automated. Thus, RDW is a promising prognostic inflammation marker helpful for the clinical decision-making process regarding cancer outcomes.
Nevertheless, several limitations of this study must be carefully considered (1) the major limitation of this meta-analysis was that tumor types included in this study were limited and the number of studies dealing with each type of cancers was ≤5, so that the results of the specific carcinomas might be less powerful; (2) the studies were almost retrospective and all were published in English, which was more susceptible to some biases; (3) the cutoff values of RDW were different; (4) studies lacking sufficient data were also excluded from the meta-analysis.
In conclusion, this is the first meta-analysis revealed that elevated RDW was an unfavorable predictor of prognosis in patients with cancers. However, due to the limitations uncovered in the present study, the results of our meta-analysis might be estimations. Future larger-scale prospective and standard investigations should be conducted to confirm these results.
materials and Methods
Literature collection
Two independently authors (LH, Hu and MM, Li) used the terms and combinations included: (“RDW” or “red blood cell distribution width”) and (“cancer” or “tumor” or ”carcinomas” or ”neoplasm”) and (prognosis or outcome or survival or mortality or recurrence or progression or metastasis) to identify studies in the databases of Web of Science, Embase, Pubmed and Cochrane Library, the detailed search strategy was included in supplementary files. The publication language was limited to English and the latest search was updated on July 15, 2016.
Inclusion and exclusion criteria
The inclusion criteria are the following: (1) the role of RDW in cancer patients were investigated, (2) RDW was measured by blood-based methods without any formal treatment; (3) patients were divided into two groups according to cutoff values of RDW; (4) studies reported or containing sufficient data for the computation of hazard ratios (HR) and corresponding 95% confidence intervals (CI) for overall survival (OS) or (disease-free survival) DFS/(event-free survival) EFS/(progress-free survival) PFS/(cancer-specific survival) CSS.
The exclusion criteria are the following: 1) review, meeting abstract, letter, not full text in English; 2) duplicate publications; 3) nonhuman studies; 4) studies without usable data.
Data extraction
Two independent authors (LH, Hu and MM, Li) extracted the following information from the eligible studies: first author, year of publication, study country, cancer type, sample size, cutoff value of RDW, and survival data. Disagreements were resolved by joint discussion.
Quality assessment
The Newcastle-Ottawa Quality Assessment Scale (NOS) [37] was used to assess the quality of each study by two independent investigators (LH, Hu and MM, Li). The NOS contains three parts: selection (four points), comparability (two points), and outcome assessment (three points).
Statistical analysis
The hazard ratio (HR) with 95% confidence intervals(95% CI) were directly obtained from the articles or estimate according to the method introduced by Tierney et al [38]. If there were more than one cutoff value of RDW, the HR and 95% CI belonging to the cutoff value which divided patients into the same size ratio were included. Get Data Graph Digitizer ( http://getdata-graph-digitizer.com/ ) were used to obtain the data from the survival curve. Cochran Q test and I2 statistic were used to identify the heterogeneity among the included studies. If heterogeneity was significant (Cochran Q test: p value< 0.10 or I2> 50%), the random-effects model was used to estimate the pooled HR, and if not, the fixed-effects model was used. Publication bias was evaluated by using Begg’s test and Egger’s test. Trim-and-fill method was employed to further assess the possible effect of publication bias [39]. All statistical analyses were performed by using Stata 12 (Stata Corp., College Station, Texas) and P< 0.05 was considered statistically significant.
Abbreviations
RDW: red blood cell distribution width, HR: hazard ratio, CI: confidence interval, OS: overall survival, DFS: disease-free survival, CSS: cancer-specific survival, EFS: event-free survival, PFS: progression-free survival, UTUC: upper tract urothelial carcinoma; CML: chronic myeloid leukemia; DLBCL: diffuse large B-cell lymphoma; ESCC: esophageal squamous cell carcinoma.
Acknowledgments
This work was partly supported by National Science Foundation of China (81272259), the Foundation of Anhui Medical University (2015xkj115) and Anhui Provincial outstanding young talent fund project(2012SQRL071).
Conflicts of interest
The authors declare that there is no conflict of interests regarding the publication of this paper.
References
1. Bray F, Ren JS, Masuyer E, Ferlay J. Global estimates of cancer prevalence for 27 sites in the adult population in 2008. Int J Cancer. 2013; 132: 1133-45. doi: 10.1002/ijc.27711.
2. Chen W, Zheng R, Baade PD, Zhang S, Zeng H, Bray F, Jemal A, Yu XQ, He J. Cancer statistics in China, 2015. CA Cancer J Clin. 2016; 66: 115-32. doi: 10.3322/caac.21338.
3. Garzon R, Volinia S, Papaioannou D, Nicolet D, Kohlschmidt J, Yan PS, Mrózek K, Bucci D, Carroll AJ, Baer MR, Wetzler M, Carter TH, Powell BL, et al. Expression and prognostic impact of lncRNAs in acute myeloid leukemia. Proceedings of the National Academy of Sciences. 2014; 111: 18679-84. doi: 10.1073/pnas.1422050112.
4. Kim SH, Lee HW, Go SI, Lee SI, Lee GW. Clinical significance of the preoperative platelet count and platelet-to-lymphocyte ratio (PLT-PLR) in patients with surgically resected non-small cell lung cancer. Oncotarget. 2016; 7:36198-36206. doi: 10.18632/oncotarget.8809.
5. Chan JC, Chan DL, Diakos CI, Engel A, Pavlakis N, Gill A, Clarke SJ. The Lymphocyte-to-Monocyte Ratio is a Superior Predictor of Overall Survival in Comparison to Established Biomarkers of Resectable Colorectal Cancer. Ann Surg. 2016. doi: 10.1097/SLA.0000000000001743.
6. Salvagno GL, Sanchis-Gomar F, Picanza A, Lippi G. Red blood cell distribution width: A simple parameter with multiple clinical applications. Crit Rev Clin Lab Sci. 2015; 52: 86-105. doi: 10.3109/10408363.2014.992064.
7. Hu ZD, Sun Y, Wang QQ, Han ZJ, Huang YL, Liu XF, Ding CM, Hu CJ, Qin Q, Deng AM. Red blood cell distribution width is a potential prognostic index for liver disease. Clinical Chemistry And Laboratory Medicine. 2013; 51: 1403-8. doi: 10.1515/cclm-2012-0704.
8. Patel KV, Ferrucci L, Ershler WB, Longo DL, Guralnik JM. Red Blood Cell Distribution Width and the Risk of Death in Middle-aged and Older Adults. Archives Of Internal Medicine. 2009; 169: 515-23. doi:
9. Hanahan D, Weinberg RA. Hallmarks of cancer: the next generation. Cell. 2011; 144: 646-74. doi: 10.1016/j.cell.2011.02.013.
10. Warwick R, Mediratta N, Shackcloth M, Shaw M, McShane J, Poullis M. Preoperative red cell distribution width in patients undergoing pulmonary resections for non-small-cell lung cancer. Eur J Cardiothorac Surg. 2014; 45: 108-13. doi: 10.1093/ejcts/ezt275.
11. Albayrak S, Zengin K, Tanik S, Bakirtas H, Imamoglu A, Gurdal M. Red cell distribution width as a predictor of prostate cancer progression. Asian Pac J Cancer Prev. 2014; 15: 7781-4. doi:
12. Podhorecka M, Halicka D, Szymczyk A, Macheta A, Chocholska S, Hus M, Darzynkiewicz Z. Assessment of red blood cell distribution width as a prognostic marker in chronic lymphocytic leukemia. Oncotarget. 2016; 7:32846-53. doi: 10.18632/oncotarget.9055.
13. Lee H, Kong SY, Sohn JY, Shim H, Youn HS, Lee S, Kim HJ, Eom HS. Elevated red blood cell distribution width as a simple prognostic factor in patients with symptomatic multiple myeloma. Biomed Res Int. 2014; 2014: 145619. doi: 10.1155/2014/145619.
14. Kos M, Hocazade C, Kos FT, Uncu D, Karakas E, Dogan M, Uncu HG, Ozdemir N, Zengin N. Evaluation of the effects of red blood cell distribution width on survival in lung cancer patients. Contemp Oncol (Pozn). 2016; 20: 153-7. doi: 10.5114/wo.2016.60072.
15. Abakay O, Tanrikulu AC, Palanci Y, Abakay A. The value of inflammatory parameters in the prognosis of malignant mesothelioma. Journal Of International Medical Research. 2014; 42: 554-65. doi: 10.1177/0300060513504163.
16. Chen GP, Huang Y, Yang X, Feng JF. A Nomogram to Predict Prognostic Value of Red Cell Distribution Width in Patients with Esophageal Cancer. Mediators Of Inflammation. 2015. doi: 10.1155/2015/854670.
17. Hirahara N, Matsubara T, Kawahara D, Mizota Y, Ishibashi S, Tajima Y. Prognostic value of hematological parameters in patients undergoing esophagectomy for esophageal squamous cell carcinoma. Int J Clin Oncol. 2016. doi: 10.1007/s10147-016-0986-9.
18. Iriyama N, Hatta Y, Kobayashi S, Uchino Y, Miura K, Kurita D, Kodaira H, Takahashi H, Iizuka Y, Inoue M, Takei M. Higher Red Blood Cell Distribution Width Is an Adverse Prognostic Factor in Chronic-phase Chronic Myeloid Leukemia Patients Treated with Tyrosine Kinase Inhibitors. Anticancer Res. 2015; 35: 5473-8. doi:
19. Koma Y, Onishi A, Matsuoka H, Oda N, Yokota N, Matsumoto Y, Koyama M, Okada N, Nakashima N, Masuya D, Yoshimatsu H, Suzuki Y. Increased Red Blood Cell Distribution Width Associates with Cancer Stage and Prognosis in Patients with Lung Cancer. Plos One. 2013; 8. doi: 10.1371/journal.pone.0080240.
20. Perisa V, Zibar L, Sincic-Petricevic J, Knezovic A, Perisa I, Barbic J. Red blood cell distribution width as a simple negative prognostic factor in patients with diffuse large B-cell lymphoma: a retrospective study. Croatian Medical Journal. 2015; 56: 334-43. doi: 10.3325/cmj.2015.56.334.
21. Yao MY, Liu Y, Jin HL, Liu XJ, Lv KZ, Wei HY, Du CY, Wang SQ, Wei BJ, Fu PF. Prognostic value of preoperative inflammatory markers in Chinese patients with breast cancer. Oncotargets And Therapy. 2014; 7: 1743-52. doi: 10.2147/ott.s69657.
22. Wang R, Du L, Yang X, Jiang X, Duan W, Yan S, Xie Y, Zhu Y, Wang Q, Wang L, Yang Y, Wang C. Identification of long noncoding RNAs as potential novel diagnosis and prognosis biomarkers in colorectal cancer. J Cancer Res Clin Oncol. 2016. doi: 10.1007/s00432-016-2238-9.
23. Zhao T, Cui LJ, Li AJ. The significance of RDW in patients with hepatocellular carcinoma after radical resection. Cancer Biomarkers. 2016; 16: 507-12. doi: 10.3233/cbm-160591.
24. Huang DP, Ma RM, Xiang YQ. Utility of Red Cell Distribution Width as a Prognostic Factor in Young Breast Cancer Patients. Medicine. 2016; 95. doi: 10.1097/md.0000000000003430.
25. Xie D, Marks R, Zhang MR, Jiang GN, Jatoi A, Garces YI, Mansfield A, Molina J, Yang P. Nomograms Predict Overall Survival for Patients with Small-Cell Lung Cancer Incorporating Pretreatment Peripheral Blood Markers. Journal Of Thoracic Oncology. 2015; 10: 1213-20. doi: 10.1097/jto.0000000000000585.
26. Sun P, Zhang F, Chen C, Bi X, Yang H, An X, Wang F, Jiang W. The ratio of hemoglobin to red cell distribution width as a novel prognostic parameter in esophageal squamous cell carcinoma: a retrospective study from southern china. Oncotarget. 2016; 7:42650-42660. doi: 10.18632/oncotarget.9516.
27. Cheng YC, Huang CN, Wu WJ, Li CC, Ke HL, Li WM, Tu HP, Li CF, Chang LL, Yeh HC. The Prognostic Significance of Inflammation-Associated Blood Cell Markers in Patients with Upper Tract Urothelial Carcinoma. Ann Surg Oncol. 2016; 23: 343-51. doi: 10.1245/s10434-015-4781-z.
28. Smirne C, Grossi G, Pinato DJ, Burlone ME, Mauri FA, Januszewski A, Oldani A, Minisini R, Sharma R, Pirisi M. Evaluation of the red cell distribution width as a biomarker of early mortality in hepatocellular carcinoma. Digestive and Liver Disease. 2015; 47: 488-94. doi: 10.1016/j.dld.2015.03.011.
29. Romano A, Parrinello NL, Consoli ML, Marchionni L, Forte S, Conticello C, Pompa A, Corso A, Milone G, Di Raimondo F, Borrello I. Neutrophil to lymphocyte ratio (NLR) improves the risk assessment of ISS staging in newly diagnosed MM patients treated upfront with novel agents. Ann Hematol. 2015; 94: 1875-83. doi: 10.1007/s00277-015-2462-4.
30. Lippi G, Targher G, Montagnana M, Salvagno GL, Zoppini G, Guidi GC. Relation between red blood cell distribution width and inflammatory biomarkers in a large cohort of unselected outpatients. Arch Pathol Lab Med. 2009; 133: 628-32. doi: 10.1043/1543-2165-133.4.628.
31. Vaya A, Sarnago A, Fuster O, Alis R, Romagnoli M. Influence of inflammatory and lipidic parameters on red blood cell distribution width in a healthy population. Clin Hemorheol Microcirc. 2015; 59: 379-85. doi: 10.3233/CH-141862.
32. Riedl J, Posch F, Reitter EM, Eigenbauer E, Marosi C, Schwarzinger I, Zielinski C, Pabinger I, Ay C. Red Cell Distribution Width and Other Red Blood Cell Parameters in Patients with Cancer: Association with Risk of Venous Thromboembolism and Mortality. Blood. 2014; 124. doi:
33. Yilmaz A, Malya FU, Ozturk G, Citgez B, Ozdenkaya Y, Ersavas C, Agan AF, Senturk H, Karatepe O. Effect of pre-operative red blood cell distribution on cancer stage and morbidity rate in patients with pancreatic cancer. International Journal Of Clinical And Experimental Medicine. 2014; 7: 3072-5. doi:
34. Rhodes CJ, Howard LS, Busbridge M, Ashby D, Kondili E, Gibbs JS, Wharton J, Wilkins MR. Iron deficiency and raised hepcidin in idiopathic pulmonary arterial hypertension: clinical prevalence, outcomes, and mechanistic insights. J Am Coll Cardiol. 2011; 58: 300-9. doi: 10.1016/j.jacc.2011.02.057.
35. de Gonzalo-Calvo D, de Luxan-Delgado B, Rodriguez-Gonzalez S, Garcia-Macia M, Suarez FM, Solano JJ, Rodriguez-Colunga MJ, Coto-Montes A. Interleukin 6, soluble tumor necrosis factor receptor I and red blood cell distribution width as biological markers of functional dependence in an elderly population: a translational approach. Cytokine. 2012; 58: 193-8. doi: 10.1016/j.cyto.2012.01.005.
36. Tete S, Nicoletti M, Saggini A, Maccauro G, Rosati M, Conti F, Cianchetti E, Tripodi D, Toniato E, Fulcheri M, Salini V, Caraffa A, Antinolfi P, et al. Nutrition and cancer prevention. Int J Immunopathol Pharmacol. 2012; 25: 573-81. doi:
37. GA Wells, B Shea, D O’Connell, J Peterson, V Welch, M Losos, Tugwell P. The Newcastle-Ottawa Scale (NOS) for assessing the quality ofnonrandomised studies in metaanalyses. URL: http://www.ohri.ca/programs/clinical_epidemiology/oxford.asp. doi:
38. Tierney JF, Stewart LA, Ghersi D, Burdett S, Sydes MR. Practical methods for incorporating summary time-to-event data into meta-analysis. Trials. 2007; 8: 16. doi: 10.1186/1745-6215-8-16.
39. Duval S, Tweedie R. Trim and fill: A simple funnel-plot-based method of testing and adjusting for publication bias in meta-analysis. Biometrics. 2000; 56: 455-63. doi: