
INTRODUCTION
RNA editing is a post-transcriptional modification that changes the genomic template through the insertion, deletion, deamination or substitution of nucleotides within the edited RNA molecule. Among the five types of RNA editing reported so far, the modification from adenosine to inosine, the so-called “A-to-I” editing, is the most common one [1, 2]. This type of editing is catalyzed by the enzyme called “adenosine deaminase” (ADAR) [3] as shown in Figure 1. The concrete process is: adenosine is deaminated to inosine, followed by decoding to become guanosine (G) due to the polymerase enzyme and translational machinery [4].
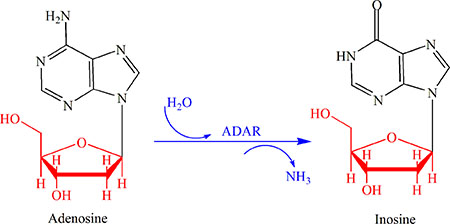
Figure 1: An illustration to show the most common type of RNA editing, a modification from adenosine (A) to inosine (I) or the “A-to-I editing” that is catalyzed by the adenosine deaminase (ADAR). See the text for further explanation.
Besides altering the genetic code that can expand the transcriptome and proteome, the A-to-I editing may also involve in various important biological processes ranging from alternative splicing [5], nonsense-mediated mRNA decay [6] to gene expression and translation [7]. RNA secondary and teritary structures may also be affected by A-to-I editing [8]. In addition, RNA A-to-I editing was also found to be closely associated with the formation of cancers [9–11] and a series of major diseases by editing of glutamate receptors, editing of serotonin receptors and by other mechanisms [12]. Therefore, knowledge about the A-to-I editing sites in RNA is crucially important for both basic research and drug development.
Although the experimental method called “RNA-Seq” is a powerful tool for determining the RNA editing candidates [13, 14], it is time-consuming. Besides, since the A-to-I editing sites determined by the RNA-Seq tool are derived indirectly from the A-to-G sites rather than directly from the original A-to-I sites themselves, it is very difficult to discriminate RNA editing events from the case of A-to-G mutations in the single-nucleotide polymorphism (SNP) [15] that simply does not exist in the reference genome. And hence the A-to-I editing sites obtained by RNA-Seq often include many false positive ones.
Therefore, it would be very useful for in-depth genome analysis or drug development to develop a sequence-based computational method that can effectively predict which adenosine sites in a RNA sequence can be “A-to-I” edited, and which ones cannot.
The present study was devoted to address this problem.
RESULTS AND DISCUSSION
A computational method called “iRNA-AI” has been developed. It is the first predictor ever established by using the computational approach and sequence information alone to identify human A-to-I editing sites.
Rigorous cross-validations on a well-established benchmark dataset (Supporting Information S1) have shown that the iRNA-AI predictor can achieve very high scores in sensitivity (Sn), specificity (Sp), overall accuracy (Acc), and stability (MCC); i.e.,
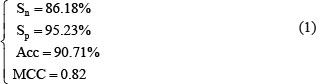
For the rigorous but intuitive definitions about Sn, Sp, Acc, and MCC, see Eq.16 given later.
Since so far there is no other existing computational method whatsoever for predicting the A-to-I editing sites in RNA of human transcriptome, it is not possible to show the predictor’s power by the comparison manner between counterparts. Nevertheless, the power of iRNA-AI and its quality can be examined via a practical application on a set of experiment-confirmed independent dataset (Supporting Information S2), which contains 3,243 true A-to-I editing sites and 3,243 false A-to-I editing sites. The corresponding success rates thus obtained are given by
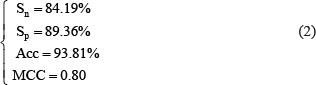
The above results indicate that the success rates achieved by the predictor iRNA-AI on the independent dataset of Supporting Information S2 are quite consistent with those via the jackknife test on the benchmark dataset of Supporting Information S1.
For the convenience of most experimental scientists, the web-server of iRNA-AI has been established at http://lin.uestc.edu.cn/server/iRNA-AI/.
Moreover, to maximize the users’ convenience, a step-by-step guide has been provided in Supporting Information S3, by which users can easily get their desired results.
Because knowledge about the positions of A-to-I editing sites would be of great help for in-depth understanding the biological functions and processes concerned. It is anticipated that iRNA-AI will become a useful high throughput tool for understanding the biological significance of A-to-I RNA editing, or at the very least, a complementary tool to the existing experimental methods in this regard.
Although the detailed ADAR’s action mechanism is not well understood yet, the crystal structure of human ADAR has been solved (PDB code: 3IAR) that provides structural basis for the elucidation of its catalytic mechanisms and its specific recognition of the target sequence. Since both computational biology and structural biology have made great contributions to understand enzyme activities and catalytic mechanisms [16, 17], it is anticipated that the current iRNA-AI predictor will become a useful tool for revealing the catalytic mechanism of ADAR.
MATERIALS AND METHODS
Prediction is always difficult, particularly in dealing with a complicated biological system as studied here. Nevertheless, a prediction method would be deemed rewarding or successful if it could timely help getting some useful information or stimulate and inspire some other relevant methods. To realize this, we should make the following five procedures very clear as done in a series of recent publications [18–29] according to the Chou’s 5-step rules [30]: (1) how to construct or select a valid benchmark dataset to train and test the model; (2) how to formulate the biological sequence samples with an effective mathematical expression that can truly reflect their essential correlation with the target concerned; (3) how to introduce or develop a powerful algorithm (or engine) to run the prediction; (4) how to properly conduct cross-validation tests to objectively evaluate the anticipated accuracy; (5) how to provide a web-server and user guide to make people very easily to get their desired results. Since the content about the web-server has already been described in the RESULTS AND DISCUSSION section, below let us address the other four procedures one-by-one.
Benchmark dataset
For facilitating formulation, the Chou’s sequential scheme [31] was adopted. It was successfully used to study signal peptide cleavage sites [32, 33], hydroxyproline and hydroxylysine sites [22, 34], methylation sites [35–37], nitrotyrosine sites [38, 39], carbonylation sites [19], phosphorylation sites [24], sumoylation sites [29], and protein-protein binding sites [40, 41]. According to Chou’s scheme, a potential RNA A-I editing site sample can be generally expressed by

where the symbol  denotes the single nucleic acid code A (adenine), the subscript ξ is an integer, N– ξ represents the ξ-th upstream nucleotide from the center, the N+ ξ the ξ-th downstream nucleotide, and so forth. The (2ξ + 1)-tuple RNA sample
  can be further classified into the following two categories:
where  denotes a true A-to-I editing segment with A at its center,
  a false one with A at its center, and the symbol
  means “a member of” in the set theory.
The benchmark dataset is derived from DARNED database [42] that contains 333,216 A-to-I editing sites confirmed by experiments. The detailed procedures to construct the benchmark dataset are as follows. (1) As done in [43], by sliding the (2ξ + 1)-tuple nucleotide window (Figure 2) along each of the RNA sequences taken from DARNED database, collected were only those RNA segments with  at the center. (2) The RNA segment samples thus obtained were marked with a positive label if their centers were experimentally annotated as the A-to-I editing sites, while those with a negative label if their centered adenosine could not be edited to inosine as confirmed by experiments. (3) To reduce redundancy or homology bias, we used the CD-HIT program [44] to remove those RNA segments that had 60% pairwise sequence identity with any other in a same-labeled group. By strictly following the above procedures, we obtained an array of benchmark datasets with different ξ values, and hence different lengths of RNA samples as well (see Eq.3), as illustrated below
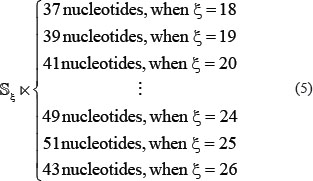
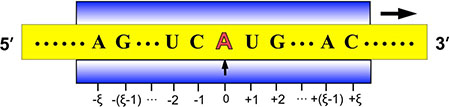
Figure 2: Illustration to show the sequence segments highlighted by sliding the scaled window  along a RNA sequence. During the sliding process, the scales on the window are aligned with different nucleotides so as to define different (2ξ + 1) -nt RNA samples. Adapted from Chou [43] with permission. See the text for further explanation.
In Eq.5 the symbol  means “formed by”. But it was observed via preliminary tests that when
  (i.e., the RNA samples formed by 51 nucleotides), the corresponding successful scores (see Eq.16 later) were most promising. Accordingly, hereafter we only consider the 51-tuple nucleotide samples.
After going through the above procedures, we obtained 6,243 positive label samples, from which we randomly picked out 3,000 to form the positive subset for the benchmark dataset. But keep it in mind that the remaining 3,243 samples would be used later for other purpose.
The corresponding negative label samples were substantially more than the positive ones. Although this reflects the fact that in the real world most adenosine nucleotides in RNA cannot be edited to inosine, a machine learning predictor trained by an imbalanced or highly skewing benchmark dataset may negatively affect its performance [36, 45]. To balance out the numbers between positive and negative samples for model training, we also randomly picked out 3,000 negative label samples to form the negative subset for the benchmark dataset. Thus, the benchmark dataset  can be formulated as

where the positive subset  contains 3,000 true A-to-I editing site-containing RNA sequences, while the negative subset
  contains 3,000 false A-to-I editing site-containing RNA sequences, and
  denotes the symbol of “union” in the set theory [46].
The detailed sequences for the samples in the benchmark dataset are given in Supporting Information S1.
In literature the benchmark dataset usually consists of a training dataset and a testing dataset: the former is for the usage of training a model, while the latter for testing the model. But as elucidated in a comprehensive review [46], there is no need to artificially separate a benchmark dataset into the two parts if the prediction model is examined by the jackknife test or subsampling (K-fold) cross-validation since the outcome thus obtained is actually from a combination of many different independent dataset tests. According to such a point of view, it is enough to use the benchmark dataset of Eq.6 alone for the current study. It is instructive, however, to use the proposed predictor on an independent dataset for demonstrating its practical application. The independent dataset  can be formulated as

where the positive independent subset  contains the remaining 3,243 samples mentioned above, while the negative independent subset
  also contains 3,243 samples constructed in a way similar to that of
  in Eq.6. None of the samples in the independent dataset
  occurs in the benchmark dataset
  .
.
The detailed sequences for the samples in the independent dataset are given in Supporting Information S2.
Formulation of RNA samples
With the avalanche of biological sequences emerging in the post-genomic era, one of the most challenging problems in computational biology is how to formulate a biological sequence with a discrete model or vector that can, however, reflect its essential sequence pattern or feature. This is indeed indispensible since nearly all the existing machine-learning algorithms were devised to handle vectors but not sequences, as elucidated in a recent review [47]. Unfortunately, a biological sequence expressed with a vector might totally lose its sequence-order information [48] and sequence pattern features as well. To deal with such a problem for protein/peptide sequences, the pseudo amino acid composition (PseAAC) [49–51] was proposed. Ever since the concept of PseAAC was proposed in 2001 [48], it has been widely used in nearly all the areas of computational proteomics (see the long lists of papers cited in two review papers [51, 52]. Inspired by its great successes, the concept of PseAAC has been extended to cover DNA/RNA sequences as well by introducing the pseudo K-tuple nucleotide composition (PseKNC) [53, 54], which has been proved very useful in computational genetics/genomics [55, 56] as well as conducting various genome analyses (see, e.g., [26, 28, 57–64] and a review article [65]). Also, because the approach of pseudo components has been increasingly used in both computational proteomics and genomics, a very powerful web-server called “Pse-in-One” [66] has been established that can be used to generate various modes of pseudo components for both protein/peptide and DNA/RNA sequences.
According to [65], the general form of PseKNC for an RNA sequence sample can be expressed as

where T is a transpose operator, while the subscript Z is an integer and its value as well as the components 
 will depend on how to extract the desired information from the RNA sequence sample concerned. To enable Eq.8 to reflect both the short- and long-range sequence coupling information within the RNA sample, we are to use the nucleotide chemical property and nucleotide density to define its components as described below.
Physicochemical properties of nucleotides
RNA is formed by four types of nucleotides: A (adenosine), C (cytidine), G (guanosine), and U (uridine). Among the four types: (1) A and G have two rings, whereas C and U only one; (2) from the angle of chemical functionality, A and C can be categorized as amino group, while G and U as keto group; (3) in forming the secondary or tertiary structure, there are three hydrogen bonds between C and G but only two between A and U (Figure 3), and hence, the former is stronger than the latter in hydrogen bonding, which would play different roles for the low-frequency vibration [67, 68] and its biological function accordingly [69, 70]. Therefore, the four types of nucleotides can be classified into three different groups as shown in Table 1.
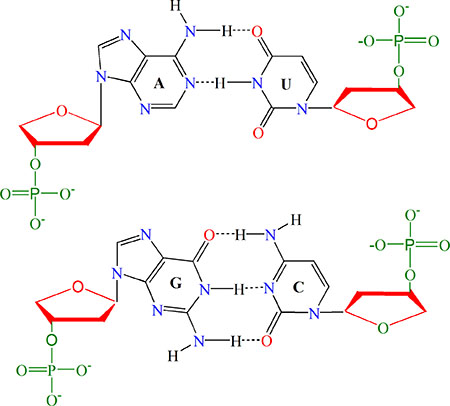
Figure 3: Illustration to show the structure of paired nucleic acid residues. The upper panel is the A-U pair bonded to each other with two hydrogen bonds; the lower panel is the G-C pair with three hydrogen bonds. It can also be seen from the figure that A and G have two rings, while C and U have one ring. Also, according to chemical functionality, A and C can be classified into the amino group, while G and U into the keto group. See the main text for further explanation.
Table 1: Nucleotide chemical propertya
Physicochemical property |
Classification |
Nucleotides |
|---|---|---|
Ring structure |
Purine |
A, G |
Pyrimidine |
C, U |
|
Functional group |
Amino |
A, C |
Keto |
G, U |
|
Hydrogen bonding |
Stronger |
C, G |
Weaker |
A, U |
aSee the section of “Physicochemical Properties of Nucleotides” for further explanation.
Similar to the approach used in analyzing the codon usage for HIV proteins [71] and E. Coli proteins [72], to reflect the aforementioned features, let us formulate the i-th nucleotide of Eq.3 by

where xi, yi, and zi refer to the “ring structure”, “functional group”, and “hydrogen bonding” in Table 1, respectively; i.e.,
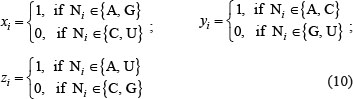
Thus, the nucleotide A can be formulated as (1, 1, 1), C as (0, 1, 0), G as (1, 0, 0), and U as (0, 0, 1).
Distribution density of nucleotides
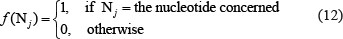
To reflect the occurrence frequency of a nucleotide and its distribution along the sequence of a RNA sample, we use the following equations
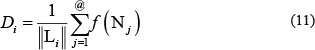
where Di is the density of the nucleotide Ni at the site i of a RNA sequence, Li the length of the sliding substring concerned, @ denotes each of the site locations counted in the substring, and
For instance, suppose a RNA sequence “ACGUA”. The density of “A” at the sequence position 1, 2, 3, 4, or 5 is  ,
,  ,
,  ,
,  , or
, or  , respectively; that of “C” is
  ,
,  ,
,  ,
,  , or
, or  , respectively; and so forth.
By combing Eq.9 and Eq.11, the i-th nucleotide of Eq.3 can be uniquely defined by a set of four variables; i.e.,

Accordingly, the RNA sequence “ACGUA” can be successively expressed by the following five sets of digital numbers: (1, 1, 1, 1), (0, 1, 0, 0.5), (1, 0, 0, 0.33), (0, 0, 1, 0.25) and (1, 1, 1, 0.4). Or, according to the general form of PseKNC (Eq.8), it can be expressed as

meaning that the 5-tuple nucleotide example can be defined by a 5 × 4 = 20-D (dimensional) PseKNC vector.
Consequently, a 51-nt RNA sample in the current benchmark dataset can be formulated with a 51 × 4 = 204- D vector.
Support vector machine (SVM) operation engine
Being a machine learning algorithm based on statistical learning theory, SVM has been widely and successfully used in the realm of bioinformatics [58, 62, 73–75] and computational biology [18, 36, 59–61, 76]. The basic idea of SVM is to transform the input data into a high dimensional feature space and then determine the optimal separating hyperplane. For a brief formulation of SVM and how it works, see the papers [77, 78]; for more details about SVM, see a monograph [79].
In the current study, the LibSVM package 3.18 was used to implement SVM, which can be freely downloaded from http://www.csie.ntu.edu.tw/~cjlin/libsvm/. Because of its effectiveness and fast speed in training process, the radial basis kernel function (RBF) was used to obtain the best classification hyperplane here. In the SVM operation engine, the regularization parameter C and the kernel width parameter γ were optimized via an optimization procedure using the grid search approach as described by
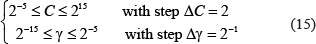
where  and
and  represent the step gaps for C and
  respectively.
The predictor obtained via the above process is called iRNA-AI, where ‘‘i’’ stands for ‘‘identify”, and ‘‘AI’’ for ‘‘A-to-I editing” sites in RNA sequence.
Prediction quality examination
How to objectively evaluate the anticipated success rates is an indispensible step in developing a new predictor [30]. To address this, we need to consider two issues: one is what metrics should be used to reflect the predictor’s success rates; the other is what test method should be adopted to derive the metrics rates.
To quantitatively evaluate the quality of a binary classification predictor, four metrics are generally needed [80]. They are: (1) Acc for the predictor’s overall accuracy; (2) MCC for its stability; (3) Sn for its sensitivity; and (4) Sp for its specificity. Unfortunately, the conventional formulations for the four metrics are not quite intuitive and most experimental scientists feel difficult to understand them, particularly the stability of MCC. Fortunately, as elaborated in [59, 81], by using the Chou’s symbols and derivation in studying signal peptides [82], the conventional metrics can be converted into a set of four intuitive equations, as formulated below:
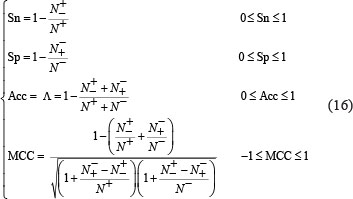
where  represents the total number of A-to-I editing samples investigated, while
  is the number of true A-to-I eting samples incorrectly predicted to be of non-A-to-I editing sample;
  the total number of the non-A-to-I editing samples investigated, while
  the number of the non-A-to-I editing samples incorrectly predicted to be of true A-to-I editing sample.
Now it is crystal clear to see the following from Eq.16. When  meaning none of the true A-to-I editing samples are incorrectly predicted to be of non-A-to-I editing sample, we have the sensitivity Sn = 1. When
  meaning that all the true A-to-I editing samples are incorrectly predicted to be of non-A-to-I editing sample, we have the sensitivity Sn = 0. Likewise, when
  meaning none of the non-A-to-I editing samples are incorrectly predicted to be of true-A-to-I editing sample, we have the specificity Sp = 1; whereas
  meaning that all the non-A-to-I editing samples are incorrectly predicted to be of true A-to-I editing samples, we have the specificity Sn = 0. When
  meaning that none of true A-to-I editingsamples in the positive dataset and none of the non-A-to-I editing samples in the negative dataset are incorrectly predicted, we have the overall accuracy Acc = 1 and MCC = 1; when
  and
and  meaning that all the true A-to-I editing samples in the positive dataset and all the non-A-to-I editing samples in the negative dataset are incorrectly predicted, we have the overall accuracy Acc = 0 and MCC = –1; whereas when
  and
and  we have Acc = 0.5 and MCC = 0 meaning no better than random guess.
Accordingly, it has rendered the meanings of sensitivity, specificity, overall accuracy, and stability much more intuitive and easier-to-understand by using Eq.16, particularly for the meaning of MCC, as concurred recently by many investigators (see, e.g., [36, 38, 40, 45, 61, 62, 75, 83–88]).
Note that, however, the set of metrics as defined in Eq.16 is valid only for the single-label systems. As for the multi-label systems whose emergence has become more frequent in system biology [89–91] and system medicine [92] or biomedicine [25], a completely different set of metrics are needed as elucidated in [93].
With a set of good metrics to measure the quality of a predictor, the next thing we need to consider is what validation approach should be adopted to score these metrics. In statistical prediction, the following three cross-validation methods are usually applied: (1) independent dataset test, (2) subsampling (or K-fold cross-validation) test, and (3) jackknife test [94]. Of these three, however, the jackknife test is deemed the least arbitrary that can always yield a unique outcome for a given benchmark dataset as elucidated in [30]. Accordingly, the jackknife test has been widely recognized and increasingly used by investigators to examine the quality of various predictors (see, e.g., [63, 76, 78, 95–107]). In view of this, here we also used the jackknife test to examine the quality of iRNA-AI predictor. During the jackknifing process, both the training dataset and testing dataset are actually open, and each sample will be in turn moved between the two. The jackknife test can exclude the “memory” effect. Also, the arbitrariness problem as mentioned in [30] with the independent dataset and subsampling tests can be totally avoided since the outcome obtained by the jackknife cross-validation is always unique for a given benchmark dataset.
Even though, however, in order to reduce the computational time, the K-fold cross-validation approach has still often been used, as done by many investigators with SVM as the prediction engine (see, e.g., [25, 28, 102, 107]). Also, for demonstrating the practical application of a predictor, the independent dataset test has often been used as well [18].
ACKNOWLEDGMENTS
The authors wish to thank the three anonymous reviewers for their constructive comments, which are very helpful for strengthening the presentation of this study. This work was supported by Program for the Top Young Innovative Talents of Higher Learning Institutions of Hebei Province (No. BJ2014028), the Outstanding Youth Foundation of North China University of Science and Technology (No. JP201502), China Postdoctoral Science Foundation (No.2015M582533), and the Fundamental Research Funds for the Central Universities, China (Nos.ZYGX2015J144, ZYGX2015Z006).
CONFLICTS OF INTEREST
None.
REFERENCES
1. Tang W, Fei Y, Page M. Biological significance of RNA editing in cells. Mol Biotechnol. 2012; 52:91–100.
2. Gray MW. Evolutionary origin of RNA editing. Biochemistry. 2012; 51:5235–5242.
3. Bass BL. RNA editing by adenosine deaminases that act on RNA. Annu Rev Biochem. 2002; 71:817–846.
4. Nishikura K. Functions and regulation of RNA editing by ADAR deaminases. Annu Rev Biochem. 2010; 79:321–349.
5. Rueter SM, Dawson TR, Emeson RB. Regulation of alternative splicing by RNA editing. Nature. 1999; 399:75–80.
6. Agranat L, Raitskin O, Sperling J, Sperling R. The editing enzyme ADAR1 and the mRNA surveillance protein hUpf1 interact in the cell nucleus. Proc Natl Acad Sci U S A. 2008; 105:5028–5033.
7. Hoernes TP, Erlacher MD. Translating the epitranscriptome. Wiley interdisciplinary reviews RNA. 2016.
8. Maas S. Gene regulation through RNA editing. Discov Med. 2010; 10:379–386.
9. Paz N, Levanon EY, Amariglio N, Heimberger AB, Ram Z, Constantini S, Barbash ZS, Adamsky K, Safran M, Hirschberg A, Krupsky M, Ben-Dov I, Cazacu S, et al. Altered adenosine-to-inosine RNA editing in human cancer. Genome Res. 2007; 17:1586–1595.
10. Han L, Diao L, Yu S, Xu X, Li J, Zhang R, Yang Y, Werner HM, Eterovic AK, Yuan Y, Li J, Nair N, Minelli R, et al. The Genomic Landscape and Clinical Relevance of A-to-I RNA Editing in Human Cancers. Cancer Cell. 2015; 28:515–528.
11. Martinez HD, Jasavala RJ, Hinkson I, Fitzgerald LD, Trimmer JS, Kung HJ, Wright ME. RNA editing of androgen receptor gene transcripts in prostate cancer cells. J Biol Chem. 2008; 283:29938–29949.
12. Slotkin W, Nishikura K. Adenosine-to-inosine RNA editing and human disease. Genome Med. 2013; 5:105.
13. Bahn JH, Lee JH, Li G, Greer C, Peng G, Xiao X. Accurate identification of A-to-I RNA editing in human by transcriptome sequencing. Genome Res. 2012; 22:142–150.
14. Sakurai M, Ueda H, Yano T, Okada S, Terajima H, Mitsuyama T, Toyoda A, Fujiyama A, Kawabata H, Suzuki T. A biochemical landscape of A-to-I RNA editing in the human brain transcriptome. Genome Res. 2014; 24:522–534.
15. Picardi E, D’Antonio M, Carrabino D, Castrignano T, Pesole G. ExpEdit: a webserver to explore human RNA editing in RNA-Seq experiments. Bioinformatics. 2011; 27:1311–1312.
16. Zhou GP. Current progress in structural bioinformatics of protein-biomolecule interactions. Med Chem. 2015; 11:216–216.
17. Zhou GP, Chen D, Liao S, Huang RB. Recent Progresses in Studying Helix-Helix Interactions in Proteins by Incorporating the Wenxiang Diagram into the NMR Spectroscopy. Curr Top Med Chem. 2016; 16:581–590.
18. Chen W, Ding H, Feng P, Lin H, Chou KC. iACP: a sequence-based tool for identifying anticancer peptides. Oncotarget. 2016; 7:16895–16909. doi: 10.18632/oncotarget.7815.
19. Jia J, Liu Z, Xiao X, Liu B, Chou KC. iCar-PseCp: identify carbonylation sites in proteins by Monte Carlo sampling and incorporating sequence coupled effects into general PseAAC. Oncotarget. 2016; 7:34558–70. doi: 10.18632/oncotarget.9148.
20. Liu B, Long R. iDHS-EL: Identifying DNase I hypersensi-tivesites by fusing three different modes of pseudo nucleotide composition into an en-semble learning framework. Bioinformatics. 2016; 32:2411–2418.
21. Liu B, Fang L, Long R. iEnhancer-2L: a two-layer predictor for identifying enhancers and their strength by pseudo k-tuple nucleotide composition Bioinformatics. 2016; 32:362–369.
22. Qiu WR, Sun BQ, Xiao X, Xu ZC, Chou KC. iHyd-PseCp: Identify hydroxyproline and hydroxylysine in proteins by incorporating sequence-coupled effects into general PseAAC. Oncotarget. 2016; 7:44310–44321. doi: 10.18632/oncotarget.10027.
23. Zhang CJ, Tang H, Li WC, Lin H, Chou KC. iOri-Human: identify human origin of replication by incorporating dinucleotide physicochemical properties into pseudo nucleotide composition. Oncotarget. 2016; 7:69783–69793. doi: 10.18632/oncotarget.11975.
24. Qiu WR, Xiao X, Xu ZH, Chou KC. iPhos-PseEn: identifying phosphorylation sites in proteins by fusing different pseudo components into an ensemble classifier. Oncotarget. 2016; 7:51270–51283. doi: 10.18632/oncotarget.9987.
25. Qiu WR, Sun BQ, Xiao X. iPTM-mLys: identifying multiple lysine PTM sites and their different types. Bioinformatics. 2016; 32:3116–3123.
26. Chen W, Tang H, Ye J, Lin H. iRNA-PseU: Identifying RNA pseudouridine sites Mol Ther-Nucl Acids. 2016; 5:e332.
27. Xiao X, Ye HX, Liu Z, Jia JH, Chou KC. iROS-gPseKNC: predicting replication origin sites in DNA by incorporating dinucleotide position-specific propensity into general pseudo nucleotide composition. Oncotarget. 2016; 7:34180–34189. doi: 10.18632/oncotarget.9057.
28. Liu B, Wang S, Long R. iRSpot-EL: identify recombination spots with an ensemble learning approach. Bioinformatics. 2016; doi:10.1093/bioinformatics/btw539.
29. Jia J, Zhang L, Liu Z. pSumo-CD: Predicting sumoylation sites in proteins with covariance discriminant algorithm by incorporating sequence-coupled effects into general PseAAC. Bioinformatics. 2016; 32:3133–3141.
30. Chou KC. Some remarks on protein attribute prediction and pseudo amino acid composition (50th Anniversary Year Review). J Theor Biol. 2011; 273:236–247.
31. Chou KC. A sequence-coupled vector-projection model for predicting the specificity of GalNAc-transferase. Protein Sci. 1995; 4:1365–1383.
32. Chou KC, Shen HB. Signal-CF: a subsite-coupled and window-fusing approach for predicting signal peptides. Biochem Biophys Res Comm (BBRC). 2007; 357: 633–640.
33. Shen HB, Chou KC. Signal-3L: a 3-layer approach for predicting signal peptide. Biochem Biophys Res Comm (BBRC). 2007; 363:297–303.
34. Xu Y, Wen X, Shao XJ. iHyd-PseAAC: Predicting hydroxyproline and hydroxylysine in proteins by incorporating dipeptide position-specific propensity into pseudo amino acid composition. Int J Mol Sci. 2014; 15:7594–7610.
35. Qiu WR, Xiao X, Lin WZ. iMethyl-PseAAC: Identification of Protein Methylation Sites via a Pseudo Amino Acid Composition Approach. Biomed Res Int. 2014; 2014:947416.
36. Liu Z, Xiao X, Qiu WR. iDNA-Methyl: Identifying DNA methylation sites via pseudo trinucleotide composition. Anal Biochem. 2015; 474:69–77.
37. Liu Z, Xiao X, Yu DJ, Jia J. pRNAm-PC: Predicting N-methyladenosine sites in RNA sequences via physical-chemical properties. Anal Biochem. 2016; 497:60–67.
38. Xu Y, Shao XJ, Wu LY. iSNO-AAPair: incorporating amino acid pairwise coupling into PseAAC for predicting cysteine S-nitrosylation sites in proteins. PeerJ. 2013; 1:e171.
39. Xu Y, Wen X, Wen LS, Wu LY. iNitro-Tyr: Prediction of nitrotyrosine sites in proteins with general pseudo amino acid composition. PLoS ONE. 2014; 9:e105018.
40. Jia J, Liu Z, Xiao X, Liu B. Identification of protein-protein binding sites by incorporating the physicochemical properties and stationary wavelet transforms into pseudo amino acid composition (iPPBS-PseAAC). J Biomol Struct Dyn. 2016; 34:1946–1961.
41. Jia J, Liu Z, Xiao X, Liu B. iPPBS-Opt: A Sequence-Based Ensemble Classifier for Identifying Protein-Protein Binding Sites by Optimizing Imbalanced Training Datasets. Molecules. 2016; 21:95.
42. Kiran A, Baranov PV. DARNED: a DAtabase of RNa EDiting in humans. Bioinformatics. 2010; 26:1772–1776.
43. Chou KC. Prediction of signal peptides using scaled window. Peptides. 2001; 22:1973–1979.
44. Fu L, Niu B, Zhu Z, Wu S, Li W. CD-HIT: accelerated for clustering the next-generation sequencing data. Bioinformatics. 2012; 28:3150–3152.
45. Xiao X, Min JL, Lin WZ, Liu Z. iDrug-Target: predicting the interactions between drug compounds and target proteins in cellular networking via the benchmark dataset optimization approach. J Biomol Struct Dyn. 2015; 33:2221–2233.
46. Chou KC, Shen HB. Review: Recent progresses in protein subcellular location prediction. Anal Biochem. 2007; 370:1–16.
47. Chou KC. Impacts of bioinformatics to medicinal chemistry. Med Chem. 2015; 11:218–234.
48. Chou KC. Prediction of protein cellular attributes using pseudo amino acid composition. PROTEINS: Structure, Function, and Genetics (Erratum: ibid, 2001, Vol44, 60). 2001; 43:246–255.
49. Chou KC. Using amphiphilic pseudo amino acid composition to predict enzyme subfamily classes. Bioinformatics. 2005; 21:10–19.
50. Cao DS, Xu QS, Liang YZ. propy: a tool to generate various modes of Chou’s PseAAC. Bioinformatics. 2013; 29:960–962.
51. Du P, Gu S, Jiao Y. PseAAC-General: Fast building various modes of general form of Chou’s pseudo amino acid composition for large-scale protein datasets. Int J Mol Sci. 2014; 15:3495–3506.
52. Chou KC. Pseudo amino acid composition and its applications in bioinformatics, proteomics and system biology. Current Proteomics. 2009; 6: 262–274.
53. Chen W, Lei TY, Jin DC. PseKNC: a flexible web-server for generating pseudo K-tuple nucleotide composition. Anal Biochem. 2014; 456:53–60.
54. Chen W, Zhang X, Brooker J, Lin H. PseKNC-General: a cross-platform package for generating various modes of pseudo nucleotide compositions. Bioinformatics. 2015; 31:119–120.
55. Liu B, Liu F, Fang L. repDNA: a Python package to generate various modes of feature vectors for DNA sequences by incorporating user-defined physicochemical properties and sequence-order effects. Bioinformatics. 2015; 31:1307–1309.
56. Liu B, Liu F, Fang L, Wang X. repRNA: a web server for generating various feature vectors of RNA sequences. Mol Genet Genomics. 2016; 291:473–481.
57. Chen W, Feng PM, Deng EZ, Lin H. iTIS-PseTNC: a sequence-based predictor for identifying translation initiation site in human genes using pseudo trinucleotide composition. Anal Biochem. 2014; 462:76–83.
58. Chen W, Feng PM, Lin H. iSS-PseDNC: identifying splicing sites using pseudo dinucleotide composition. Biomed Res Int. 2014; 2014:623149.
59. Chen W, Feng PM, Lin H. iRSpot-PseDNC: identify recombination spots with pseudo dinucleotide composition Nucleic Acids Res. 2013; 41(No.6):e68.
60. Qiu WR, Xiao X. iRSpot-TNCPseAAC: Identify recombination spots with trinucleotide composition and pseudo amino acid components. Int J Mol Sci (IJMS). 2014; 15:1746–1766.
61. Lin H, Deng EZ, Ding H, Chen W. iPro54-PseKNC: a sequence-based predictor for identifying sigma-54 promoters in prokaryote with pseudo k-tuple nucleotide composition. Nucleic Acids Res. 2014; 42:12961–12972.
62. Chen W, Feng P, Ding H. iRNA-Methyl: Identifying N6-methyladenosine sites using pseudo nucleotide composition. Anal Biochem (also, Data in Brief, 2015, 5: 376–378). 2015; 490:26–33.
63. Kabir M, Hayat M. iRSpot-GAEnsC: identifing recombination spots via ensemble classifier and extending the concept of Chou’s PseAAC to formulate DNA samples. Mol Genet Genomics. 2016; 291:285–296.
64. Tahir M, Hayat M. iNuc-STNC: a sequence-based predictor for identification of nucleosome positioning in genomes by extending the concept of SAAC and Chou’s PseAAC. Mol Biosyst 2016; 12:2587–2593.
65. Chen W, Lin H, Chou KC. Pseudo nucleotide composition or PseKNC: an effective formulation for analyzing genomic sequences. Mol BioSyst. 2015; 11:2620–2634.
66. Liu B, Liu F, Wang X, Chen J. Pse-in-One: a web server for generating various modes of pseudo components of DNA, RNA, and protein sequences Nucleic Acids Res. 2015; 43(W1):W65-W71.
67. Chou KC. Low-frequency vibrations of DNA molecules. Biochem J. 1984; 221:27–31.
68. Maggiora GM, Mao B. Quasi-continuum models of twist-like and accordion-like low-frequency motions in DNA. Biophys J. 1989; 56:295–305.
69. Mao B. Collective motion in DNA and its role in drug intercalation. Biopolymers. 1988; 27:1795–1815.
70. Chou KC. Review: Low-frequency collective motion in biomacromolecules and its biological functions. Biophys Chem. 1988; 30:3–48.
71. Chou KC, Zhang CT. Diagrammatization of codon usage in 339 HIV proteins and its biological implication. AIDS Res Hum Retroviruses. 1992; 8:1967–1976.
72. Zhang CT. Analysis of codon usage in 1562 E. Coli protein coding sequences. J Mol Biol. 1994; 238:1–8.
73. Feng PM, Chen W, Lin H. iHSP-PseRAAAC: Identifying the heat shock protein families using pseudo reduced amino acid alphabet composition. Anal Biochem. 2013; 442:118–125.
74. Guo SH, Deng EZ, Xu LQ, Ding H. iNuc-PseKNC: a sequence-based predictor for predicting nucleosome positioning in genomes with pseudo k-tuple nucleotide composition. Bioinformatics. 2014; 30:1522–1529.
75. Liu B, Fang L, Wang S, Wang X. Identification of microRNA precursor with the degenerate K-tuple or Kmer strategy. J Theor Biol. 2015; 385:153–159.
76. Chen J, Long R, Wang XL, Liu B. dRHP-PseRA: detecting remote homology proteins using profile-based pseudo protein sequence and rank aggregation. Sci Rep. 2016:6:32333.
77. Cai YD. Using functional domain composition and support vector machines for prediction of protein subcellular location. J Biol Chem. 2002; 277:45765–45769.
78. Cai YD, Zhou GP. Support vector machines for predicting membrane protein types by using functional domain composition. Biophys J. 2003; 84:3257–3263.
79. Cristianini N, Shawe-Taylor J. . An introduction of Support Vector Machines and other kernel-based learning methodds. (Cambridge, UK: Cambridge University Press).
80. Chen J, Liu H, Yang J. Prediction of linear B-cell epitopes using amino acid pair antigenicity scale. Amino Acids. 2007; 33: 423–428.
81. Xu Y, Ding J, Wu LY. iSNO-PseAAC: Predict cysteine S-nitrosylation sites in proteins by incorporating position specific amino acid propensity into pseudo amino acid composition PLoS ONE. 2013; 8:e55844.
82. Chou KC. Prediction of protein signal sequences and their cleavage sites. Proteins: Struct, Funct, Genet. 2001; 42:136–139.
83. Ding H, Deng EZ, Yuan LF, Liu L. iCTX-Type: A sequence-based predictor for identifying the types of conotoxins in targeting ion channels. Biomed Res Int. 2014; 2014:286419.
84. Jia J, Liu Z, Xiao X. iPPI-Esml: an ensemble classifier for identifying the interactions of proteins by incorporating their physicochemical properties and wavelet transforms into PseAAC. J Theor Biol. 2015; 377:47–56.
85. Liu B, Fang L, Liu F, Wang X. Identification of real microRNA precursors with a pseudo structure status composition approach. PLoS ONE. 2015; 10:e0121501.
86. Xu Y. Recent progress in predicting posttranslational modification sites in proteins. Curr Top Med Chem. 2016; 16:591–603.
87. Chen W, Feng P, Ding H, Lin H. Using deformation energy to analyze nucleosome positioning in genomes. Genomics. 2016; 107:69–75.
88. Qiu WR, Sun BQ, Xiao X, Xu D. iPhos-PseEvo: Identifying human phosphorylated proteins by incorporating evolutionary information into general PseAAC via grey system theory. Mol Inform. 2016; doi:10.1002/minf.201600010.
89. Wu ZC, Xiao X. iLoc-Hum: Using accumulation-label scale to predict subcellular locations of human proteins with both single and multiple sites. Mol Biosyst. 2012; 8:629–641.
90. Lin WZ, Fang JA. iLoc-Animal: A multi-label learning classifier for predicting subcellular localization of animal proteins. Mol Biosyst. 2013; 9:634–644.
91. Xiao X, Wu ZC. iLoc-Virus: A multi-label learning classifier for identifying the subcellular localization of virus proteins with both single and multiple sites. J Theor Biol. 2011; 284:42–51.
92. Xiao X, Wang P, Lin WZ. iAMP-2L: A two-level multi-label classifier for identifying antimicrobial peptides and their functional types. Anal Biochem. 2013; 436:168–177.
93. Chou KC. Some Remarks on Predicting Multi-Label Attributes in Molecular Biosystems. Mol Biosyst. 2013; 9:1092–1100.
94. Chou KC, Zhang CT. Review: Prediction of protein structural classes. Crit Rev Biochem Mol Biol. 1995; 30:275–349.
95. Zhou GP, Assa-Munt N. Some insights into protein structural class prediction. Proteins: Struct, Funct, Genet. 2001; 44:57–59.
96. Zhou GP, Doctor K. Subcellular location prediction of apoptosis proteins. Proteins: Struct, Funct, Genet. 2003; 50:44–48.
97. Shen HB, Yang J. Euk-PLoc: an ensemble classifier for large-scale eukaryotic protein subcellular location prediction. Amino Acids. 2007; 33:57–67.
98. Cai YD. Prediction of membrane protein types by incorporating amphipathic effects. J Chem Inf Model. 2005; 45:407–413.
99. Mondal S, Pai PP. Chou’s pseudo amino acid composition improves sequence-based antifreeze protein prediction. J Theor Biol. 2014; 356:30–35.
100. Dehzangi A, Heffernan R, Sharma A, Lyons J, Paliwal K, Sattar A. Gram-positive and Gram-negative protein subcellular localization by incorporating evolutionary-based descriptors into Chou’s general PseAAC. J Theor Biol. 2015; 364:284–294.
101. Khan ZU, Hayat M, Khan MA. Discrimination of acidic and alkaline enzyme using Chou’s pseudo amino acid composition in conjunction with probabilistic neural network model. J Theor Biol. 2015; 365:197–203.
102. Kumar R, Srivastava A, Kumari B, Kumar M. Prediction of beta-lactamase and its class by Chou’s pseudo amino acid composition and support vector machine. J Theor Biol. 2015; 365:96–103.
103. Ali F, Hayat M. Classification of membrane protein types using Voting Feature Interval in combination with Chou’s Pseudo Amino Acid Composition. J Theor Biol. 2015; 384:78–83.
104. Ahmad K, Waris M, Hayat M. Prediction of Protein Submitochondrial Locations by Incorporating Dipeptide Composition into Chou’s General Pseudo Amino Acid Composition. J Membr Biol. 2016; 249:293–304.
105. Ju Z, Cao JZ, Gu H. Predicting lysine phosphoglycerylation with fuzzy SVM by incorporating k-spaced amino acid pairs into Chou’s general PseAAC. J Theor Biol. 2016; 397:145–150.
106. Tang H, Chen W, Lin H. Identification of immunoglobulins using Chou’s pseudo amino acid composition with feature selection technique. Mol Biosyst. 2016; 12:1269–1275.
107. Behbahani M, Mohabatkar H, Nosrati M. Analysis and comparison of lignin peroxidases between fungi and bacteria using three different modes of Chou’s general pseudo amino acid composition. J Theor Biol. 2016; 10.1016/j.jtbi.2016.09.001.