
INTRODUCTION
Acute myeloid leukemia (AML), characterized by the rapid growth of abnormal white blood cells interfering with the production of normal blood cells, is the most common type of acute leukemia affecting adults. Presently, induction chemotherapy with cytarabine and anthracyclines is the first-line treatment for AML except for acute promyelocytic leukemia (According to NCCN AML Guidelines 2015, version 1). However, outcomes of AML vary greatly among patients after chemotherapy. Clinical studies have shown that the five-year survival rate of AML varies from 18% to 82%, and relapse rate varies from 33% to 80% [1–4].
It is well known that chromosomal abnormalities are major prognostic factors in AML. Based on karyotype, AML patients can be divided into favorable, intermediate and unfavorable cytogenetics risk groups which show different survival profiles [5]. However, the detailed mechanism of the prognosis variation in normal karyotype AML (CN-AML) patients, the most common type, remains unclear. Several factors affecting AML prognosis have been identified, including somatic mutations in genes such as NPM1, FLT3-ITD, CEBPA, WT1, ASXL1, IDH1/2, DNMT3A, and RUNX1 [6–10]. Moreover, expression levels of LFE1 [11], CXXC5 [12], EVL1, MEL1 [13], and miR-9* [14] are also reported to be associated with AML prognosis. However, only a small part of AML prognosis variation can be explained by these above-mentioned factors.
Cancer cell lines, which were descended from naturally occurring tumors, are commonly used for molecular biology research and drug discovery in vitro. Previous studies have confirmed that the use of pharmacological data and genomic information of cancer cell lines can help researchers to identify therapeutic biomarkers [15–17]. These data are also helpful to find genomic variants associated with sensitivity of anti-tumor drugs and thus potentially affect cancer prognosis. Cytarabine is a first-line drug for inducing remission in common therapeutic schedule for AML. The achievement of complete remission (CR) is indispensable for a better prognosis; meanwhile, chemo-resistance is essential for treatment failure and poor outcomes for AML [18–20]. Therefore, further identification of genomic information affecting drug response phenotype in leukemia cell lines may help to find new factors affecting AML prognosis.
Recently, a lot of classified studies based on RNA microarray have been performed to establish the classifier which might help to predict the outcomes of CN-AML. For example, Metzeler et al. reported an 86-probe-set mRNA expression signature which was correlated with overall survival (OS) of AML [21]. Gentles et al. found a leukemic stem cell gene expression signature correlated with clinical outcomes in AML [22]. Garzon et al. derived a lncRNA score composed of 48 lncRNAs and found that the score was an independent marker for the outcome in CN-AML patients [23]. However, no studies have focused on genes related to chemo-sensitivity. In 2013, an open access database named Genomics of Drug Sensitivity in Cancer (GDSC) was developed [24]. This database includes date of half maximal inhibitory concentration (IC50) values for 138 anticancer drugs on more than 800 cancer cell lines. Whole genome mutations and expression levels are also available for the GDSC database. To find out whether genes correlated with chemo-sensitivity could also predict the outcome of AML, we downloaded IC50 values of cytarabine from 96 leukemia cell lines and raw whole genome expression data of these cell lines from GDSC in this study. Probes significantly associated with IC50 levels in the cells and OS in GSE12417 dataset, a whole genome expression dataset for CN-AML in NCBI Gene Expression Omnibus (GEO), were selected. Based on the selected probes, chemo-sensitivity score was derived and replicated in a TCGA CN-AML dataset.
RESULTS
Cluster analysis in blood cell lines
At first, we conducted a cluster analysis based on expression of all probes. The blood cancer cell lines were clustered into two classes except for Daudi (a human Burkitt’s lymphoma cell line) and U-698-M (a B-Acute Lymphoblastic Leukemia cell line) (Figure 1A). Significant difference in mean cytarabine IC50 values between the two classes was observed (p=0.030, Figure 1B). These results indicated that the whole genome expression pattern can affect cytarabine sensitivity in blood cell lines.
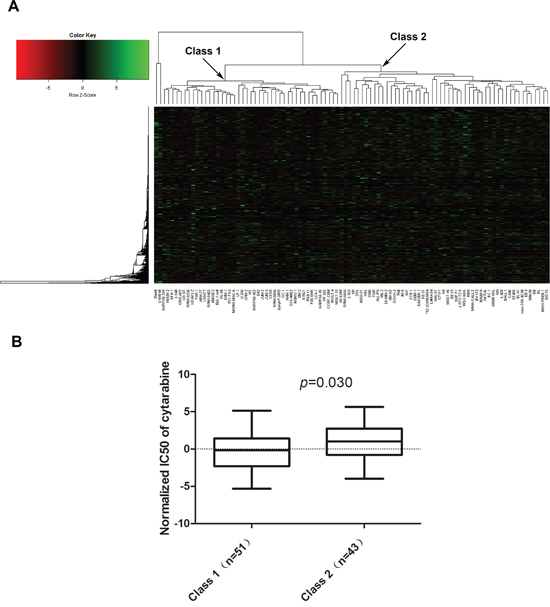
Figure 1: Whole genome expression pattern impact cytarabine sensitivity in blood cancer cell lines. A. Cluster analysis of all probes in blood cancer cell lines, B. Comparison of cytarabine IC50 values between two classes of blood cancer cell lines divided by cluster analysis.
Function prediction of genes notably impacting cytarabine IC50 in blood cancer cell lines
Results of linear-regression analysis showed that 4207 probes were significantly associated with cytarabine IC50 values (raw p<0.05) in the GDSC blood cell lines. GO annotation was carried out to predict the potential function of genes targeted by the probes. In terms of biological processes, 4 of the top 10 categories belonged to RNA processing modification and metabolic process (Figure 2A). Interestingly, molecular functions of all top 10 categories were related to protein or nucleic acid binding (Figure 2B). With regard to cellular components, lumen appeared in 3 most enriched categories (Figure 2C). KEGG database was also used to identify gene networks affected by these genes (Figure 2D). Most pathways were related to immune system. The details of pathway analysis based on all 4207 probes were listed in supplementary materials (Supplementary material S2).
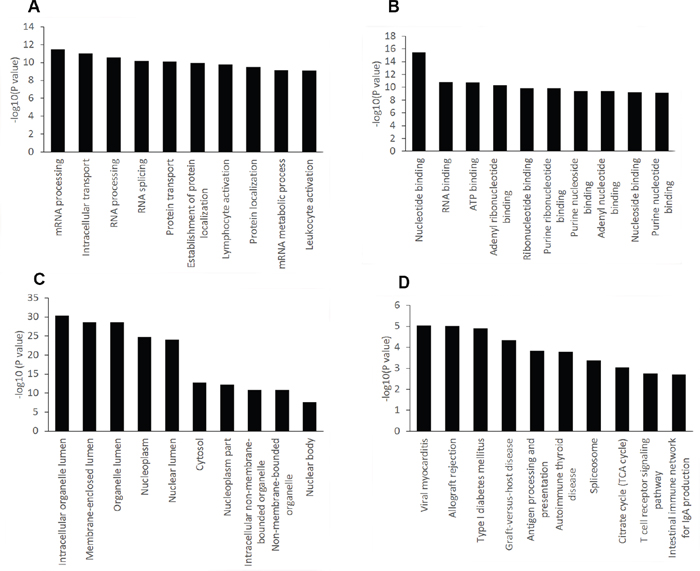
Figure 2: GO and KEGG pathway analysis of genes notably impacting cytarabine IC50 in blood cancer cell lines. The top ten significantly enriched GO categories and pathways were calculated and plotted as the − 1 × log10 (p value). A. Biological process, B. Molecular function, C. Cellular component, D. KEGG Pathways.
A 42 probe set correlated with both cytarabine sensitivity and AML OS
Among the 4207 probes associated with cytarabine IC50 values, 453 were significantly associated with OS in GSE12417 U133 AB sample, while 337 were associated with OS in GSE12417 U133 plus sample (univariate cox regression analysis P<0.05). Finally, 42 probes correlated with both cytarabine sensitivity and OS in the same direction were identified. Details of these probes were listed in Table 1. After analysis in David database, 33 GO Terms with raw p<0.05 were identified, and four (GO:0044429, Bonferroni p=1.74 × 10⁻⁵; GO:0005759, Bonferroni p=0.002; GO:0031980, Bonferroni p=0.002; GO:0005739, Bonferroni p=0.006) of them passed correction for multiple tests (Table 2). Interestingly, all these four GO Terms correlated with cellular component of mitochondrion which plays important roles in AML progression.
Table 1: Statistical analysis results for the 42 probes in blood cancer cell lines and in the GSE12417 dataset
Gene |
Probe name |
GDSC Blood cancer cell lines |
GSE12417 |
Prognostic Index |
||||
|---|---|---|---|---|---|---|---|---|
p value |
t value |
U133AB sample |
U133 Plus sample |
|||||
p value |
Z value |
p value |
Z value |
|||||
ULK1 |
209333_at |
1.44E-05 |
-4.578 |
0.045 |
-2.004 |
0.018 |
-2.362 |
-0.309 |
PIGF |
205078_at |
2.54E-05 |
4.431 |
0.043 |
2.020 |
0.041 |
2.045 |
0.193 |
ABCC5 |
209380_s_at |
9.26E-05 |
-4.085 |
0.011 |
-2.541 |
0.035 |
-2.109 |
-0.336 |
MRPL40 |
203152_at |
9.84E-05 |
4.069 |
0.003 |
2.959 |
0.018 |
2.366 |
0.253 |
DARS2 |
218365_s_at |
1.60E-04 |
3.934 |
0.046 |
1.992 |
0.011 |
2.532 |
0.193 |
ITSN1 |
35776_at |
2.27E-04 |
-3.835 |
0.027 |
-2.208 |
0.041 |
-2.041 |
-0.274 |
ZC3HAV1 |
213051_at |
4.09E-04 |
-3.665 |
0.032 |
-2.149 |
0.017 |
-2.397 |
-0.355 |
NDUFB5 |
203621_at |
5.32E-04 |
3.588 |
0.003 |
3.022 |
0.004 |
2.865 |
0.341 |
SKAP2 |
204361_s_at |
7.54E-04 |
3.483 |
0.025 |
2.243 |
0.038 |
2.072 |
0.186 |
ZNF451 |
215012_at |
0.001 |
-3.367 |
0.038 |
-2.070 |
0.005 |
-2.821 |
-0.316 |
IARS2 |
217900_at |
0.002 |
3.197 |
0.010 |
2.562 |
0.018 |
2.358 |
0.212 |
MPP1 |
202974_at |
0.003 |
-3.049 |
0.018 |
-2.367 |
0.044 |
-2.010 |
-0.363 |
ZNF259P1/ZPR1 |
217185_s_at |
0.004 |
2.961 |
0.003 |
3.023 |
0.011 |
2.541 |
0.231 |
BCL2L1 |
212312_at |
0.004 |
-2.916 |
0.022 |
-2.288 |
0.042 |
-2.032 |
-0.309 |
CHMP4A/TM9SF1 |
218572_at |
0.006 |
2.836 |
0.026 |
2.219 |
0.047 |
1.987 |
0.197 |
GAS2 |
205848_at |
0.007 |
2.744 |
0.029 |
2.185 |
0.001 |
3.403 |
0.191 |
ME2 |
210154_at |
0.008 |
2.715 |
0.021 |
2.307 |
0.016 |
2.412 |
0.221 |
ALCAM |
201951_at |
0.008 |
2.710 |
0.000 |
3.634 |
0.000 |
5.064 |
0.363 |
DNAJC1 |
218409_s_at |
0.009 |
2.675 |
0.005 |
2.791 |
0.023 |
2.282 |
0.259 |
VDAC1 |
212038_s_at |
0.009 |
2.673 |
0.005 |
2.804 |
0.018 |
2.376 |
0.213 |
SLC25A38 |
217961_at |
0.009 |
-2.648 |
0.011 |
-2.540 |
0.016 |
-2.420 |
-0.314 |
IL6R |
205945_at |
0.010 |
2.636 |
0.003 |
2.986 |
0.022 |
2.282 |
0.260 |
ME2 |
210153_s_at |
0.012 |
2.568 |
0.018 |
2.367 |
0.002 |
3.053 |
0.254 |
ETFDH |
33494_at |
0.013 |
2.527 |
0.040 |
2.058 |
0.043 |
2.020 |
0.158 |
TAL1 |
206283_s_at |
0.017 |
-2.441 |
0.036 |
-2.092 |
0.027 |
-2.216 |
-0.339 |
TAL1 |
216925_s_at |
0.017 |
-2.427 |
0.011 |
-2.541 |
0.032 |
-2.147 |
-0.381 |
BMP2K |
219546_at |
0.017 |
-2.420 |
0.013 |
-2.486 |
0.033 |
-2.137 |
-0.308 |
FH |
203033_x_at |
0.019 |
2.379 |
0.016 |
2.399 |
0.033 |
2.131 |
0.213 |
SLC14A1 |
205856_at |
0.021 |
-2.353 |
0.037 |
-2.091 |
0.048 |
-1.974 |
-0.356 |
SPATS2 |
218324_s_at |
0.021 |
2.338 |
0.023 |
2.268 |
0.017 |
2.391 |
0.272 |
P4HTM |
222125_s_at |
0.026 |
2.269 |
0.013 |
2.478 |
0.029 |
2.184 |
0.212 |
PLA2G4A |
210145_at |
0.031 |
2.195 |
0.007 |
2.689 |
0.023 |
2.281 |
0.242 |
TRIB2 |
202478_at |
0.031 |
-2.184 |
0.030 |
-2.174 |
0.033 |
-2.126 |
-0.310 |
ACYP2/LOC101927144 |
206833_s_at |
0.032 |
2.182 |
0.008 |
2.636 |
0.030 |
2.167 |
0.321 |
SYNCRIP |
217834_s_at |
0.033 |
2.166 |
0.025 |
2.239 |
0.007 |
2.691 |
0.211 |
IDH3A |
202069_s_at |
0.033 |
2.161 |
0.012 |
2.509 |
0.014 |
2.466 |
0.215 |
TPD52 |
201688_s_at |
0.033 |
2.161 |
0.004 |
2.895 |
0.008 |
2.662 |
0.268 |
HIST1H2APS4 |
216585_at |
0.033 |
2.160 |
0.038 |
2.072 |
0.005 |
2.795 |
0.229 |
ERMP1 |
218342_s_at |
0.036 |
2.124 |
0.034 |
2.119 |
0.038 |
2.072 |
0.217 |
SLC25A37 |
221920_s_at |
0.038 |
-2.099 |
0.016 |
-2.413 |
0.027 |
-2.213 |
-0.368 |
TCTN3 |
212121_at |
0.046 |
2.026 |
0.000 |
3.506 |
0.009 |
2.620 |
0.331 |
CD164 |
208654_s_at |
0.048 |
2.008 |
0.012 |
2.519 |
0.006 |
2.732 |
0.293 |
Table 2: Four most significantly GO terms for the selected 42 probes
Category |
GO Term |
Count |
% |
p value |
Bonferroni |
|---|---|---|---|---|---|
GOTERM_CC_FAT |
GO:0044429 ~ mitochondrial part |
12 |
30.0 |
1.54E-07 |
1.74E-05 |
GOTERM_CC_FAT |
GO:0005759 ~ mitochondrial matrix |
7 |
17.5 |
2.18E-05 |
0.002 |
GOTERM_CC_FAT |
GO:0031980 ~ mitochondrial lumen |
7 |
17.5 |
2.18E-05 |
0.002 |
GOTERM_CC_FAT |
GO:0005739 ~ mitochondrion |
12 |
30.0 |
5.36E-05 |
0.006 |
Association of the chemo-sensitivity score based on 42 probes with AML survival in patients from GSE12417 dataset
The detailed information including univariate cox score and combined cox score of the 42 selected probes mapped to 44 annotated genes were summarized in Table 1. Among these probes, 3 targeted two genes, and 2 genes were represented by 2 probes simultaneously. As compared to patients with a favorable chemo-sensitivity score, those with an unfavorable score had a shorter OS in both samples with U133 AB (p=0.006, HR=1.739, 95% CI: 1.174-2.575, Figure 3A) and U133 plus data (p=0.003, HR=2.456, 95% CI: 1.358-4.441, Figure 3B). As age was significantly associated with OS in both U133 AB and U133 plus samples in univariate analysis, we performed further multivariate analysis adjusted by age. The results showed that the influence of chemo-sensitivity score on OS was more notable (p=5.13 × 10⁻⁴, HR=2.040, 95% CI: 1.364-3.051 for U133AB sample; p=0.002, HR=2.528, 95% CI: 1.393-4.591 in U133 plus sample).
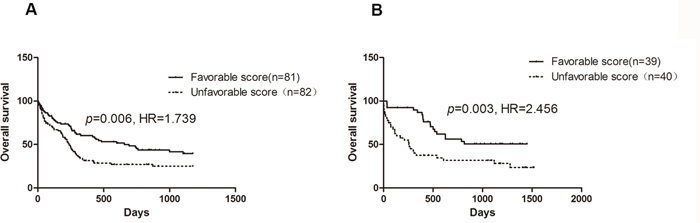
Figure 3: Survival curve of AML patients stratified by chemo-sensitivity score. A. U133 AB samples; B. U133 plus samples.
Validation of the association between 42-probe-based chemo-sensitivity score and survival in TCGA CN-AML patients
TCGA AML dataset was downloaded and association between chemo-sensitivity score based on the 42 probes and OS in 56 de novo CN-AML patients was also assessed. Patients with an unfavorable score had a shorter OS (p=0.013, HR=2.442, 95% CI: 1.205-4.950, Figure 4A). However, age was not associated with OS in TCGA CN-AML patients (p=0.367). As disease-free survival (DFS) data was also available for the TCGA AML dataset. Our results showed that patients with an unfavorable score had significantly shorter DFS as compared with patients with a favorable chemo-sensitivity (p=0.015, HR=2.376, 95% CI: 1.181-4.779, Figure 4B).
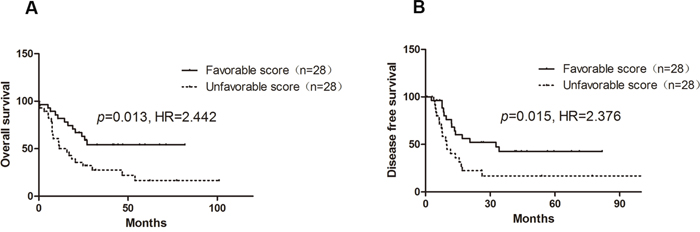
Figure 4: Influence of chemo-sensitivity score on OS and DFS of CN-AML in TCGA AML dataset.
To confirm whether chemo-sensitivity score was an independent risk factor for OS in TCGA CN-AML patients, association between the score and some known risk factors for AML outcome, including cytogenetic risk, NPM1 mutations, FLT3-IDT mutations, CEBPA mutations, IDH mutations, and DMNT3A R882 mutations were analyzed. However, no significant association was observed for any of the somatic mutations (Table 3).
Table 3: Comparison of chemo-sensitivity score between genotypes of well-known somatic mutations affecting AML outcome
Mutation |
Wild type |
Mutation |
p value |
||
|---|---|---|---|---|---|
Score (Mean±SD) |
N |
Score (Mean±SD) |
N |
||
CEBPA |
0.612±3.561 |
48 |
-2.557±3.428 |
5 |
0.063 |
DNMT3A R882 |
-0.109±3.396 |
42 |
1.926±4.239 |
11 |
0.099 |
FLT3-IDT |
-0.185±3.705 |
36 |
1.369±3.355 |
17 |
0.148 |
IDH |
0.780±3.849 |
39 |
-0.986±2.683 |
14 |
0.120 |
NPM1 |
-0.022±3.925 |
21 |
0.533±3.485 |
32 |
0.592 |
RUNX1 |
0.295±3.740 |
49 |
0.535±2.373 |
4 |
0.901 |
WT1 |
0.354±3.762 |
48 |
-0.076±2.379 |
5 |
0.804 |
DISCUSSION
In this study, we derived a gene signature including 42 probes which mapped to 43 annotated genes from GDSC blood cell lines and the GEO GSE12417 dataset. The chemo-sensitivity score calculated based on the expression level of the 42 probes was significantly associated with OS in GSE12417 CN-AML patients and replicated in the TCGA AML dataset. Multivariate analysis showed that the chemo-sensitivity score might be an independent risk factor for AML outcome. Our results indicated that chemo-sensitivity score might be used for predicting prognosis of AML patients after cytarabine based chemotherapy.
Cytarabine is a key drug used for the induction therapy of AML. Evidence has shown that AML patients who achieved CR had longer OS than non-CR patients [18–20], and chemo-resistance is the main reason for treatment failure in AML [25–27]. Hence, factors affect IC50 of cytarabine may also influence prognosis of AML. Our findings presently confirmed the conjecture. In this study, we obtained a gene signature related to both IC50 values of cytarabine in blood cancer lines and AML OS accepted induction therapy based on cytarabine. According to the chemo-sensitivity score calculated by the expression level of the gene signature, AML patients could be divided into favorable and unfavorable groups that have different OS and DFS. These results indicated that identification of factors related to cytarabine response on cancer cell lines maybe a viable strategy for finding potential factors affecting AML survival.
For the 44 genes involved in the signature, results of pathway analysis by using the David database showed that 4 GO terms were significantly correlated with cellular component of mitochondrion after multiple testing corrections. Mitochondria is a key organelles in human cells participating in cell apoptosis [28, 29], and it also plays important roles in AML progress and chemosensitivity [30]. Energy is greatly demanded in cancer cells, therefore, more adenosine triphosphate (ATP) synthesized by mitochondrion is required. Using AML cell lines, Vo et al. demonstrated that increasing mitochondrial priming enhances chemo-sensitivity, and selection for reduced mitochondrial priming in relapsed AML may be an important determinant for the chemo-resistant phenotype [31]. Xiao et al found that mitochondrial ATPsyn-b played an important role in multidrug resistance in AML [32]. Wang et al observed that arsenic trioxide (ATO), used for the treatment of acute promyelocytic leukemia (APL), could induce apoptosis at therapeutic concentrations (1–2mM) through the mitochondrial pathway in APL NB4 cells [33].
There is also study shows that AML blast cells have higher copy number of mtDNA and consume more oxygen [34]. When AML cells were treated by tigecycline to inhibit mitochondrial translation, both mitochondrial translated proteins level and oxygen consumption were reduced with subsequent cell death [35]. Moreover, activation of the molecular cascade of apoptosis through mitochondrial is supposed to be an important mechanism by which cytarabine kills cancer cells [35]. Previous research reported that cytarabine could induce the release of reduced form of cytochrome c from mitochondrial into the cytosol and initiated caspase-3 activity, which could prompt apoptotic program and result in cells death in AML cells [36, 37].
We further compared our results with previous studies that focused on the effect of gene expression in cytarabine response or leukemia treatment outcome. In a whole genome expression association (WES) study that focused on cytarabine sensitive and resistant murine cell lines, SLC14A1 was found to be upregulated in cytarabine-resistant cells [38]. Interestingly, SLC14A1 is also included in our gene signature, but in an opposite direction. In our results, SLC14A1 high expression correlated with low IC50 values in blood cancer cell lines and acted as a good prognostic predictor in AML patients for both GSE12417 and TCGA CN-AML datasets. We further queried this gene in GEO database, and found that there were remarkable inter-individual variations in the expression of SLC14A1 in AML patients (Supplementary Figure S1). In the cell line WES study, both B117P and B140P cell lines demonstrated low SLC14A1 expression and could not reflect the expression distribution of SLC14A1 in AML patients [38]. This may therefore lead to the controversial findings. Further mechanism study is needed to confirm whether SLC14A1 expression increases cytarabine response in AML. Another gene, named TAL1, was reported to be associated with outcome of T-cell acute lymphoblastic leukemia [39]. As in our results, high TAL1 expression predicted better prognosis. Three probes in TPD52 were included in our gene signature. Previous study found that high TPD52 expression was correlated with worse outcome in infant ALL, and this was consistent with our results [40]. Moreover, UCK1, SLC25A38, VDAC1 in our signature have been reported to be involved in proliferation or apoptosis of leukemia cell lines [41–43]. We also compared our signature with other prognostic signatures for AML. All the genes but SLC25A37 in our signature were reported for the first time [4, 21, 22, 44, 45]. These indicate that our research tactics might help researchers to find new functionally relevant genes involved in AML progression or cytarabine efficacy.
There are also some limitations for this study. First of all, the data used in this study is obtained from public database, therefore information for some common AML somatic mutations and other known factors affecting AML drug response were not available for constructing prediction model, which may result in uncertainty of whether the chemo-sensitivity score was an independent factor. Integration of gene expression data and somatic mutation data is supposed to build a more precision prediction model. Secondly, only 17 AML cell lines are deposited in GDSC database, and in order to gain better statistic power of linear regression analysis, all the blood cancer cell lines were used to screen the probes that were associated with IC50 of cytarabine. Therefore, this process might cause false positive results due to specificity of blood cancers. Finally, we failed to validate our prediction model in prospective study. Therefore, further studies are required to validate the clinic significance of the model.
In conclusion, we identified a novel gene set that could affect both the cytarabine sensitivity in blood cell lines and OS of AML patients underwent cytarabine therapy. The prediction model based on the gene set could predict prognosis of CN-AML. Most genes included in the set are correlated with mitochondrial, which hints that mitochondrial might be important in cytarabine response and AML outcomes. Our study proposed a new way to identify factors impacting AML prognosis, and this would provide some scientific basis for elucidating the individual difference in outcomes of AML and realizing personalized medicine according to gene expression pattern of AML.
MATERIALS AND METHODS
Samples
GDSC cell lines
The open accessed database GDSC (http://www.cancerrxgene.org/) includes more than 800 cancer cell lines with whole genome mRNA expression, mutation and copy number variation information. Based on GDSC release 5.0, 96 blood cancer cell lines with both natural log transformed IC50 values of cytarabine and normalized whole genome mRNA expression levels were selected in our study (Supplementary Table S1). The whole genome mRNA expression level of the cell lines were detected by Affymetrix GeneChip Human Genome U133A Array. The normalized method was Affymetrix Micro Array Suite 5.0 algorithm. Details for data processing method are described elsewhere [15]. As in some cell lines, mRNA expression levels were tested by more than two microarrays, and mRNA expression level results were randomly selected from one of the arrays during data analysis.
GEO initial sample
The dataset GSE12417 included 242 cytogenetically normal AML patients with whole genome mRNA expression data and clinical prognostic information is available from the GEO database [21]. Three types of arrays were used to detect the whole genome mRNA expression levels: Affymetrix GeneChip Human Genome U133A and U133B arrays (U133 AB sample) for 163 patients, and Affymetrix GeneChip Human Genome U133 plus 2.0 array (U133 plus sample) for the other 79 patients. The MAS5 algorithm was used to normalize the expression data.
TCGA validation sample
The TCGA AML dataset includes 200 de novo patients [46]. As the TCGA dataset is very complex, only patients with cytogenetically normal, non-M3 subtype, induction chemotherapy based on cytarabine, and percentage of blast cells more than 50% were selected in our analysis. Gene expression level of this dataset was detected by Affymetrix GeneChip Human Genome U133 plus 2.0 array and normalized by MAS5 algorithm. The clinical information of TCGA AML dataset was downloaded from cBioPortal, a well-known tool used to extract and manage data from TCGA database [47].
Statistical analysis
Linear-regression analysis was performed to identify probes correlated with cytarabine IC50 in 96 blood cancer cell lines. Probes with P<0.05 were then selected for analysis in the GSE12417 dataset. Multivariate cox regression analysis (including age) was conducted to confirm whether the probes affect OS of CN-AML patients. Probes exhibited significance (p<0.05) in both the linear-regression analysis and the cox regression analysis in the same direction were screened. For example, if high expression of a probe was associated with high cytarabine IC50 value, the high expression of this probe must correlate with poor AML prognosis.
To obtain the chemo-sensitivity score for each patients, the expression values of the selected probes were standardized transformed (centered to a mean of 0 and then scaled the SD). Then, the univariate cox scores (which indicated the correlation between probe expression levels and OS of the AML patients in GSE12417) of the selected probes were acquired and used to calculate combined cox score for each probe by the following formula: CCSi=αi1×β1+αi2×β2, where CCSi was the combined cox score of probe i. Because GSE12417 included two samples, αi1 and αi2 represented the univariate cox score for U133 AB sample and U133 plus sample, respectively; while β1 and β2 were the proportion of U133 AB and U133 plus samples in GSE12417, respectively. To get the chemo-sensitivity score of each sample, the following formula was used: CSj= , where CSj was the chemo-sensitivity score of patient j, n was the number of selected probes, and γij was the expression level of probe i in patient j.
To obtain the Kaplan-Meier plots of chemo-sensitivity score, patients were divided into favorable and unfavorable groups based on their chemo-sensitivity scores. The median was used as cut-point. Patients with chemo-sensitivity scores equal to or higher than the median were classified as unfavorable, the others were classified as favorable. Heatmap.2 command in gplots package was utilized for the cluster analysis. Gene Ontology (GO) and pathway analysis were conducted by the tool David 6.7 (https://david.ncifcrf.gov/). The GO analysis was performed based on biological process (BP), cellular component (CC) and molecular function (MF). The Kaplan-Meier plots were generated by Graphpad 5.0. All of the data arrangement and statistical analysis were conducted by using R (version 3.1.2). Methods flow chart of analysis process was shown in Figure 5.
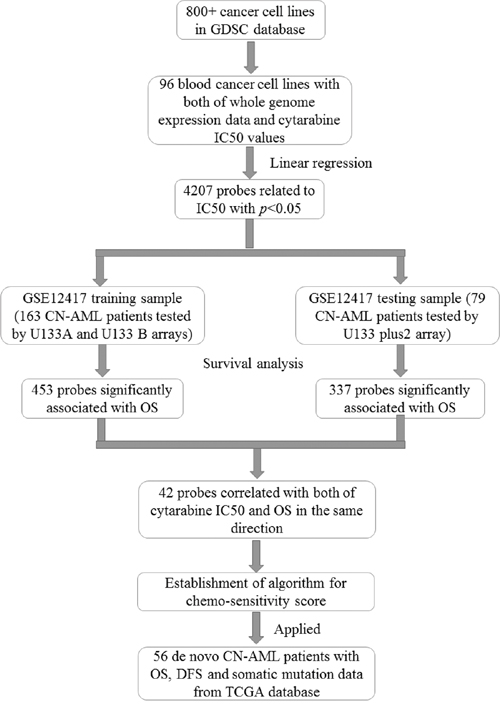
Figure 5: Methods flow chart of analysis process.
ACKNOWLEDGMENTS
We thank all the researchers who have shared the data. This project was supported by Chinese National Science Foundation (No.81403017, No.81422052, No.81673518), National key research and development program (No. 2016YFC0905000), Special topic of the major subject of national science and technology (2012ZX09509-339 107), Hunan Provincial Natural Science Foundation of China (13JJ1010), and Funds for Hunan education department program (No.12K006).
CONFLICTS of INTEREST
The authors declare that they have no competing interests.
REFERENCES
1. Shah A, Andersson TM, Rachet B, Bjorkholm M, Lambert PC. Survival and cure of acute myeloid leukaemia in England, 1971-2006: a population-based study. Br J Haematol. 2013;162:509-516.
2. Derolf AR, Kristinsson SY, Andersson TM, Landgren O, Dickman PW, Bjorkholm M. Improved patient survival for acute myeloid leukemia: a population-based study of 9729 patients diagnosed in Sweden between 1973 and 2005. Blood. 2009;113:3666-3672.
3. McGregor AK, Moulton D, Bown N, Cuthbert G, Bourn D, Mathew S, Dang R, Mounter P, Jones G. Incidence and outcomes for adults diagnosed with acute myeloid leukemia in the north of England: a real world study. Leuk Lymphoma. 2015:1-10.
4. Chuang MK, Chiu YC, Chou WC, Hou HA, Tseng MH, Kuo YY, Chen Y, Chuang EY, Tien HF. An mRNA expression signature for prognostication in de novo acute myeloid leukemia patients with normal karyotype. Oncotarget. 2015;6:39098-39110. doi: 10.18632/oncotarget.5390.
5. Grimwade D, Hills RK, Moorman AV, Walker H, Chatters S, Goldstone AH, Wheatley K, Harrison CJ, Burnett AK, National Cancer Research Institute Adult Leukaemia Working G. Refinement of cytogenetic classification in acute myeloid leukemia: determination of prognostic significance of rare recurring chromosomal abnormalities among 5876 younger adult patients treated in the United Kingdom Medical Research Council trials. Blood. 2010;116:354-365.
6. Kapranov P, Willingham AT, Gingeras TR. Genome-wide transcription and the implications for genomic organization. Nat Rev Genet. 2007;8:413-423.
7. Zhang DY, Yan H, Cao S, Zhang W, Li XL, Zeng H, Chen XP. Wilms Tumor 1 rs16754 predicts favorable clinical outcomes for acute myeloid leukemia patients in South Chinese population. Leuk Res. 2015;39:568-574.
8. Lu JW, Wang AN, Liao HA, Chen CY, Hou HA, Hu CY, Tien HF, Ou DL, Lin LI. Cabozantinib is selectively cytotoxic in acute myeloid leukemia cells with FLT3-internal tandem duplication (FLT3-ITD). Cancer Lett. 2016;376:218-225.
9. Yuan XQ, Zhang DY, Yan H, Yang YL, Zhu KW, Chen YH, Li X, Yin JY, Li XL, Zeng H, Chen XP. Evaluation of DNMT3A genetic polymorphisms as outcome predictors in AML patients. Oncotarget. 2016; 7:60555-60574. doi: 10.18632/oncotarget.11143.
10. Yuan XQ, Peng L, Zeng WJ, Jiang BY, Li GC, Chen XP. DNMT3A R882 Mutations Predict a Poor Prognosis in AML: A Meta-Analysis From 4474 Patients. Medicine. 2016;95:e3519.
11. Metzeler KH, Heilmeier B, Edmaier KE, Rawat VP, Dufour A, Dohner K, Feuring-Buske M, Braess J, Spiekermann K, Buchner T, Sauerland MC, Dohner H, Hiddemann W, et al. High expression of lymphoid enhancer-binding factor-1 (LEF1) is a novel favorable prognostic factor in cytogenetically normal acute myeloid leukemia. Blood. 2012;120:2118-2126.
12. Kuhnl A, Valk PJ, Sanders MA, Ivey A, Hills RK, Mills KI, Gale RE, Kaiser MF, Dillon R, Joannides M, Gilkes A, Haferlach T, Schnittger S, et al. Downregulation of the Wnt inhibitor CXXC5 predicts a better prognosis in acute myeloid leukemia. Blood. 2015;125:2985-2994.
13. Jo A, Mitani S, Shiba N, Hayashi Y, Hara Y, Takahashi H, Tsukimoto I, Tawa A, Horibe K, Tomizawa D, Taga T, Adachi S, Yoshida T, et al. High expression of EVI1 and MEL1 is a compelling poor prognostic marker of pediatric AML. Leukemia. 2015;29:1076-1083.
14. Nowek K, Sun SM, Dijkstra MK, Bullinger L, Dohner H, Erkeland SJ, Lowenberg B, Jongen-Lavrencic M. Expression of a passenger miR-9* predicts favorable outcome in adults with acute myeloid leukemia less than 60 years of age. Leukemia. 2016;30:303-309.
15. Garnett MJ, Edelman EJ, Heidorn SJ, Greenman CD, Dastur A, Lau KW, Greninger P, Thompson IR, Luo X, Soares J, Liu Q, Iorio F, Surdez D, et al. Systematic identification of genomic markers of drug sensitivity in cancer cells. Nature. 2012;483:570-575.
16. McDermott U, Sharma SV, Dowell L, Greninger P, Montagut C, Lamb J, Archibald H, Raudales R, Tam A, Lee D, Rothenberg SM, Supko JG, Sordella R, et al. Identification of genotype-correlated sensitivity to selective kinase inhibitors by using high-throughput tumor cell line profiling. Proc Natl Acad Sci U S A. 2007;104:19936-19941.
17. Barretina J, Caponigro G, Stransky N, Venkatesan K, Margolin AA, Kim S, Wilson CJ, Lehar J, Kryukov GV, Sonkin D, Reddy A, Liu M, Murray L, et al. The Cancer Cell Line Encyclopedia enables predictive modelling of anticancer drug sensitivity. Nature. 2012;483:603-607.
18. Juliusson G, Antunovic P, Derolf A, Lehmann S, Mollgard L, Stockelberg D, Tidefelt U, Wahlin A, Hoglund M. Age and acute myeloid leukemia: real world data on decision to treat and outcomes from the Swedish Acute Leukemia Registry. Blood. 2009;113:4179-4187.
19. Tasaki T, Yamauchi T, Matsuda Y, Takai M, Ookura M, Lee S, Tai K, Ikegaya S, Kishi S, Yoshida A, Urasaki Y, Iwasaki H, Ueda T. The response to induction therapy is crucial for the treatment outcomes of elderly patients with acute myeloid leukemia: single-institution experience. Anticancer Res. 2014;34:5631-5636.
20. Freireich EJ, Gehan EA, Sulman D, Boggs DR, Frei E, 3rd. The effect of chemotherapy on acute leukemia in the human. Journal of chronic diseases. 1961;14:593-608.
21. Metzeler KH, Hummel M, Bloomfield CD, Spiekermann K, Braess J, Sauerland MC, Heinecke A, Radmacher M, Marcucci G, Whitman SP, Maharry K, Paschka P, Larson RA, et al. An 86-probe-set gene-expression signature predicts survival in cytogenetically normal acute myeloid leukemia. Blood. 2008;112:4193-4201.
22. Gentles AJ, Plevritis SK, Majeti R, Alizadeh AA. Association of a leukemic stem cell gene expression signature with clinical outcomes in acute myeloid leukemia. Jama. 2010;304:2706-2715.
23. Garzon R, Volinia S, Papaioannou D, Nicolet D, Kohlschmidt J, Yan PS, Mrozek K, Bucci D, Carroll AJ, Baer MR, Wetzler M, Carter TH, Powell BL, et al. Expression and prognostic impact of lncRNAs in acute myeloid leukemia. Proc Natl Acad Sci U S A. 2014;111:18679-18684.
24. Yang W, Soares J, Greninger P, Edelman EJ, Lightfoot H, Forbes S, Bindal N, Beare D, Smith JA, Thompson IR, Ramaswamy S, Futreal PA, Haber DA, et al. Genomics of Drug Sensitivity in Cancer (GDSC): a resource for therapeutic biomarker discovery in cancer cells. Nucleic Acids Res. 2013;41:D955-961.
25. Fernandez-Calotti P, Jordheim LP, Giordano M, Dumontet C, Galmarini CM. Substrate cycles and drug resistance to 1-beta-D-arabinofuranosylcytosine (araC). Leuk Lymphoma. 2005;46:335-346.
26. Galmarini CM, Thomas X, Calvo F, Rousselot P, El Jafaari A, Cros E, Dumontet C. Potential mechanisms of resistance to cytarabine in AML patients. Leuk Res. 2002;26:621-629.
27. Styczynski J. Drug resistance in childhood acute myeloid leukemia. Current pharmaceutical biotechnology. 2007;8:59-75.
28. Zamzami N, Susin SA, Marchetti P, Hirsch T, Gomez-Monterrey I, Castedo M, Kroemer G. Mitochondrial control of nuclear apoptosis. The Journal of experimental medicine. 1996;183:1533-1544.
29. Zamzami N, Marchetti P, Castedo M, Decaudin D, Macho A, Hirsch T, Susin SA, Petit PX, Mignotte B, Kroemer G. Sequential reduction of mitochondrial transmembrane potential and generation of reactive oxygen species in early programmed cell death. The Journal of experimental medicine. 1995;182:367-377.
30. Basak NP, Banerjee S. Mitochondrial dependency in progression of acute myeloid leukemia. Mitochondrion. 2015;21:41-48.
31. Vo TT, Ryan J, Carrasco R, Neuberg D, Rossi DJ, Stone RM, Deangelo DJ, Frattini MG, Letai A. Relative mitochondrial priming of myeloblasts and normal HSCs determines chemotherapeutic success in AML. Cell. 2012;151:344-355.
32. Xiao X, Yang J, Li R, Liu S, Xu Y, Zheng W, Yi Y, Luo Y, Gong F, Peng H, Pei M, Deng M, Zhang G. Deregulation of mitochondrial ATPsyn-beta in acute myeloid leukemia cells and with increased drug resistance. PLoS One. 2013;8:e83610.
33. Wang R, Xia L, Gabrilove J, Waxman S, Jing Y. Downregulation of Mcl-1 through GSK-3beta activation contributes to arsenic trioxide-induced apoptosis in acute myeloid leukemia cells. Leukemia. 2013;27:315-324.
34. Boultwood J, Fidler C, Mills KI, Frodsham PM, Kusec R, Gaiger A, Gale RE, Linch DC, Littlewood TJ, Moss PA, Wainscoat JS. Amplification of mitochondrial DNA in acute myeloid leukaemia. Br J Haematol. 1996;95:426-431.
35. Skrtic M, Sriskanthadevan S, Jhas B, Gebbia M, Wang X, Wang Z, Hurren R, Jitkova Y, Gronda M, Maclean N, Lai CK, Eberhard Y, Bartoszko J, et al. Inhibition of mitochondrial translation as a therapeutic strategy for human acute myeloid leukemia. Cancer cell. 2011;20:674-688.
36. Kim CN, Wang X, Huang Y, Ibrado AM, Liu L, Fang G, Bhalla K. Overexpression of Bcl-X(L) inhibits Ara-C-induced mitochondrial loss of cytochrome c and other perturbations that activate the molecular cascade of apoptosis. Cancer Res. 1997;57:3115-3120.
37. Liu X, Kim CN, Yang J, Jemmerson R, Wang X. Induction of apoptotic program in cell-free extracts: requirement for dATP and cytochrome c. Cell. 1996;86:147-157.
38. Rathe SK, Largaespada DA. Deoxycytidine kinase is downregulated in Ara-C-resistant acute myeloid leukemia murine cell lines. Leukemia. 2010;24:1513-1515.
39. van Grotel M, Meijerink JP, van Wering ER, Langerak AW, Beverloo HB, Buijs-Gladdines JG, Burger NB, Passier M, van Lieshout EM, Kamps WA, Veerman AJ, van Noesel MM, Pieters R. Prognostic significance of molecular-cytogenetic abnormalities in pediatric T-ALL is not explained by immunophenotypic differences. Leukemia. 2008;22:124-131.
40. Kang H, Wilson CS, Harvey RC, Chen IM, Murphy MH, Atlas SR, Bedrick EJ, Devidas M, Carroll AJ, Robinson BW, Stam RW, Valsecchi MG, Pieters R, et al. Gene expression profiles predictive of outcome and age in infant acute lymphoblastic leukemia: a Children's Oncology Group study. Blood. 2012;119:1872-1881.
41. Valencia A, Masala E, Rossi A, Martino A, Sanna A, Buchi F, Canzian F, Cilloni D, Gaidano V, Voso MT, Kosmider O, Fontenay M, Gozzini A, et al. Expression of nucleoside-metabolizing enzymes in myelodysplastic syndromes and modulation of response to azacitidine. Leukemia. 2014;28:621-628.
42. Chen H, Lu Q, Zhang Y, Zhang C, Zhang H, Xu H. Overexpression of SLC25A38 protein on acute lymphoblastic leukemia cells. Oncology letters. 2014;7:1422-1426.
43. Prezma T, Shteinfer A, Admoni L, Raviv Z, Sela I, Levi I, Shoshan-Barmatz V. VDAC1-based peptides: novel pro-apoptotic agents and potential therapeutics for B-cell chronic lymphocytic leukemia. Cell death & disease. 2013;4:e809.
44. Radmacher MD, Marcucci G, Ruppert AS, Mrozek K, Whitman SP, Vardiman JW, Paschka P, Vukosavljevic T, Baldus CD, Kolitz JE, Caligiuri MA, Larson RA, Bloomfield CD. Independent confirmation of a prognostic gene-expression signature in adult acute myeloid leukemia with a normal karyotype: a Cancer and Leukemia Group B study. Blood. 2006;108:1677-1683.
45. Bullinger L, Dohner K, Bair E, Frohling S, Schlenk RF, Tibshirani R, Dohner H, Pollack JR. Use of gene-expression profiling to identify prognostic subclasses in adult acute myeloid leukemia. The New England journal of medicine. 2004;350:1605-1616.
46. Genomic and epigenomic landscapes of adult de novo acute myeloid leukemia. The New England journal of medicine. 2013;368:2059-2074.
47. Gao J, Aksoy BA, Dogrusoz U, Dresdner G, Gross B, Sumer SO, Sun Y, Jacobsen A, Sinha R, Larsson E. Integrative analysis of complex cancer genomics and clinical profiles using the cBioPortal. Science signaling. 2013;6:pl1.