
INTRODUCTION
Prostate cancer (PCa) is the most frequently diagnosed cancer and the second leading cause of cancer related death among men in developed countries [1]. Nevertheless, the currently used diagnostic methods for PCa detection are far from ideal. Both, prostate-specific antigen (PSA) serum measurement, and digital rectal examination (DRE) present a low specificity. As a result, a significant rate of unnecessary prostate biopsies (PB) is practiced [2]. There is therefore still a clear need for new biomarkers for a fast and reliable diagnosis of PCa.
Because of the prostate location in the body, in direct contact with the urethra, prostate (cancer) secrete products can be detected in urine. Consequently, urine has been intensively studied as a liquid biopsy source of biomarkers for PCa [3–6]. However, the low protein concentration, the presence of salts and the vast dynamic range of protein expression in urine turn it into a particularly complicated fluid for the discovery of protein-based biomarkers [7].
A rich source for prostate-derived products in urine are extracellular vesicles (EVs) such as exosomes, 50-150 nm sized membrane vesicles that are shed by many mammalian cell types, including malignant cells and formed within the endosomal network and released upon fusion of multi-vesicular bodies with the plasma membrane [8]. In the past decade, EVs have been recognized as potent vehicles of intercellular communication, both in prokaryotes and eukaryotes. This is due to their capacity to transfer proteins, lipids and nucleic acids, thereby influencing various physiological and pathological functions of both, recipient and parent cells [8]. Consequently they have been pointed out as a promising easily accessible biomarker reservoir, as their content (such as proteins, lipids, DNA, and RNA) is thought to reflect the molecular composition of their tissue of origin [9–11]. The potential of using EVs as source of PCa biomarkers as a strategy to overcome the dynamic range challenge in urine has generated considerable interest in the last years. When EVs are purified from the whole urine sample, their protein content is highly enriched while at the same time high-abundance soluble proteins are removed, enhancing the detectability of low-abundance proteins [12, 13]. The analysis of the content of EVs harvested from urine appears to have important advantages such as i) urine collection is a non-invasive procedure, ii) the proteomic and genomic material within EVs is protected from enzyme degradation by the vesicles lipid bilayer [14], and iii) EVs are stable after long-term storage at -80°C, which makes prospective studies feasible [13].
One of the most significant challenges involving the use of EVs for the discovery of new biomarkers is the lack of standardized and reliable isolation methods. The isolation of exosomes from biological fluids is rather complex, due to the presence of protein aggregates and other types of vesicles (such as microvesicles and apoptotic bodies), which are frequently co-isolated with the population of interest [15]. Accordingly, the best procedure for EVs purification remains a discussion topic in the field, with ultracentrifugation being the most frequently used method [16, 17].
Nevertheless, previous reports have indicated urinary EVs to be an excellent source of PCa protein biomarkers. In 2009, Mitchell et al. analyzed the proteomic content of urinary EVs from 10 healthy donors and 10 PCa patients who were undergoing hormonal therapy prior to radical radiotherapy. In this cohort, PSA and Prostate-Specific Membrane Antigen (PSMA) were found to be present in almost all of the PCa specimens, but not in the healthy donor specimens [18]. A later study characterized EVs preparations in pooled post-DRE urine samples using a shotgun proteomics procedure identifying around 900 proteins [19, 20]. Since then, several studies have emerged to determine the role of extracellular vesicles in urological malignancies [21–23].
In our study, we used a targeted proteomics approach to specifically quantify a set of 64 proteins in urinary EVs in the context of PCa biomarker validation in a cohort of 107 individual urine-derived human samples. Our study resulted in the identification of a protein biomarker combination present in urinary EVs that exhibits better sensitivity and specificity than the currently available biomarkers used for PCa detection and patient stratification. Therefore, the protein combination reported here improves the detection and management of PCa, avoiding the over-diagnosis and over-treatment associated with the currently used screening methods.
RESULTS
In this work we used a targeted proteomics approach to specifically quantify a set of 64 proteins in urinary EVs in the context of PCa biomarker validation in a cohort of 107 individual urine-derived human samples. Initially a cohort of 107 urine samples was collected after DRE and EVs were isolate. We then measured protein abundance changes in urinary EVs by SRM, and we built protein-based panels for PCa diagnosis and prognosis in urinary EVs, which we also checked in tissue microarrays analysis.
EVs isolation from post-DRE urine samples
Several approaches were followed in order to assess the purity of the isolated urinary EVs. Urine EVs were observed using a transmission electron microscope (TEM). The TEM images showed vesicles of the expected size, presenting the cup-shaped morphology typical of EVs (Figure 1A) [24]. In addition, NTA and protein quantification data for all samples (n=107) were used to assess the protocol performance. A linear regression analysis showed a good correlation (r=0.85 with p<0.001) between the number of vesicles and total amount of protein extracted, thus indicating that at least an important part of the protein content in the EVs pellet did indeed belong to the vesicles quantified by NTA (Figure 1B). Finally, the presence of known EVs markers, such as TSG101 (tumor susceptibility gene 101), CD81 or Rab5, was confirmed by Western blot (Figure 1C).
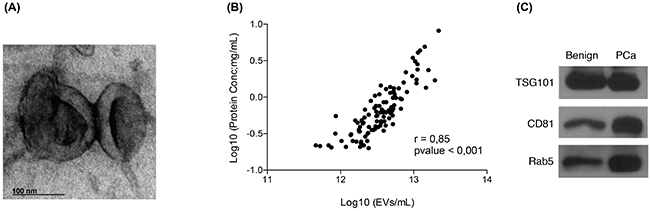
Figure 1: Quality assessment of the EVs isolation process. A. Transmission electron microscopy images of EVs isolated from post-DRE urine; B. Linealregression analysis showing a good correlation between the number of EVs counted by NTA and the total amount of protein recovered from the same sample; C. Western blot analysis of TSG101, CD81 and Rab5, described in the literature as EVs markers, were performed in EVs isolated from post-DRE urine. Benign and PCa samples were pooled to obtain representative and sufficient material.
Validation of protein abundance changes in urinary EVs by SRM
The 107 urine samples collected after DRE were divided into two groups: PCa patient samples (n=53), which include 22 low-grade PCa (Gleason score ≤ 7 (3+4)) and 31 high-grade PCa (Gleason score ≥ 7 (4+3)); and control samples (n=54).
A total of 64 protein candidate biomarkers were selected for quantitation by SRM (Supplementary Table ST1). One proteotypic peptide was selected per protein and a scheduled-SRM method was used to allow the monitoring of all 64 proteins in one single run. To ensure that the selected peptides correctly represented the true fold-changes of the targeted proteins, we used a previously in-house shotgun dataset to identify quantotypic peptides for the selected proteins (see Methods section). As a result of these SRM experiments, we observed that 14 out of the 64 initial proteins exhibited a significant different abundance between benign and PCa samples (Table 1), of which 11 had higher protein levels in urine EVs of PCa patients while 3 showed higher levels in urine EVs of control patients. Interestingly, when low- and high-grade PCa samples were compared, 45 out of the 64 measured proteins showed significantly different abundance levels (Table 2), with all proteins exhibiting higher levels in low-grade patients (44 proteins).
Table 1: Targeted proteins exhibiting abundance changes in urinary exosomes between PCa patients and benign controls
Gene symbol |
Protein |
Uniprot accession |
FDR |
FC (PCa vs. Benign) |
|---|---|---|---|---|
ADSV |
Adseverin |
Q9Y6U3 |
0.002 |
1.34 |
GNS |
N-acetylglucosamine-6-sulfatase |
P15586 |
0.002 |
1.40 |
TGM4 |
Transglutaminase-4 |
P49221 |
0.002 |
0.60 |
CA4 |
Carbonic anhydrase 4 |
P22748 |
0.002 |
1.40 |
TSG101 |
Tumor susceptibility gene 101 protein |
Q99816 |
0.011 |
1.22 |
VPS28 |
Vacuolar protein sorting-associated protein 28 homolog |
Q9UK41 |
0.011 |
1.20 |
SLC44A4 |
Choline transporter-like protein 4 |
Q53GD3 |
0.013 |
1.24 |
SLC26A4 |
Pendrin |
O43511 |
0.020 |
1.21 |
ITGB3 |
Integrin β3 |
P05106 |
0.020 |
1.22 |
PRSS8 |
Prostasin |
Q16651 |
0.020 |
0.83 |
SDCBP2 |
Syntenin-2 |
Q9H190 |
0.020 |
1.20 |
TSPAN9 |
Tetraspanin-9 |
O75954 |
0.022 |
1.17 |
ITGAV |
Integrin αV |
P06756 |
0.047 |
1.20 |
PPAP |
Prostatic acid phosphatase |
P15309 |
0.047 |
0.75 |
Proteins showing significant protein abundance changes in the SRM analysis (adjusted p-value < 0.05) between benign and PCa patients are shown. Proteins with higher abundance in PCa are represented by fold change values > 1, while values < 1 indicate decreased protein levels in PCa. False discovery rate (FDR); fold change (FC).
Table 2: Targeted proteins exhibiting abundance changes in urinary exosomes between high and low-grade patients
Gene symbol |
Protein |
Uniprot accession |
FDR |
FC (High vs. Low) |
|---|---|---|---|---|
PPAP |
Prostatic acid phosphatase |
P15309 |
< 0.001 |
0.37 |
PSA |
Prostate-specific antigen |
P07288 |
< 0.001 |
0.44 |
CD63 |
CD63 antigen |
P08962 |
< 0.001 |
0.46 |
SPHM |
N-sulphoglucosamine sulphohydrolase |
P51688 |
< 0.001 |
0.45 |
GLPK5 |
Putative glycerol kinase 5 |
Q6ZS86 |
< 0.001 |
0.47 |
FAM177A1 |
Protein FAM177A1 |
Q8N128 |
< 0.001 |
0.46 |
GLIPR2 |
Golgi-associated plant pathogenesis-related protein 1 |
Q9H4G4 |
< 0.001 |
0.50 |
DNASE1 |
Deoxyribonuclease-1 |
P24855 |
< 0.001 |
0.54 |
STEAP2 |
Metalloreductase STEAP2 |
Q8NFT2 |
< 0.001 |
0.58 |
TOLLIP |
Toll-interacting protein |
Q9H0E2 |
< 0.001 |
0.55 |
ATP8B1 |
Phospholipid-transporting ATPase IC |
O43520 |
< 0.001 |
0.70 |
RRAS |
Ras-related protein R-Ras |
P10301 |
< 0.001 |
0.67 |
CIB1 |
Calcium and integrin-binding protein 1 |
Q99828 |
< 0.001 |
0.69 |
SLC26A2 |
Sulfate transporter |
P50443 |
< 0.001 |
0.65 |
CD82 |
CD82 antigen |
P27701 |
< 0.001 |
0.73 |
GALK1 |
Galactokinase |
P51570 |
< 0.001 |
0.69 |
TOM1L2 |
TOM1-like protein 2 |
Q6ZVM7 |
< 0.001 |
0.64 |
ATP6V0D1 |
V-type proton ATPase subunit d 1 |
P61421 |
< 0.001 |
0.68 |
TMPRSS2 |
Transmembrane protease serine 2 |
O15393 |
< 0.001 |
0.65 |
PPAP2A |
Lipid phosphate phosphohydrolase 1 |
O14494 |
< 0.001 |
0.57 |
GNG4CRYZDBNL |
Drebrin-like protein |
Q9UJU6 |
0.001 |
0.82 |
RPSA |
40S ribosomal protein SA |
P08865 |
0.001 |
0.74 |
GSS |
Glutathione synthetase |
P48637 |
0.001 |
0.71 |
STEAP4 |
Metalloreductase STEAP4 |
Q687X5 |
0.002 |
0.68 |
PYGL |
Glycogen phosphorylase, liver form |
P06737 |
0.002 |
0.74 |
NUDT2 |
Bis(5'-nucleosyl)-tetraphosphatase [asymmetrical] |
P50583 |
0.002 |
0.65 |
TSPAN9 |
Tetraspanin-9 |
O75954 |
0.003 |
0.80 |
UBC |
Polyubiquitin-C |
P0CG48 |
0.004 |
0.73 |
TMBIM1 |
Protein lifeguard 3 |
Q969X1 |
0.004 |
0.70 |
FAM49B |
Protein FAM49B |
Q9NUQ9 |
0.005 |
0.79 |
PTPN13 |
Tyrosine-protein phosphatase non-receptor type 13 |
Q12923 |
0.006 |
0.78 |
LPAR3 |
Lysophosphatidic acid receptor 3 |
Q9UBY5 |
0.007 |
0.72 |
DPP3 |
Dipeptidyl peptidase 3 |
Q9NY33 |
0.010 |
0.73 |
GNS |
N-acetylglucosamine-6-sulfatase |
P15586 |
0.013 |
0.74 |
MPI |
Mannose-6-phosphate isomerase |
P34949 |
0.015 |
0.76 |
TSG101DPYS |
Dihydropyrimidinase |
Q14117 |
0.021 |
0.77 |
PCYT2 |
Ethanolamine-phosphate cytidylyltransferase |
Q99447 |
0.021 |
0.80 |
VTN |
Vitronectin |
P04004 |
0.024 |
1.31 |
PDCD6IPVPS26AABHD17C |
Alpha/beta hydrolase domain-containing protein 17C |
Q6PCB6 |
0.031 |
0.87 |
ADSV |
Adseverin |
Q9Y6U3 |
0.034 |
0.81 |
Proteins showing significant protein abundance changes in the SRM analysis (adjusted p-value < 0.05) between high- and low-grade PCa patients are shown. Proteins with higher abundance in high-grade patients are represented by fold change values > 1, while values < 1 indicate decreased protein levels in high grade patients (i.e. patients with bad prognosis). False discovery rate (FDR); fold change (FC).
To evaluate whether the proteins that were significantly changing in abundance as found by SRM-proteomics could be validated by an independent method (Figure 2A-2B), we performed antibody-based immunoblotting in a subset of urinary EVs samples from the same cohort of patients. Among the known EVs markers such as CD9, TSG101 or CD63, protein CD81 was used as an EVs-related marker in our study. Although these are generally accepted by the scientific community as proteins commonly found in EVs [25], they have been found to present different abundance levels in the presence of disease [11]. The results obtained were in agreement with the protein quantitation obtained by SRM (Figure 2C-2D).
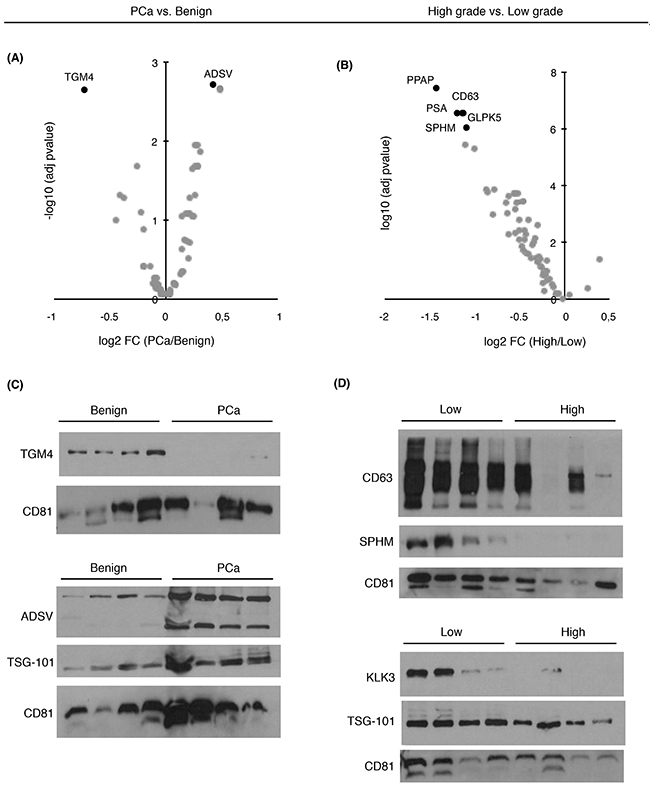
Figure 2: Abundance changes and diagnostic/prognostic evaluation of targeted proteins in urinary EVs. Volcano plots represent differentially expressed target proteins in urinary EVs from A. PCa vs. benign patients and B. from high- vs. low-grade patients; C. Western blot of TGM4 and ADSV in a selected set of benign and PCa samples; D. Western blot of CD63, SPHM, TSG101 and PSA in a selected set of low and high-grade PCa samples. CD81 was used as EVs related marker.
Protein-based panels for PCa diagnosis and prognosis in urinary EVs
Individual ROC curves and the AUC values were calculated for each individual quantified protein. Previous studies described that combining multiple proteins might improve the diagnostic performance over the use of single biomarkers, as single markers may not necessarily reflect the multifactorial nature of PCa neither have the necessary prediction power for patient classification [26]. Therefore, in order to compute a protein combination with better diagnostic power we fitted abundances of differentially expressed proteins (Figure 3A–3B) into a logistic regression model and checked the AUC for each protein combination. We identified a protein combination formed by TGM4 and ADSV (Figure 3C), which had better sensitivity and specificity (AUC = 0.65, CI95: 0.55-0.76) while the accuracy obtained by each individual protein was low (TGM4 AUC = 0.58; ADSV AUC = 0.58). This result evidenced that the combination of two different proteins improved the ability to distinguish benign from PCa samples.
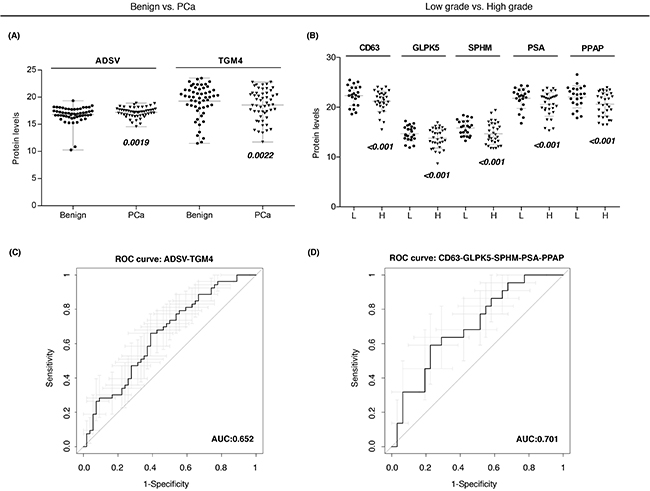
Figure 3: Protein-based panels for PCa diagnosis and prognosis. A-B. Scatter plots representing the protein abundance levels of selected proteins that are part of diagnostic and prognostic panels, respectively; C-D. ROC curves of protein-based panels for PCa diagnosis (ADSV + TGM4) and prognosis (CD63 + GLPK5 + SPHM + PSA + PPAP).
Next, we also evaluated protein combinations that could correctly classify low and high-grade tumors. Individual markers such as CD63 (AUC = 0.65), GLPK5 (AUC = 0.64), PSA (AUC = 0.66), PPAP (AUC = 0.64) and SPHM (AUC = 0.61) were among the single-protein panels with best sensitivity and specificity. However, it was the combination of these five protein abundances that rendered the best protein panel to distinguish patients with low-grade and high-grade tumors (PPAP + PSA + CD63 + SPHM + GLPK5; AUC = 0.70, CI95: 0.56-0.84) (Figure 3D).
Tissue microarrays analysis for tissue validation of PCa biomarkers
The most promising EVs biomarkers found in the protein combination models, such as ADSV and TGM4 (for the benign vs. PCa comparison) and CD63, GLPK5 and SPHM (for the low-grade vs. high-grade comparison) were further evaluated in patient tissues from radical prostatectomies using tissue microarrays (TMAs).
In agreement with the expression in urine EVs, IHC on prostate TMA-tissues revealed that both PCa diagnostic biomarkers, ADSV and TGM4, were also altered in terms of protein detection (ADSV p < 0.001; TGM4 p < 0.001) when comparing 98 benign prostatic tissues versus 136 PCa tissues (Figure 4A–4B). We then analyzed the ability of these two proteins to correctly classify patients when directly detected in prostate tissue. ROC curves for both, ADSV and TGM4, individual proteins were generated, obtaining an AUC of 0.81 (CI95: 0.74-0.88) for TGM4, and an AUC of 0.73 (CI95: 0.65-0.81) for ADSV (Figure 4C). Additionally, taking into account the clinical progression of each patient, we tested ADSV and TGM4 as potential prognostic biomarkers and assessed their performance in distinguishing between i) low- versus high-grade patients (as defined for the urinary EVs experiments); ii) groups of patients who presented biochemical recurrence (BCR) versus patients who did not. The analyses revealed that TGM4 could indeed differentiate between the low and high-grade groups with high sensitivity and specificity (p < 0.001; AUC = 0.82, CI95: 0.71-0.92) (Figure 4D–4E) as well as between the BCR versus no BCR groups (p < 0.001; AUC = 0.80, CI95: 0.69-0.91) (Figure 4F–4G). These results suggest that the proteins identified in urinary EVs reflect histological changes and may have a functional role in PCa development since we also find them altered in PCa tissue.
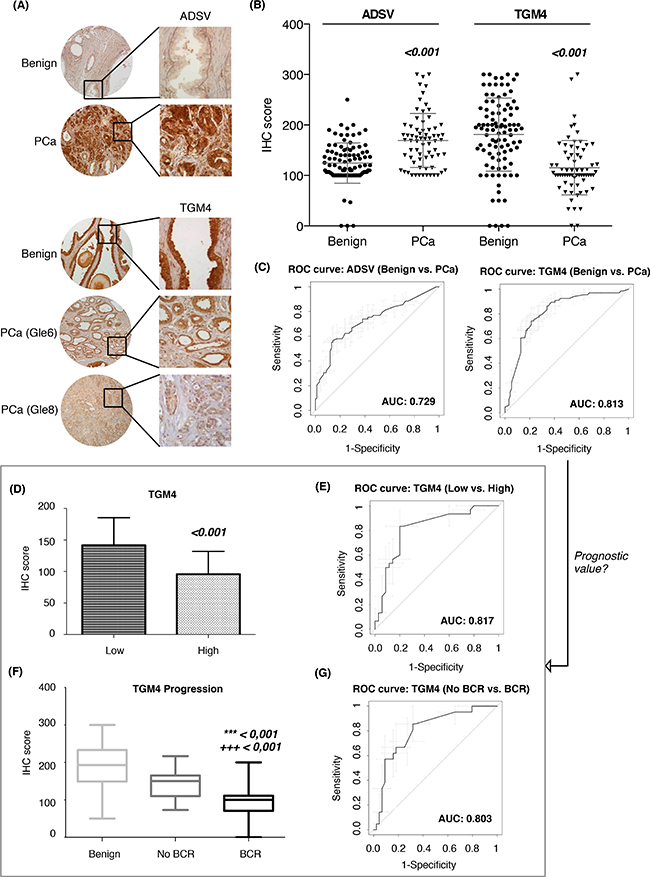
Figure 4: Assessment of PCa diagnostic biomarkers in tissue microarrays. A. Tissue microarrays images with immunohistochemistry results for ADSV and TGM4; B. Scatter plots representing immunohistochemistry scores (IHC) of ADSV and TGM4 in benign and PCa FFPE tissue from PCa patients; C. Diagnostic performance represented by a ROC curve of ADSV and TGM4 individually. Prognostic value of TGM4 represented as IHC score (D) and ROC curve (E) between low vs. high-grade patients. Relation between TGM4 and PCa progression is showed as IHC score (F) and ROC curve (G) between patients with and without biochemical recurrence (BCR). Values that are significantly different by the Mann-Whitney test from the control group are indicated by p-value < 0.001 (*** vs. benign; +++ vs. No BCR).
The profile of urinary EVs proteins obtained by SRM analysis after comparing low versus high-grade PCa patients (CD63, GLPK5 and SPHM), was also validated in tissue samples by using TMAs. CD63 was detected at significantly different levels in tissue between low- versus high-grade PCa patients (p = 0.021), but resulted a modest patient classifier (AUC = 0.62, CI95: 0.51-0.74) (Figure 5A–5C). Similarly, when classifying patients with BCR versus patients without BCR, GLPK5 was able to differentiate between the two groups (p = 0.013; AUC = 0.64, CI95: 0.54-0.73) (Figure 5D–5F) and, furthermore, taking into account only the patients of Gleason 7, the patients that had been developed BCR showed significantly lower levels of GLPK5 (p = 0.0015) (Supplementary Figure SF1). Finally, SPHM did not show, neither significant value when comparing low- versus high-grade PCa patients, nor when comparing PCa patients with and without BCR.
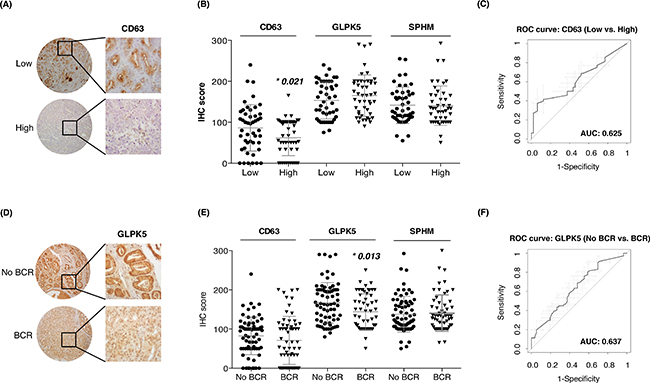
Figure 5: Assessment of aggressive PCa biomarkers in tissue microarrays. A-B. Scatter plots representing immunohistochemistry scores (IHC) of CD63, GLPK5 and SPHM in PCa FFPE tissue from low and high-grade PCa patients; C. ROC curve of CD63 biomarker performance; D-E. Scatter plots representing IHC scores of CD63, GLPK5 and SPHM in PCa FFPE tissue from patients with and without biochemical recurrence (BCR); F. ROC curve of GLPK5 biomarker performance. Significantly different values were assessed by the Mann-Whitney test and are indicated by *p-value < 0.05.
DISCUSSION
Nowadays, there is still a clear clinical need to identify new biomarkers that improve the early non-invasive detection and stratification of PCa patients. Within this context, the use of EVs as source of new biomarkers is under intense investigation, especially because they can be obtained by non-invasive methods using urine samples.
Recently, transcriptomic analysis of urinary EVs from PCa patients has been carried out with promising results for Cadherin 3, which shows a decreased abundance in PCa samples as a source of biomarkers [27] and the use of microRNAs as markers for this disease has also been extensively reported [28]. In this work, we have performed targeted proteomics and immunoblotting techniques to address this question. Our results show that alterations detected in urinary EVs reflect the protein changes in the prostate tissue and highlight the potential of SRM targeted proteomics as diagnostic assay for liquid biopsies via urinary EVs to improve diagnosis and detect PCa patients with a poor prognosis.
PCa diagnosis and prognosis protein-based panels in urinary EVs
Current diagnostic techniques for PCa are based on a measurement of serum PSA and DRE, but decisive PCa diagnosis is based on PB, which is indicated when patients present serum PSA above 4 ng/mL. Furthermore, repeat PB is indicated for patients who have a prior negative biopsy but continue to have an elevated serum PSA or abnormal DRE, or as follow-up of previous pathologic diagnoses of pre-malignant HGPIN [29]. The lack of specificity of the above-mentioned tools urges for the identification of new biomarkers using non-invasive methods that improve the early diagnosis of PCa. Although different PSA isoforms have been analyzed across multiple studies; the AUC value of total serum PSA (biomarker used in the clinic) has been estimated to be around 0.6 [30].
In our study, a total of 64 previously identified candidate biomarkers for PCa in urinary EVs were validated in a large cohort of samples (n=107) by SRM. Whereas immunological methods like TMA or ELISA represent the traditional way of validation, targeted MS-based approaches like SRM are emerging as additional alternatives [31]. In this study, SRM methodology was applied in order to facilitate the simultaneous quantification of a large number of candidate proteins in a large cohort of samples. The presence of several of these proteins had already been described in prostate-related urinary EVs by others [19], which proved to be good candidates as PCa biomarkers.
In terms of diagnosis, our urinary EVs diagnostic panel (AUC=0.65) slightly improves the diagnostic performance of serum PSA. However, considering the promising potential that EVs have shown as a source of biomarkers, further studies will be conducted to verify if this diagnostic panel, in combination with current screening tools, could increase the efficiency in detecting PCa and avoid unnecessary biopsies.
From a prognosis point of view, controversy exists regarding the potential of PSA as a prognostic biomarker. Although often serum PSA has higher expression in more aggressive PCa patients [32], it is often found decreased together with several EVs markers, including PSMA, CD9, TSG101, miR-21 and miR-375 among others. In agreement with these observations, we detected decreased PSA levels in urinary EVs [18, 33]. The abundance of PSA within urinary EVs in combination with the protein abundance of four more proteins (CD63, GLPK5, SPHM and PAPP) results in an AUC value of 0.70, for detecting PCa patients with a poor prognosis. These findings are in agreement with a previous report describing that a combination of PSA to CD63 or CD9 improves the detection of PCa. Whether the decrease in prostate-related markers is due to a decrease in the quantity of prostate secreted EVs number within urine, or a change in protein expression profile within prostate (cancer) secreted EVs remains to be clarified [34].
Changes in EVs protein abundances reflect alterations in prostate tissue
TMAs of PCa patients were used to directly detect each selected protein profile and determine if the observed protein content in urinary EVs reflected changes in the prostate tissue. All patients included in the study presented > 7 years of follow up after surgery, therefore, we were able to correlate the results not only with the presence of the disease and Gleason score but also with their clinical progression (BCR after RP).
The protein abundance changes observed in urinary EVs of ADSV and TGM4 were validated in prostate tissue by IHC analysis and resulted to have even a better AUC value. This result suggest that developing new techniques to pre-selecting certain subtypes of vesicles may lead to better diagnosis performance. ADSV, also known as scinderin (SCIN), has been implicated in the translocation of secretory vesicles directed to be exocytosed [35, 36]. ADSV has been found highly expressed in human PCa tissue, and has been described to be critical for the proliferation of PCa cells [37].
In addition, the IHC analysis also identified a relationship between TGM4 protein levels and Gleason score as well as BCR development decreasing significantly in those patients with a poor prognosis. TGM4 is a protein almost uniquely expressed in the prostate gland [38] and it has been described to be down-regulated in PCa tissue [39]. This protein was previously measured in urinary secretions from patients with extra-capsular or organ-confined PCa. Although its diagnostic power was not evaluated, TGM4 was shown to be down-regulated in poor prognostic PCa [40]. Despite the controversy about the expression of TGM4 in PCa, these previous studies combined with our findings may indicate a possible role of TGM4 as a tumor suppressor gene and, after a further validation in a larger cohort of patients, its potential use not only as a PCa diagnostic biomarker in urinary EVs, but also to identify the poor prognosis patients using biopsies or tissue samples from radical prostatectomy. Thus, ADSV and TGM4 appear to be promising candidates to be confirmed in future studies aimed to establish their possible roles in PCa clinical outcome.
The defined prognostic urinary EVs protein profile (CD63, GLPK5 and SPHM) was also validated by TMA. PSA and PPAP were discarded from the TMA study due to extensive previous research already available in the literature. PSA is strongly expressed in the prostate, both in benign and neoplastic tissue. However, IHC staining detected a lower abundance in cancer compared to the adjacent benign epithelium, which decreased according to less differentiate PCa [41–43]. Similarly, PPAP immunoreactivity has also been demonstrated to be more intense in the benign prostate epithelium and detected at lower levels in PCa [41]. These observations are consistent with the levels we have detected for these two proteins in the urinary EVs. Among the prognostic proteins, it is worth mentioning that CD63 is mainly associated with membranes of intracellular vesicles, although cell surface expression may also be induced. It has been shown that prostate basal epithelial cells do not express the characteristic CD antigens of secretory cells, however the expression levels of CD63 found in cancer cells are similar to that of secretory cells [44]. Surprisingly, our study revealed that decreased protein levels of CD63 in EVs fractions as well as in prostate tissue could indicate poor prognosis of PCa. Similar results were obtained with GLPK5 (glycerol Kinase 5) taking into account the BCR development, however, it is worth noting that this protein was able to distinguish patients with Gleason score 7 who developed BCR from those who did not, therefore, this candidate could be useful in predicting tumor behavior in patients with uncertain risk of progressing. From a functional point of view, further studies will be required to understand the role of this protein in PCa development and progression.
Urinary EVs as a source of disease biomarkers in liquid biopsies
PCa is a clinically heterogeneous and often multifocal disease with a clinical outcome difficult to predict. Proteomics data give a different level of understanding and together with the innovative high-throughput technologies is a promising way to identify new biomarkers for PCa detection, prognosis and therapy [45]. In this work we combined this strategy with the isolation of urinary EVs to identify new protein biomarker panels for PCa diagnosis (TGM4 and ADSV) and for patient stratification (PSA, PPAP, CD63, GLPK5 and SPHM).
The strategy presented in this manuscript highlights the potential of liquid biopsies via urinary EVs isolation for the diagnosis and PCa stratification, and its associated clinical research. Biomarker detection from urinary EVs is capable of distinguishing aggressive from clinically insignificant PCa and other benign conditions beyond serum PSA and, thus, it might avoid PCa related over-diagnosis and over-treatment. Taking all together, we conclude that the future of the diagnosis and prognosis in PCa will benefit from research of biomarkers in EVs, leading to an improvement in therapeutic decision making with liquid biopsies.
METHODS
Experimental design and statistical rationale
This is a retrospective case-control study to identify biomarkers associated to PCa. The main objectives are to assess the potential of urinary EVs as a source of PCa biomarkers and to evaluate a different biomarker candidates previously identified in a larger cohort of patients. The validation cohort was integrated by a total of 107 urine samples obtained after DRE (Table 3). For statistical analysis, PCa cases were divided into low grade PCa (Gleason score ≤ 7(3+4); n=22) and high grade PCa (Gleason score ≥ 7(4+3); n=31). The control group included patients without PCa (n=54), such as patients with benign prostatic hyperplasia (BPH), inflammation or high-grade prostatic intraepithelial neoplasia (HGPIN).
Table 3: Clinico-pathological conditions of patients included in the study
SRM experiments (urine) |
TMAs Validation (FFPE) |
|||
|---|---|---|---|---|
Benign |
PCa |
Benign |
PCa |
|
No. of samples |
54 |
53 |
98 |
136 |
Age (yr)* |
65.6 (53 - 78) |
67.7 (51 - 87) |
64 (53-72) |
64 (53-73) |
Serum PSA (ng/mL)* |
8.1 (2.5 - 41.1) |
17.3 (1.0 - 245.4) |
9,8 (2,5-48) |
11 (1,1-66) |
No. of vesicles/mL* |
5,1*1012 (5,3*1011- 2,2*1013) |
4,1*1012 (4,6*1011- 1,4*1013) |
- |
- |
Total protein (μg/mL)* |
1.1 (0.2 - 8.0) |
0.8 (0.2 - 4.9) |
- |
- |
Low Grade (GS ≤ 7(3+4)) |
- |
22 |
51 |
50 |
High Grade (GS ≥ 7(4+3) |
- |
31 |
48 |
86 |
No BCR |
- |
- |
49 |
72 |
BCR |
- |
- |
49 |
64 |
* Values are represented as mean (range); GS (Gleason's Score)
Patients selection and inclusion criteria
This study obtained approval from the Vall Hebron University Hospital (Barcelona, Spain) institutional review board (PR(IR)56/2014). Written informed consent was obtained from all the study participants and samples were coded to ensure sample tracking and confidentiality on patient/donor identity. All patients were men with suspicion of PCa according to abnormal DRE and/or serum PSA levels higher than 4 ng/mL, referred for a first PB at the Urology Service of the Vall d’Hebron University Hospital (Barcelona, Spain) from 2008 to 2012. Definitive diagnosis was achieved after PB. Patients with a diagnosis of PCa and age matched controls were selected. Patients with an unrelated chronic or acute severe illness and/or previous PCa therapies were excluded from the study.
Urine samples collection and extracellular vesicles isolation
Urine was collected after DRE, a procedure included in the standard process for detection of PCa. Urine (30-50 mL) was collected in urine collection cups, kept on ice, transported to the lab and processed within 2 h of its collection. The samples were centrifuged at 2,500 g for 10 min at 4 °C and the supernatant, containing the EVs, was supplemented with a cocktail of protease inhibitors (Sigma-Aldrich, St Louis, MO, USA) and stored at –80 °C until its use.
For EVs isolation, cell-free urine samples were first centrifuged at 16,500 g, 20 min, to remove larger vesicles and any possible remaining cell debris. The pellet from this centrifugation was treated with dithiothreitol (DTT) (37 °C, 10 min) in order to break THP (Tamm-Horsfall protein) fibers and release EVs, and centrifuged again at 16,500 g, 20 min. Supernatants from the two centrifugations were mixed together and filtered through a 0.2 μM pore size filter. Samples were then ultracentrifuged at 100,000 g for 120 min at 4 °C. The resulting pellet was washed with PBS (phosphate buffered saline) and centrifuged again at 100,000 g, 60 min at 4 °C. The final pellet was resuspended in 50 μL PBS, of which 5 μL were set aside and stored at -80 °C for nanoparticle tracking analysis (NTA) and the rest was mixed with 50 μL lysis buffer (Tris 20 mM pH 8.8, NaCl 150 mM, EDTA 5 mM, Triton X-100 1%, and protease inhibitors) and stored at -20 °C until its use.
Transmission electron microscopy
Transmission electron microscopy (TEM) imaging of EVs was performed using negative-staining technique. Briefly, pellets recovered from the ultracentrifugation, containing the EVs, were fixed with 4% paraformaldehyde and then deposited on Formvar/Carbon-coated grids, which were negatively stained with uranyl acetate. EVs preparations were examined using a transmission electron microscope JEOL JEM 1010 (Japan Electron Optics Laboratory Co., Tokyo, Japan).
Nanoparticle tracking analysis
Vesicles present in purified samples were analyzed by NTA using the NanoSight LM14 system (NanoSight Ltd., Amesbury, UK), configured with a high sensitivity digital camera system (Hamamatsu C11440 ORCA-Flash2.8, Hamamatsu City, Japan). Three videos of 60s duration were recorded for each sample and average measurements and standard deviations were calculated. Videos were analyzed using the NTA-software (version 2.3), with the minimal expected particle size, minimum track length, and blur set to automatic. Camera shutter speed and camera gain were set to maximum. Camera sensitivity and detection threshold were set close to maximum (15 or 16) and minimum (2 to 5), respectively, to reveal small particles. Samples were diluted in ultrapure water.
Sample preparation for mass spectrometry
Urinary EVs were disrupted by sonication (LABSONIC M, Sartorius Stedim Biotech, Goettingen, Germany) at 100 % amplitude for 4 pulses of 5 s each separated by 5 s pauses on ice. The extracted proteins were stored at –20 °C. An aliquot of each preparation was used for protein quantity estimation using the DC Protein Assay (Bio-Rad, Bio-Rad Laboratories, Hercules, CA, USA), following the manufacturer’s instructions. Samples, usually diluted 1:10, were compared in triplicates against serially diluted Bovine Serum Albumin (BSA) as standard.
Filter-aided sample preparation (FASP) was performed using a 10 kDa molecular weight cut-off filter (Merck Millipore) as previously described [46]. Briefly, 20 μg of sample in RIPA buffer were loaded in the filter unit and washed twice with 8 M urea by centrifugation at 14,000 g for 15 min. Proteins were reduced with 10 mM DTT for 1 h at RT, and alkylated with 30 mM iodoacetamide (IAA) 30 min in the dark. The reaction was stopped with 37.5 mM n-acetylcysteine (NAC) during 15 min, and the solutions were removed by centrifugation at 14,000 g for 15 min. The samples were then washed once with 1 M urea. The resulting pellet was diluted with 40 μL of 1 M urea, containing 20 μg of trypsin, and it was incubated overnight 37 °C for protein digestion. Finally, tryptic peptides were collected in a clean tube by centrifugation at 14,000 g for 10 min, and this filtrate was acidified with 0.3-0.5 μL of concentrated formic acid. Samples were stored at –20 °C until further analysis.
Selected reaction monitoring
A total of 64 proteins were selected for the targeted proteomic analysis based on previous in-house discovery proteomics experiments and additional information retrieved from the literature. Literature search was focused on previous studies in which differentially expressed proteins in PCa had been identified using tissue, urine and different PCa cell lines as a source of biomarkers [11, 19, 21, 23].
One quantotypic peptide per protein was selected based on a previously in-house shotgun dataset. Briefly, to ensure that the selected peptides correctly represented the true fold-changes of the targeted proteins, we extracted all ion intensity chromatograms from MS1 scans for the identified peptide precursors of the selected proteins across 24 samples. All the ions were visually inspected and area integration of all the precursor ions was manually reviewed. The integrated areas were used to statistically assess protein fold-changes. Peptides were selected for the SRM experiment according the following criteria: i) the difference between the protein and the peptide fold-change (the lower the better); and ii) the intensity of the peptide (the more intense the better). In the case of proteins that exhibited not significant abundance changes, peptides selection was based on peptide intensity.
All samples were individually digested (see above) and one isotopically labeled reference peptide at C-terminal lysine (13C6,15N2-Lys) or arginine (13C6,15N4-Arg) per protein was spiked into the digested samples prior mass spectrometry (MS) acquisition (Supplementary Table ST1).
Selected reaction monitoring (SRM) measurements were performed with unfractionated samples on a hybrid triple quadrupole / ion trap mass spectrometer (5500 Q-Trap; AB Sciex Instruments, Foster, CA, USA) equipped a reversed-phase chromatography 25-cm column with an inner diameter of 75 μm, packed with 1.9-μm C18 particles (Nikkyo Technos, Tokyo, Japan) and a 2-cm pre-column (Acclaim PepMap 100, C18, 15 μm, 100-A; Dionex, Sunnyvale, CA, USA). Loading buffer: H2O + 0.1% formic acid; Elution buffer: ACN + 0.1% formic acid. Flow rate: 250 nL/min. Gradient: From 7 to 40% eluting buffer in 60 min. Blank runs were performed between the SRM measurements of biological samples to avoid sample carryover. Measurements were done in scheduled SRM mode, using a SRM detection window of 300 seconds and a total cycle time of 2.5 seconds. For each peptide of interest five transitions were monitored for both the endogenous and the isotopically labeled peptides.
Transition groups corresponding to the targeted peptides were evaluated with Skyline v2.5 based on the correlation of transition intensities between the endogenous and reference SRM traces as well as with the reference spectral library, on the relative retention times across runs, and on the co-elution of endogenous peptide and spiked-in references [47]. Transition areas were used to calculate protein ratios between the two groups using the linear mixed-effects model as implemented in the R package MSstats v2.0 [48].
The raw proteomics data have been deposited to the ProteomeXchange Consortium [49] via the PASSEL [50] partner repository with the dataset identifier PASS00843.
Western blotting
Proteins were separated by 10% SDS-PAGE under reducing or non-reducing conditions and transferred to PVDF membranes. For blocking, membranes were soaked in 5% non-fat dried milk in TBS-Tween20 (Tris-buffered saline, 0.01% Tween20). Proteins were immunodetected using antibodies against TSG101 (1:500; Abcam, Cambridge, UK), CD81 (1:100; Santa Cruz Biotechnology, Santa Cruz, CA, USA), CD63 (non-reduced conditions, 1:1000, Merck Millipore, Germany), PSA/KLK3 (1:100, Dako, Denmark), TGM4, ADSV, SPHM (1:1000, 1:100, 1:100, Sigma-Aldrich, MO, USA), in overnight incubations at 4°C. Afterwards, membranes were washed and incubated with a secondary HRP-coupled antibody (horseradish peroxidase-conjugated antibody) for 1h at room temperature. Finally, HRP signal was revealed using the Immobilon Western HRP Substrate (Merck Millipore, Darmstadt, Germany).
Tissue microarrays
For the tissue microarrays (TMAs) a total of 165 samples of radical prostatectomy (RP) were selected from patients with > 7 years of clinical follow up. Low and high-grade patients and patients with and without biochemical recurrence (BCR) were included. BCR is defined as the first post-operative PSA value > 0.4 ng/mL, confirmed by at least 1 subsequent increasing value (persistent PSA increase) after undetectable PSA post-operatively. From each PCa patient, both cancerous and benign peripheral tissues were inspected. Formalin-fixed paraffin-embedded tissue (FFPE) samples of PCa available from the archives of the Pathology Department of the Vall Hebron University Hospital (Barcelona, Spain) were used. Clinico-pathologic features of these patients are detailed in Table 1. For TMA construction, a hematoxylin and eosin-stained section was made from each block to define representative tumor regions. Tissue cylinders with a diameter of 1 mm were then punched from selected tumor and non-malignant areas of each donor tissue block in triplicates and brought into a recipient paraffin block using a custom-made precision instrument (Advanced Tissue Arrayer Chemicon International USA). Sections (3 μm) of the resulting TMA block were obtained with a Leica RM 2255 microtome (Finesse ME+ A77500016 microtome, Thermo Scientific) and transferred to glass slides and stained with different antibodies as described below.
Immunohistochemistry
Slides were incubated at 55°C overnight, then treated in xylene to de-paraffinize them, and subsequently re-hydrated through graded alcohol rinses. TGM4, ADSV, GLPK5, CD63 and SPHM immunohistochemical (IHC) staining were performed. Heat-induced antigen retrieval was performed by immersing the slides in 10 mM citrate buffer (C8H8O7.H2Odd 0.01M + C6H5O7.H2Odd; pH 6.0). Nonspecific staining was avoided using 10 % normal-matched serum and 0.3 % H2O2 in PBS buffer for 30 min. Antigen was detected by 1 h incubation at room temperature or overnight at 4°C with the relevant primary antibody (ADSV 1:1000, TGM4 1:1000, GLPK5 1:50, SPHM 1:600, Sigma-Aldrich, MO, USA; CD63 1:500, Merck Millipore, Germany), followed by an appropriate secondary antibody conjugated to a peroxidase complex (Envision+ poly-HRP system; DAKO Cytomation, Glostrup, Denmark). Color development was done using DAB+ Chromogen (DAKO Cytomation) followed by counterstaining with hematoxylin. Two-experienced pathologist evaluated the staining of the TMA and calculated a histoscore based on the percentage of stained cells and the intensity of the staining (ranging from 1 -weakly positive- to 3 -strongly positive). Histoscores were calculated from the sum of (1x % cells staining weakly positive) + (2x % cells staining moderately positive) + (3x % cells staining strongly positive) to a maximum of 300.
Statistical analysis of mass spectrometric data
SRM peak areas were normalized based on the areas corresponding to the isotopically labeled internal peptide references, which were used to first equalize the median abundance (log2-areas) for all reference peptides across all runs, and then all endogenous peptide areas in a run were corrected by a same bias. Comparisons of relative protein abundance between groups were performed using the MSstats R package [48].
For predictive analysis, the whole patient cohort was used. Initially, the quantity of each protein per sample was estimated based on a relative log2-transformed using the MSstats R package, and these protein quantities were then used as input variables to a logistic regression model between the tested patient groups. Each protein was fitted in the model between two groups and its classification ability was evaluated by the area under the curve (AUC) obtained in the receiver operating characteristic (ROC) curve. AUC was used as it summarizes well the classification performance of each protein in terms of specificity and sensitivity, with candidates with better specificity and sensibility having an AUC value close to 1. Additional proteins were iteratively added and the variation of AUC was checked and only those that increased the AUC value were kept for further iterations [51]. The pROC package in R was used to draw ROCs, calculate the AUC values and estimate the confidence intervals of the ROC curves. Mann-Whitney test and the pROC package mentioned above were used for the IHC data analysis.
CONFLICTs OF INTEREST STATEMENT
Michiel Pegtel has an ownership interest in exBiome, the other authors declare that they have no conflict of interest.
GRANT SUPPORT
The study was supported by grants PI11/02486 and CD12/00475 of Instituto de Salud Carlos III (ISCIII), AECC-JB-2013-02 of Asociación Española Contra el Cáncer, 7th Framework Programe, IRSES (PROTBIOFLUID –269285) – Belgium, pre-doctoral fellowship of Vall d’Hebron Research Institute (VHIR) and by Instituto de Salud Carlos III, grant RD12/0036/0035 cofinanced by the European Regional Development Fund(ERDF). The CRG/UPF Proteomics Unit is part of the “Plataforma de Recursos Biomoleculares y Bioinformáticos (ProteoRed)” supported by grant PT13/0001 of ISCIII and Spanish Ministry of Economy and Competitiveness. We acknowledge support of the Spanish Ministry of Economy and Competitiveness, “Centro de Excelencia Severo Ochoa 2013-2017”, SEV-2012-0208, and from “Secretaria d’Universitats i Recerca del Departament d’Economia i Coneixement de la Generalitat de Catalunya” (2014SGR678).
REFERENCES
1. Siegel RL, Miller KD, Jemal A. Cancer statistics, 2016. CA Cancer J Clin. 2016; 66: 7–30. doi: 10.3322/caac.21332.
2. Loeb S. Guideline of guidelines: prostate cancer screening. BJU Int. 2014; 114: 323–5. doi: 10.1111/bju.12854.
3. Mlcochova H, Hezova R, Stanik M, Slaby O. Urine microRNAs as potential noninvasive biomarkers in urologic cancers. Urol Oncol. 2014; 32: 41.e1–9. doi: 10.1016/j.urolonc.2013.04.011.
4. Rigau M, Olivan M, Garcia M, Sequeiros T, Montes M, Colás E, Llauradó M, Planas J, Torres I de, Morote J, Cooper C, Reventós J, Clark J, et al. The present and future of prostate cancer urine biomarkers. Int J Mol Sci. 2013; 14: 12620–49. doi: 10.3390/ijms140612620.
5. Royo F, Zuñiga-Garcia P, Torrano V, Loizaga A, Sanchez-Mosquera P, Ugalde-Olano A, González E, Cortazar AR, Palomo L, Fernández-Ruiz S, Lacasa-Viscasillas I, Berdasco M, Sutherland JD, et al. Transcriptomic profiling of urine extracellular vesicles reveals alterations of CDH3 in prostate cancer. Oncotarget. 2016; 7: 6835–46. doi: 10.18632/oncotarget.6899.
6. Sequeiros T, Bastarós JM, Sánchez M, Rigau M, Montes M, Placer J, Planas J, de Torres I, Reventós J, Pegtel DM, Doll A, Morote J, Olivan M. Urinary biomarkers for the detection of prostate cancer in patients with high-grade prostatic intraepithelial neoplasia. The Prostate. 2015; 75: 1102–13. doi: 10.1002/pros.22995.
7. Wood SL, Knowles MA, Thompson D, Selby PJ, Banks RE. Proteomic studies of urinary biomarkers for prostate, bladder and kidney cancers. Nat Rev Urol. 2013; 10: 206–18. doi: 10.1038/nrurol.2013.24.
8. Yáñez-Mó M, Siljander PR-M, Andreu Z, Zavec AB, Borràs FE, Buzas EI, Buzas K, Casal E, Cappello F, Carvalho J, Colás E, Cordeiro-da Silva A, Fais S, et al. Biological properties of extracellular vesicles and their physiological functions. J Extracell Vesicles. 2015; 4: 27066.
9. Giusti I, Dolo V. Extracellular vesicles in prostate cancer: new future clinical strategies? BioMed Res Int. 2014; 2014: 561571. doi: 10.1155/2014/561571.
10. Hessels D, Schalken JA. Urinary biomarkers for prostate cancer: a review. Asian J Androl. 2013; 15: 333–9. doi: 10.1038/aja.2013.6.
11. Øverbye A, Skotland T, Koehler CJ, Thiede B, Seierstad T, Berge V, Sandvig K, Llorente A. Identification of prostate cancer biomarkers in urinary exosomes. Oncotarget. 2015; 6: 30357–76. doi: 10.18632/oncotarget.4851.
12. Moon P-G, You S, Lee J-E, Hwang D, Baek M-C. Urinary exosomes and proteomics. Mass Spectrom Rev. 2011; 30: 1185–202. doi: 10.1002/mas.20319.
13. Zhou H, Yuen PST, Pisitkun T, Gonzales PA, Yasuda H, Dear JW, Gross P, Knepper MA, Star RA. Collection, storage, preservation, and normalization of human urinary exosomes for biomarker discovery. Kidney Int. 2006; 69: 1471–6. doi: 10.1038/sj.ki.5000273.
14. Keller S, Sanderson MP, Stoeck A, Altevogt P. Exosomes: from biogenesis and secretion to biological function. Immunol Lett. 2006; 107: 102–8. doi: 10.1016/j.imlet.2006.09.005.
15. Wachalska M, Koppers-Lalic D, van Eijndhoven M, Pegtel M, Geldof AA, Lipinska AD, van Moorselaar RJ, Bijnsdorp IV. Protein Complexes in Urine Interfere with Extracellular Vesicle Biomarker Studies. J Circ Biomark. 2016; : 1. doi: 10.5772/62579.
16. Royo F, Zuñiga-Garcia P, Sanchez-Mosquera P, Egia A, Perez A, Loizaga A, Arceo R, Lacasa I, Rabade A, Arrieta E, Bilbao R, Unda M, Carracedo A, et al. Different EV enrichment methods suitable for clinical settings yield different subpopulations of urinary extracellular vesicles from human samples. J Extracell Vesicles. 2016; 5: 29497.
17. Torrano V, Royo F, Peinado H, Loizaga-Iriarte A, Unda M, Falcón-Perez JM, Carracedo A. Vesicle-MaNiA: extracellular vesicles in liquid biopsy and cancer. Curr Opin Pharmacol. 2016; 29: 47–53. doi: 10.1016/j.coph.2016.06.003.
18. Mitchell PJ, Welton J, Staffurth J, Court J, Mason MD, Tabi Z, Clayton A. Can urinary exosomes act as treatment response markers in prostate cancer? J Transl Med. 2009; 7: 4. doi: 10.1186/1479-5876-7-4.
19. Principe S, Jones EE, Kim Y, Sinha A, Nyalwidhe JO, Brooks J, Semmes OJ, Troyer DA, Lance RS, Kislinger T, Drake RR. In-depth proteomic analyses of exosomes isolated from expressed prostatic secretions in urine. Proteomics. 2013; 13: 1667–71. doi: 10.1002/pmic.201200561.
20. Nyalwidhe JO, Betesh LR, Powers TW, Jones EE, White KY, Burch TC, Brooks J, Watson MT, Lance RS, Troyer DA, Semmes OJ, Mehta A, Drake RR. Increased bisecting N-acetylglucosamine and decreased branched chain glycans of N-linked glycoproteins in expressed prostatic secretions associated with prostate cancer progression. Proteomics Clin Appl. 2013; 7: 677–89. doi: 10.1002/prca.201200134.
21. Junker K, Heinzelmann J, Beckham C, Ochiya T, Jenster G. Extracellular Vesicles and Their Role in Urologic Malignancies. Eur Urol. 2016. doi: 10.1016/j.eururo.2016.02.046.
22. Nawaz M, Camussi G, Valadi H, Nazarenko I, Ekström K, Wang X, Principe S, Shah N, Ashraf NM, Fatima F, Neder L, Kislinger T. The emerging role of extracellular vesicles as biomarkers for urogenital cancers. Nat Rev Urol. 2014; 11: 688–701. doi: 10.1038/nrurol.2014.301.
23. Duijvesz D, Burnum-Johnson KE, Gritsenko MA, Hoogland AM, Vredenbregt-van den Berg MS, Willemsen R, Luider T, Paša-Tolić L, Jenster G. Proteomic profiling of exosomes leads to the identification of novel biomarkers for prostate cancer. PloS One. 2013; 8: e82589. doi: 10.1371/journal.pone.0082589.
24. Raposo G, Stoorvogel W. Extracellular vesicles: exosomes, microvesicles, and friends. J Cell Biol. 2013; 200: 373–83. doi: 10.1083/jcb.201211138.
25. Jakobsen KR, Paulsen BS, Bæk R, Varming K, Sorensen BS, JØrgensen MM. Exosomal proteins as potential diagnostic markers in advanced non-small cell lung carcinoma. J Extracell Vesicles. 2015; 4: 26659.
26. Etzioni R, Kooperberg C, Pepe M, Smith R, Gann PH. Combining biomarkers to detect disease with application to prostate cancer. Biostat Oxf Engl. 2003; 4: 523–38. doi: 10.1093/biostatistics/4.4.523.
27. Royo F, Zuñiga-Garcia P, Torrano V, Loizaga A, Sanchez-Mosquera P, Ugalde-Olano A, González E, Cortazar AR, Palomo L, Fernández-Ruiz S, Lacasa-Viscasillas I, Berdasco M, Sutherland JD, et al. Transcriptomic profiling of urine extracellular vesicles reveals alterations of CDH3 in prostate cancer. Oncotarget. 2016; 7: 6835-46. doi: 10.18632/oncotarget.6899.
28. Hessvik NP, Sandvig K, Llorente A. Exosomal miRNAs as Biomarkers for Prostate Cancer. Front Genet. 2013; 4: 36. doi: 10.3389/fgene.2013.00036.
29. Wang R, Chinnaiyan AM, Dunn RL, Wojno KJ, Wei JT. Rational approach to implementation of prostate cancer antigen 3 into clinical care. Cancer. 2009; 115: 3879–86. doi: 10.1002/cncr.24447.
30. Lazzeri M, Haese A, Abrate A, de la Taille A, Redorta JP, McNicholas T, Lughezzani G, Lista G, Larcher A, Bini V, Cestari A, Buffi N, Graefen M, et al. Clinical performance of serum prostate-specific antigen isoform [-2]proPSA (p2PSA) and its derivatives, %p2PSA and the prostate health index (PHI), in men with a family history of prostate cancer: results from a multicentre European study, the PROMEtheuS project. BJU Int. 2013; 112: 313–21. doi: 10.1111/bju.12217.
31. Megger DA, Bracht T, Meyer HE, Sitek B. Label-free quantification in clinical proteomics. Biochim Biophys Acta. 2013; 1834: 1581–90. doi: 10.1016/j.bbapap.2013.04.001.
32. March-Villalba JA, Martínez-Jabaloyas JM, Herrero MJ, Santamaria J, Aliño SF, Dasí F. Cell-free circulating plasma hTERT mRNA is a useful marker for prostate cancer diagnosis and is associated with poor prognosis tumor characteristics. PloS One. 2012; 7: e43470. doi: 10.1371/journal.pone.0043470.
33. Koppers-Lalic D, Hackenberg M, de Menezes R, Misovic B, Wachalska M, Geldof A, Zini N, de Reijke T, Wurdinger T, Vis A, van Moorselaar J, Pegtel M, Bijnsdorp I. Non-invasive prostate cancer detection by measuring miRNA variants (isomiRs) in urine extracellular vesicles. Oncotarget. 2016; 7: 22566–78. doi: 10.18632/oncotarget.8124.
34. Hoshino A, Costa-Silva B, Shen T-L, Rodrigues G, Hashimoto A, Tesic Mark M, Molina H, Kohsaka S, Di Giannatale A, Ceder S, Singh S, Williams C, Soplop N, et al. Tumour exosome integrins determine organotropic metastasis. Nature. 2015; 527: 329–35. doi: 10.1038/nature15756.
35. Dumitrescu Pene T, Rosé SD, Lejen T, Marcu MG, Trifaró J-M. Expression of various scinderin domains in chromaffin cells indicates that this protein acts as a molecular switch in the control of actin filament dynamics and exocytosis. J Neurochem. 2005; 92: 780–9. doi: 10.1111/j.1471-4159.2004.02907.x.
36. Trifaró JM. Scinderin and cortical F-actin are components of the secretory machinery. Can J Physiol Pharmacol. 1999; 77: 660–71.
37. Wang D, Sun S-Q, Yu Y-H, Wu W-Z, Yang S-L, Tan J-M. Suppression of SCIN inhibits human prostate cancer cell proliferation and induces G0/G1 phase arrest. Int J Oncol. 2014; 44: 161–6. doi: 10.3892/ijo.2013.2170.
38. Dubbink HJ, de Waal L, van Haperen R, Verkaik NS, Trapman J, Romijn JC. The human prostate-specific transglutaminase gene (TGM4): genomic organization, tissue-specific expression, and promoter characterization. Genomics. 1998; 51: 434–44. doi: 10.1006/geno.1998.5393.
39. Shaikhibrahim Z, Lindstrot A, Buettner R, Wernert N. Analysis of laser-microdissected prostate cancer tissues reveals potential tumor markers. Int J Mol Med. 2011; 28: 605–11. doi: 10.3892/ijmm.2011.746.
40. Kim Y, Ignatchenko V, Yao CQ, Kalatskaya I, Nyalwidhe JO, Lance RS, Gramolini AO, Troyer DA, Stein LD, Boutros PC, Medin JA, Semmes OJ, Drake RR, et al. Identification of differentially expressed proteins in direct expressed prostatic secretions of men with organ-confined versus extracapsular prostate cancer. Mol Cell Proteomics MCP. 2012; 11: 1870–84. doi: 10.1074/mcp.M112.017889.
41. Darson MF, Pacelli A, Roche P, Rittenhouse HG, Wolfert RL, Young CY, Klee GG, Tindall DJ, Bostwick DG. Human glandular kallikrein 2 (hK2) expression in prostatic intraepithelial neoplasia and adenocarcinoma: a novel prostate cancer marker. Urology. 1997; 49: 857–62.
42. Sequeiros T, García M, Montes M, Oliván M, Rigau M, Colás E, de Torres I, Morote J, Reventós J, Doll A. Molecular markers for prostate cancer in formalin-fixed paraffin-embedded tissues. BioMed Res Int. 2013; 2013: 283635. doi: 10.1155/2013/283635.
43. Stenman UH, Leinonen J, Zhang WM, Finne P. Prostate-specific antigen. Semin Cancer Biol. 1999; 9: 83–93. doi: 10.1006/scbi.1998.0086.
44. Liu AY, Roudier MP, True LD. Heterogeneity in primary and metastatic prostate cancer as defined by cell surface CD profile. Am J Pathol. 2004; 165: 1543–56. doi: 10.1016/S0002-9440(10)63412-8.
45. Davalieva K, Polenakovic M. Proteomics in diagnosis of prostate cancer. Pril Makedon Akad Na Nauk Umet Oddelenie Za Biološki Med Nauki Contrib Maced Acad Sci Arts Sect Biol Med Sci. 2015; 36: 5–36.
46. Manza LL, Stamer SL, Ham A-JL, Codreanu SG, Liebler DC. Sample preparation and digestion for proteomic analyses using spin filters. Proteomics. 2005; 5: 1742–5. doi: 10.1002/pmic.200401063.
47. MacLean B, Tomazela DM, Shulman N, Chambers M, Finney GL, Frewen B, Kern R, Tabb DL, Liebler DC, MacCoss MJ. Skyline: an open source document editor for creating and analyzing targeted proteomics experiments. Bioinforma Oxf Engl. 2010; 26: 966–8. doi: 10.1093/bioinformatics/btq054.
48. Choi M, Chang C-Y, Clough T, Broudy D, Killeen T, MacLean B, Vitek O. MSstats: an R package for statistical analysis of quantitative mass spectrometry-based proteomic experiments. Bioinforma Oxf Engl. 2014; 30: 2524–6. doi: 10.1093/bioinformatics/btu305.
49. Vizcaíno JA, Deutsch EW, Wang R, Csordas A, Reisinger F, Ríos D, Dianes JA, Sun Z, Farrah T, Bandeira N, Binz P-A, Xenarios I, Eisenacher M, et al. ProteomeXchange provides globally coordinated proteomics data submission and dissemination. Nat Biotechnol. 2014; 32: 223–6. doi: 10.1038/nbt.2839.
50. Farrah T, Deutsch EW, Kreisberg R, Sun Z, Campbell DS, Mendoza L, Kusebauch U, Brusniak M-Y, Hüttenhain R, Schiess R, Selevsek N, Aebersold R, Moritz RL. PASSEL: the PeptideAtlas SRMexperiment library. Proteomics. 2012; 12: 1170–5. doi: 10.1002/pmic.201100515.
51. Borràs E, Cantó E, Choi M, Maria Villar L,álvarez-Cermeño JC, Chiva C, Montalban X, Vitek O, Comabella M, Sabidó E. Protein-Based Classifier to Predict Conversion from Clinically Isolated Syndrome to Multiple Sclerosis. Mol Cell Proteomics MCP. 2016; 15: 318–28. doi: 10.1074/mcp.M115.053256.