
INTRODUCTION
Colorectal carcinoma (CRC) is one of the most common malignant tumors worldwide [1-3], and it is also the third most common malignant disease in Asia [4]. Previous studies have shown that various biomarkers, such as p53, COX2, EGFR and nm23, were involved in multiple stages of tumor development [4-15]. These biomarkers, most of which are oncogenes and tumor suppressors, play a crucial role in carcinoma formation [3, 15, 16]. Therefore, they were used for monitoring the progression of tumors and guiding targeting therapies. So far, the prognosis of patients with CRC depends mainly on TNM staging system. However, the patients with similar disease features can manifest various survival results, Therefore, it is important to find molecular prognostic factors that can be useful to identify patients who are at high risk of progression and to individualize treatment [17]. Moreover, one biomarker often fails to predict the prognosis of cancer patients [18]. There is still a lack of better biomarker combinations to predict the prognosis in different stages of carcinoma. Thus, we enrolled 459 patients with colorectal cancer in this study and investigated hierarchically the predictive value of clinicopathological biomarkers for the prognosis of post-operative patients with colorectal carcinoma.
RESULTS
The expression of P53, COX2, EGFR and nm23 in colorectal cancer tissues
Immunohistochemistry results showed that P53, COX2, EGFR and nm23 were proportionally expressed in colorectal cancer tissues, and the positive expression of p53, COX2, EGFR and nm23 were shown in Figure 1. In the patients with colorectal carcinoma, EGFR expression accounted for 53.59%, COX2 expression accounted for 84.1%, p53 expression accounted for 58.52%, nm23 expression accounted for 67.25%. Correlations between the expression of them in colorectal cancer and age, gender, Body Mass Index (BMI), pathological grade, tumor size, lymphatic metastasis, TNM stage were analyzed. The results showed that the correlation between EGFR expression and TNM stage (χ2=9.049, P=0.003) as well as gender (χ2=4.956, P=0.026) were statistically significant, but not others (Table 1).
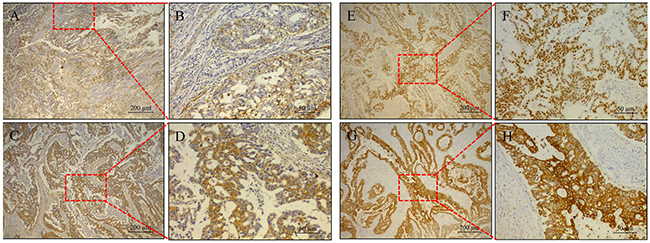
Figure 1: Immunohistochemistry results. The expression of EGFR A. and B., nm23 C. and D., p53 E. and F., and COX2 G. and H. in patients derived sections.
Table 1: Relationships between clinicopathological characteristics and the expression of p53, COX2, EGFR and nm23
Clinical parameter |
EGFR expression level |
COX2 expression level |
p53 expression level |
nm23 expression level |
|||||||||||||
Low |
High |
χ2 |
P |
Low |
High |
χ2 |
P |
Low |
High |
χ2 |
P |
Low |
High |
χ2 |
P |
||
Age(Years) |
<60 |
121 |
139 |
0.004 |
0.948 |
41 |
219 |
0.008 |
0.928 |
101 |
158 |
1.521 |
0.218 |
93 |
167 |
2.487 |
0.115 |
≥60 |
92 |
107 |
32 |
167 |
89 |
110 |
57 |
141 |
|||||||||
Gender |
female |
76 |
113 |
4.956 |
0.026 |
24 |
165 |
2.469 |
0.116 |
76 |
112 |
0.147 |
0.701 |
62 |
127 |
0.000 |
0.984 |
male |
137 |
133 |
49 |
221 |
114 |
156 |
88 |
181 |
|||||||||
BMI |
<25 |
129 |
108 |
0.003 |
0.958 |
22 |
215 |
0.475 |
0.491 |
98 |
139 |
0.103 |
0.748 |
88 |
148 |
0.267 |
0.605 |
≥25 |
46 |
38 |
10 |
74 |
36 |
47 |
34 |
50 |
|||||||||
pathology grading |
I-II |
121 |
125 |
1.649 |
0.199 |
42 |
204 |
0.542 |
0.462 |
113 |
133 |
4.336 |
0.037 |
81 |
165 |
0.007 |
0.931 |
III-IV |
92 |
121 |
31 |
182 |
77 |
135 |
69 |
143 |
|||||||||
Tumor size(cm) |
<8cm |
109 |
124 |
0.014 |
0.905 |
42 |
191 |
1.542 |
0.214 |
96 |
136 |
0.000 |
0.992 |
73 |
160 |
0.351 |
0.554 |
≥8cm |
104 |
121 |
31 |
194 |
93 |
132 |
76 |
148 |
|||||||||
Lymphatic metastasis |
No |
101 |
103 |
1.162 |
0.281 |
35 |
169 |
0.707 |
0.400 |
87 |
116 |
0.262 |
0.608 |
67 |
136 |
0.038 |
0.845 |
Yes |
112 |
140 |
36 |
216 |
102 |
150 |
81 |
171 |
|||||||||
TNM stage |
I-II |
104 |
86 |
9.049 |
0.003 |
35 |
155 |
1.536 |
0.215 |
85 |
105 |
1.415 |
0.234 |
59 |
130 |
0.344 |
0.558 |
III-IV |
109 |
160 |
38 |
231 |
105 |
163 |
91 |
178 |
|||||||||
* lack of partial data
Relationships between p53, COX2, EGFR, nm23 expression and PFS of patients
We performed statistical analyses on the correlations between progression free survival (PFS) and the patients’ gender, age, BMI, pathological grade, tumor size, lymphatic metastasis, TNM stage, expression of EGFR, COX2, p53, nm23, and EGFR&nm23 combined expression. pathological grade, TNM stage, EGFR and nm23 expression had statistical significance to the PFS of post-operative patients with colorectal carcinoma (P<0.05). The median PFS of pathological grade I-II colorectal cancer patients was 39.83 months, the median PFS of pathological grade III-IV colorectal cancer patients was 22.87 months (χ2=7.270, P=0.007).The median PFS was 40.40 months in the TNM I-II colorectal cancer patients, the PFS of the TNM stage III-IV colorectal cancer patients was 23.53 months (χ2=11.382, P=0.001), EGFR expression was as a negative predictor, the median PFS of patients with EGFR high expression was 21.73 months, and the median PFS of patients with low EGFR expression was 57.83 months (χ2=20.880, P<0.001); nm23 expression was positive predictive factor for the prognosis of patients with colorectal carcinoma, the median PFS of patients with high nm23 expression was 37.77 months, and the median PFS was 21.47 months in the patients with low nm23 expression (χ2=7.364, P=0.007). Interestingly, the median PFS was 62.93 months in the patients with low EGFR and high nm23 expression, the median PFS was 16.38 months in the patients with high EGFR and low nm23 expression(χ2=30.396, P<0.001). but other clinicopathological parameters had not statistical significance (Table 2 and Figure 2).
Table 2: Correlations between the progression free survival (PFS) and Clinicopathological parameters
Clinical parameters |
Cases |
Median PFS (Months) |
Log-Rank χ2 |
P value |
|
Gender |
Male |
270 |
34.40 |
0.073 |
0.787 |
Female |
189 |
31.87 |
|||
Age(years) |
≤60 |
260 |
33.53 |
0.098 |
0.754 |
>60 |
199 |
32.00 |
|||
BMI |
≤25 |
237 |
58.63 |
0.034 |
0.854 |
>25 |
84 |
49.03 |
|||
Pathology grade |
I-II |
246 |
39.83 |
7.270 |
0.007 |
III-IV |
213 |
22.87 |
|||
Tumor size |
≤8cm |
233 |
30.67 |
1.594 |
0.207 |
>8cm |
225 |
37.37 |
|||
Lymph node |
Negative |
204 |
34.70 |
0.477 |
0.490 |
Positive |
252 |
28.37 |
|||
TNM stage |
I-II |
190 |
40.40 |
11.382 |
0.001 |
III-IV |
269 |
23.53 |
|||
EGFR expression level |
Low |
213 |
57.83 |
20.880 |
<0.001 |
High |
246 |
21.73 |
|||
COX2 expression level |
Low |
73 |
28.37 |
0.250 |
0.617 |
High |
386 |
34.57 |
|||
p53 expression level |
Low |
190 |
35.23 |
1.604 |
0.205 |
High |
268 |
30.53 |
|||
nm23 expression level |
Low |
150 |
21.47 |
7.364 |
0.007 |
High |
308 |
37.77 |
|||
EGFR & nm23 combined expression level |
EGFR high & nm23 low |
73 |
16.38 |
30.396 |
<0.001 |
EGFR low & nm23 high |
136 |
62.93 |
* lack of partial data
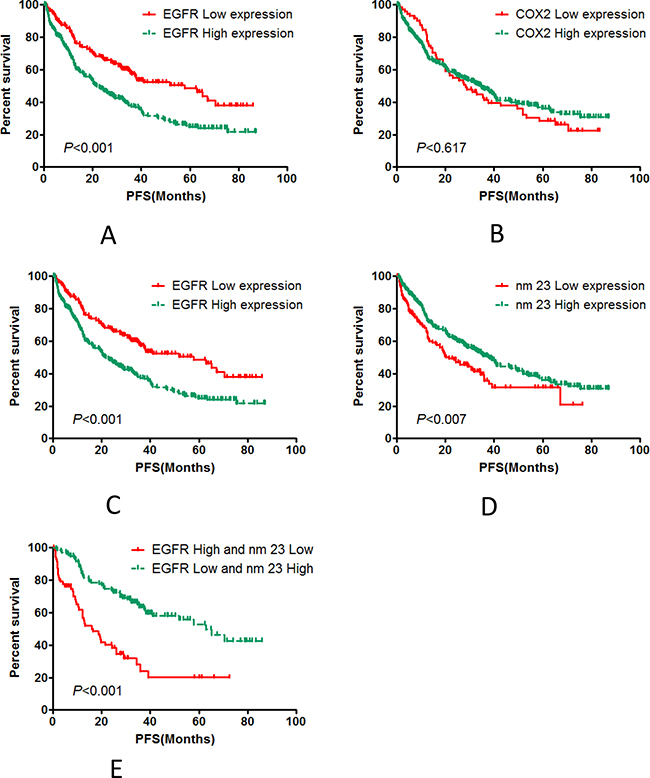
Figure 2: Statistical analyses for the correlation between PFS and the protein expression of p53, COX2, EGFR, nm23, and EGFR&nm23 combined. The expression of p53 A. and COX2 COX2 B. were not related to PFS. The expression of EGFR C. and nm23 D. were highly associated with PFS. And the PFS of patients with low EGFR and high nm23 expression E. was significantly different than those with high EGFR and low nm23 expression.
Cox regression results
Cox regression analysis revealed that comparing with the patients with pathological grade I-II, patients with pathological grade III-IV had higher tumor progression risk (HR=1.521, 95% CI:1.068-2.167, P=0.02); patients with TNM stage I-II colorectal carcinoma vs. patients with TNM stage III-IV colorectal carcinoma, the latter is at higher risk of tumor progression (HR=1.604, 95% CI: 1.108-2.321, P=0.012), and TNM staging is an independent prognostic factor; Comparing with the patients with low expression of EGFR, the patients with high EGFR expression were at higher risk of tumor progression (HR=1.667, 95% CI: 1.177-2.362, P=0.004); Comparing with the patients with high nm23 expression, the patients with nm23 low expression had a higher risk of tumor progression (HR=0.412, 95% CI: 0.288-0.591, P<0.001); the risk of tumor progression was higher in the patients with high EGFR expression and low nm23 expression (HR=0.245, 95% CI: 0.142-0.426, P<0.001), (Table 3 and Table 4).
Table 3: Cox regression model analysis for Clinicopathological parameters
Clinicopathological paramerers |
Multivariate |
||
HR |
95% CI |
P value |
|
Age(Years) |
|||
>=60/<60 |
1.020 |
0.722-1.439 |
0.912 |
Gender |
|||
Male/Female |
0.860 |
0.612-1.209 |
0.386 |
Body Mass Index |
|||
>=25/<25 |
1.041 |
0.706-1.533 |
0.841 |
Pathology grade |
|||
III-IV/I-II |
1.521 |
1.068-2.167 |
0.020 |
Tumor size |
|||
>=8cm/<8cm |
0.802 |
0.571-1.127 |
0.203 |
TNM stage |
|||
III-IV/I-II |
1.604 |
1.108-2.321 |
0.012 |
EGFR expression level |
|||
High/Low |
1.667 |
1.177-2.362 |
0.004 |
COX2 expression level |
|||
High/Low |
1.794 |
0.924-3.481 |
0.084 |
p53 expression level |
|||
High/Low |
1.186 |
0.829-1.697 |
0.350 |
nm23 expression level |
|||
High/Low |
0.412 |
0.288-0.591 |
<0.001 |
Table 4: Cox regression model analysis for Clinical parameters and combined pathology index
Clinicopathological paramerers |
Multivariate |
||
HR |
95% CI |
P value |
|
Age(Years) |
|||
>=60/<60 |
0.858 |
0.509-1.446 |
0.565 |
Gender |
|||
Male/Female |
0.806 |
0.468-1.389 |
0.438 |
Body Mass Index |
|||
>=25/<25 |
1.027 |
0.575-1.833 |
0.929 |
Pathology grade |
|||
III-IV/I-II |
1.903 |
1.114-3.252 |
0.018 |
Tumor size |
|||
>=8cm/<8cm |
1.032 |
0.604-1.762 |
0.909 |
TNM stage |
|||
III-IV/I-II |
1.651 |
0.924-2.952 |
0.091 |
COX2 expression level |
|||
High/Low |
1.219 |
0.469-3.173 |
0.685 |
p53 expression level |
|||
High/Low |
1.319 |
0.789-2.207 |
0.291 |
Combined with EGFR & nm23 |
|||
EGFR low & nm23 high/EGFR high & nm23 low |
0.245 |
0.142-0.426 |
<0.001 |
Hierarchical analyses about EGFR and nm23 expression in the TNM stage I-II and III-IV colorectal cancer patients
Hierarchical analysis showed that EGFR expression mainly affects the PFS of TNM stage I-II colorectal cancer patients, the median PFS was 33.53 months in the TNM stage I-II colorectal cancer patients with high EGFR expression patients, The median PFS was 70.43 months in the TNM stage I-II colorectal cancer patients with low EGFR expression (χ2=9.530, P=0.002); The median PFS was 19.2 months in the TNM stage III-IV colorectal cancer patients with high expression EGFR, the PFS of the TNM stage III-IV colorectal cancer patients with low EGFR expression was 37.87 months (χ2=7.97, P=0.005). nm23 expression mainly affects the PFS of TNM stage III-IV colorecatal cancer patients. The median PFS was 47.27 months in TNM stage I-II colorectal cancer patients with nm23 high expression, the median PFS was 48.85 months in TNM stage I-II colorectal cancer patients with low nm23 expression (χ2=0.101, P=0.750); The median PFS was 28.8 months in TNM stage III-IV colorectal cancer patients with nm23 high expression, the median PFS was 14.7 months in TNM stage III-IV colorectal cancer patients with low nm23 expression (χ2=13.213, P<0.001). These results were shown in Table 5 and Figure 3.
Table 5: Hierarchical analysis of the relationships between PFS and the expression of p53, COX2, EGFR, nm23 in the patients with TNM stage I-II and III-IV.
Hierarchical define |
Clinical parameters |
Cases |
Median/Mean PFS (Months) |
Log-Rank χ2 |
P value |
|
TNM stage I-II |
||||||
EGFR expression level |
Low |
104 |
70.43 |
9.530 |
0.002 |
|
High |
86 |
33.53 |
||||
COX2 expression level |
Low |
35 |
27.53 |
3.311 |
0.069 |
|
High |
155 |
40.87 |
||||
p53 expression level |
Low |
85 |
39.83 |
0.132 |
0.717 |
|
High |
105 |
40.40 |
||||
nm23 expression level |
Low |
59 |
48.85# |
0.101 |
0.750 |
|
High |
130 |
47.27# |
||||
TNM stage III-IV |
||||||
EGFR expression level |
Low |
109 |
37.87 |
7.97 |
0.005 |
|
High |
160 |
19.2 |
||||
COX2 expression level |
Low |
38 |
28.37 |
0.426 |
0.514 |
|
High |
231 |
21.03 |
||||
p53 expression level |
Low |
105 |
28.37 |
2.655 |
0.103 |
|
High |
163 |
21.03 |
||||
nm23 expression level |
Low |
91 |
14.7 |
13.213 |
<0.001 |
|
High |
178 |
28.8 |
||||
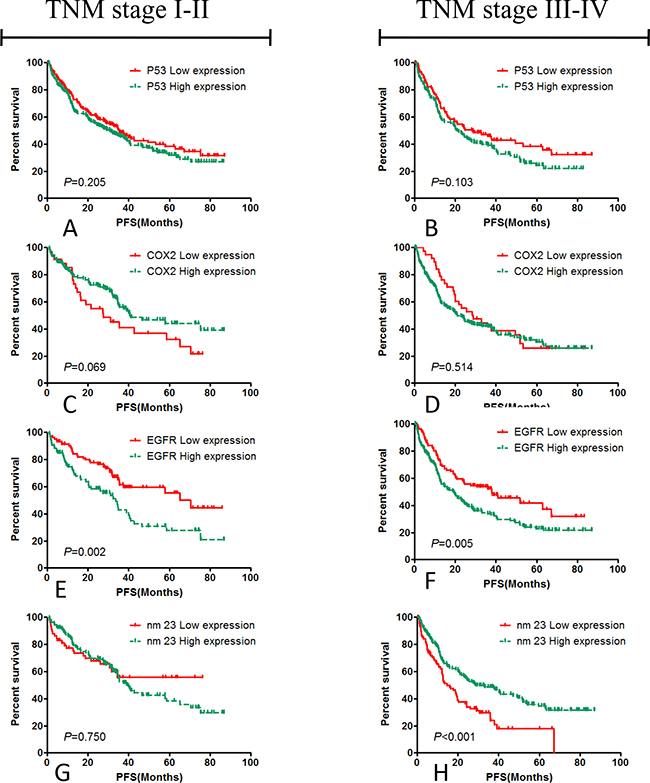
Figure 3: Hierarchical analysis of the correlation between PFS and the expression of p53, COX2, EGFR, nm23 in the patients with TNM stage I-II and III-IV. p53 A. and B. and COX2 C. and D. had not statistical significance to the PFS of post-operative patients with colorectal carcinoma, instead of EGFR E. and F. and nm23 G. and H., and the results suggested that high EGFR expression promoted the cancer progression of the post-operative patients with colorectal cancer in TNM stage I-II, and the nm23 expression mainly influenced the PFS of the patients with TNM stage III-IV.
Hierarchical analyses about EGFR and nm23 expression in the pathological grade I-II and III-IV colorectal cancer patients
Hierarchical analysis showed that EGFR expression mainly affects the PFS of pathological grade I-II colorectal cancer patients, the median PFS of pathological grade I-II colorectal cancer patients with EGFR high expression was 28.37 months, the median PFS of pathological grade I-II colorectal cancer patients with low EGFR expression was 65.07 months (χ2=18.766, P<0.001). The median PFS was 19.6 months in pathological grade III-IV colorectal cancer patients with high EGFR expression, the median PFS in pathological grade III-IV colorectal cancer patients with low EGFR expression was 30.67 months (χ2=3.846, P=0.05). nm23 Expression mainly affects PFS of the pathological grade III-IV colorectal cancer patients, the median PFS was 40.40 months in pathological grade I-II colorectal cancer patients with high nm23 expression, and the median PFS was 35.93 months in pathological grade I-II colorectal cancer patients with low nm23 expression (χ2=1.102, P=0.294). the median PFS was 28.53 months in pathological grade III-IV colorectal cancer patients with high nm23 expression, the median PFS was 15.93 months in pathological grade III-IV colorectal cancer patients with low expression of nm23 (χ2=7.699, P=0.006). These results were shown in Table 6 and Figure 4.
Table 6: Hierarchical analysis of the relationships between PFS and the expression of p53, COX2, EGFR, nm23 in the patients with pathological grade I-II and III-IV.
Hierarchical define |
Clinical parameters |
Cases |
Median/Mean PFS (Months) |
Log-Rank χ2 |
P value |
|
Pathology grade I-II |
||||||
EGFR expression level |
Low |
121 |
65.07 |
18.766 |
<0.001 |
|
High |
125 |
28.37 |
||||
COX2 expression level |
Low |
42 |
31.00 |
0.697 |
0.404 |
|
High |
204 |
40.07 |
||||
p53 expression level |
Low |
113 |
40.87 |
2.511 |
0.113 |
|
High |
133 |
37.37 |
||||
nm23 expression level |
Low |
81 |
35.93 |
1.102 |
0.294 |
|
High |
165 |
40.40 |
||||
Pathology grade III-IV |
||||||
EGFR expression level |
Low |
92 |
30.67 |
3.846 |
0.050 |
|
High |
121 |
19.6 |
||||
COX2 expression level |
Low |
31 |
25.53 |
0.002 |
0.961 |
|
High |
182 |
21.03 |
||||
p53 expression level |
Low |
77 |
20.77 |
0.061 |
0.805 |
|
High |
135 |
25.53 |
||||
nm23 expression level |
Low |
69 |
15.93 |
7.699 |
0.006 |
|
High |
143 |
28.53 |
||||
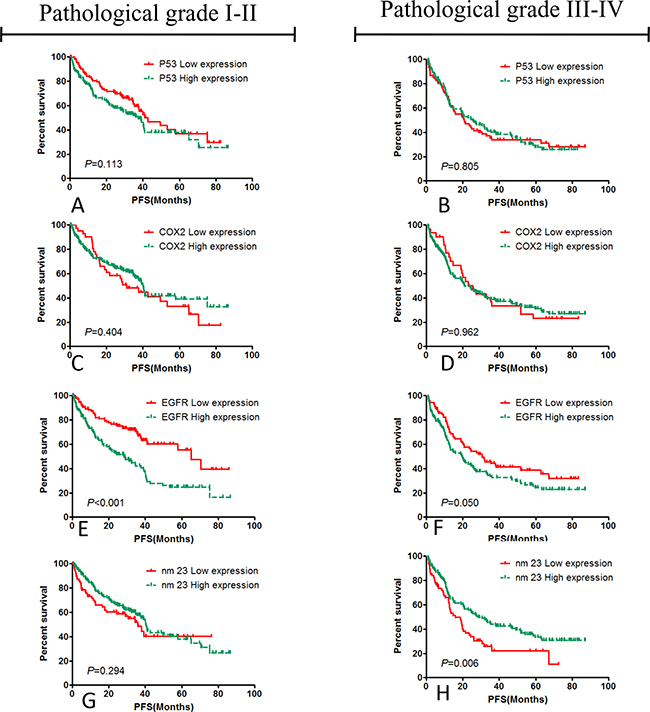
Figure 4: Hierarchical analysis of the relationships between PFS and the expression of EGFR, COX2, p53, nm23 in the patients with pathological grade I-II and III-IV. p53 A. and B. and COX2 C. and D. had not statistical significance to the PFS of post-operative patients with colorectal carcinoma, instead of EGFR E. and F. and nm23 G. and H., and the results suggested that high EGFR expression promoted the cancer progression of the post-operative patients with colorectal cancer in pathological grade I-II, and the nm23 expression mainly influenced the PFS of the patients with pathological grade III-IV.
DISCUSSION
Several studies have provided evidence that some of biomarkers may be useful in identifing the risk for post-operative patients with CRC and in defining patients who may get benefit from adjuvant chemotherapy [17, 19]. Some of them, such as p53 and COX2, play a critical role in carcinogenesis [20, 21]. It has been confirmed that p53 and COX2 mutations could induce carcinogenesis [4, 14], and COX2 could increase the risk of adenoma recurrence [15]. The mechanisms included inhibiting the apoptosis of cancer cells, promoting tumor angiogenesis, inhibiting the immunity of the organism, and increasing the invasion and metastasis of tumors[22-25]. However, in this study, we did not find correlations between p53, COX2 expression and the prognosis of colorectal cancer, which is inconsistent with the results from previous studies [8, 9, 26]. The reason for this could be that p53, COX2 only promotes carcinogenesis, instead of the progression of the disease.
In this study, we investigated the correlations between the progression free survival and patients’ gender, age, body mass index, pathology stage, tumor size, lymphatic metastasis, TNM stage, EGFR, COX2, p53, nm23, Combined with EGFR and nm23, and evaluated mainly the possible prognostic and predictive values of p53, COX2, EGFR and nm23. We found that a statistically significant correlation between PFS and Pathology grade, TNM stage, EGFR and nm23 expression. To date, pathologic grading and TNM staging are still used as predictors for prognosis of tumor patients, and plays a role in patient management, including informing prognosis and therapeutic decision making. However, several studied suggest that there may also be significant variation in prognosis of patients within even so the same tumor stage [27, 28]. Therefore, some biomarkers are getting more and more attention, and so far biomarkers based on cancer biology have already risen to important position in the research of malignant tumors and clinical management [18]. We found that EGFR and nm23 expression were closely related to the prognosis of patients: the risks of recurrence and metastasis were higher for the patients with high EGFR expression and early TNM stage I-II; the PFS was worse for the patients with low nm23 expression and TNM stage III-IV; the risk of progression will further increase in the patients with high EGFR expression and low nm23 expression. Previous studies already suggested that EGFR played an important role in angiogenesis of early tumor, which is associated with the progression of colorectal carcinoma, and is a widely used prognostic factor [6, 29-31]. The over expression of EGFR promotes the metastasis, invasion. The mechanisms mainly included promoting tumor angiogenesis and proliferation of tumor cells that plays a critical role in the early carcinogenesis and progression. EGFR downstream signal transduction pathways are primarily two: one is the Ras/Raf/MEK/ERK- MAPK pathway, and the other is the PI3K/AKT/mTOR pathway [32-38]. Some study has also demonstrated that anti-EGFR antibody could improve the prognosis of colorectal carcinoma [39]. The nm23 gene and the related proteins have NDPK activities, which can change the energy metabolism of the cells, and then influence the development and occurrence of the tumor [10-12, 40]. It has been confirmed that the down-regulation of nm23 gene was an early event in tumor progression, in which the structure and function of the gene was changed and it had direct impact on the cell configuration, mobility, adhesion and spindle formation in mitosis. nm23 gene could inhibit the metastasis of tumor cells, so that nm23 gene expression was negatively correlated with lymph node metastasis, and was positively correlated with PFS [10-12, 40], and our results also indicted that nm23 plays mainly an important role in TNM stage III-IV. So the detection of nm23 gene expression level can be used as an important indicator of whether the metastasis of the tumor.
So far, there is no study with large sample size and multi-center to verify the specific roles of these biomarkers in different TNM stages, as well as evaluated which marker was better for prognosis, which combination of predictive markers was more predictive, in order to guide the clinical workers to select the suitable time and patients for targeted therapies. This study suggested that EGFR was an important predictive factor for the prognosis of the post-operative patients with colorectal carcinoma TNM stage I-II, and nm23 is important for predicting the prognosis of the patients with stage III-IV; it is better that EGFR and nm23 are as predictor of combination. These results would be helpful for evaluation of prognosis and choosing suitable therapies for the post-operative patients with colorectal carcinoma.
PATIENTS AND METHODS
Patients
A total of 1086 patients with CRC who underwent surgery at The Third Affiliated Hospital of Soochow University were enrolled in this study from January 2003 to October 2010. All surgical specimens with the possibility of a diagnosis of CRC were additionally reviewed by two pathologists. The study was approved by the Research Ethics Committee of the Third Affiliated Hospital of Soochow University. However, some patients who did not meet the inclusion criteria, or had other tumors were excluded from the study. Some cases were excluded in the procedure of follow-up. Finally, all 459 patients, including 270 males and 189 females, aged 29-83 years with a median age of 55 years, were enrolled. Exclusion criteria include: 1. we cannot contact with patients or their families to know about the patient’s conditions; 2. patients suffered from other tumors or chronic diseases, and they died from these diseases or other accidents. The inclusion criteria: patients didn’t have other chronic diseases and distant metastasis; they had complete pathological data and medical history; they didn’t receive radiotherapy, chemotherapy or other treatment methods before the surgery.
Immunohistochemical staining
Immunohistochemical staining was performed using streptavidin-perosidase (SP) method. Slides were created by transverse sectioning (4μm). The paraffin-embedded slides were deparaffinated with xylene and rehydrated through a series of ethanol solutions with decreasing concentrations. Endogenous peroxidase activity was blocked by 0.3% H2O2 in methanol at room temperature for half an hour. Thereafter antigen retrieval was achieved by heating the slides in a phosphate-buffered saline (pH 6.0) for 20 minutes and cooling them in the same buffer for 10 minutes. Then the slides were incubated with a diluted primary antibody (mouse anti-COX2, clone COX229, 1:100 dilution, Zymed Laboratories Inc, South San Francisco, Calif; mouse antihuman p53, DO7, Dako, Denmark, 1:50 dilution; rabbit anti-EGFR, MaiXin Biotechnologies, China, 1:400 dilution; anti-human nm23, Dako, Denmark,1:50 dilution.) overnight at 4°C. Then an undiluted secondary antibody was applied for 30 minutes. Rinsing between steps was performed with phosphate buffered saline. The slides were developed with diaminobenzidine and counterstained with Bayers’ haematoxylin. After that the slides were dehydrated and mounted with cover slips.
Immunohistochemistry (IHC) scores
The results were scored by evaluating the percentage of tumor cells that had nuclear staining for p53, COX2, EGFR and nm23. Protein expression was classified as negative if <10% of tumor cells were stained [17, 41]. Otherwise they were categorized as positive. Positive expression was assorted further according to the expression levels: mild expression (from ≥ 10% to < 25% positive tumor cells), moderate expression (from ≥ 25% to < 50% positive tumor cells), and high expression (≥ 50% positive tumor cells), with scores ranging from 0 to 6. A score of 0 meant no staining, a score of 1 or 2 indicated weak staining, a score of 3 or 4 meant moderate staining, and a score of 5 or 6 suggested strong staining. However, during statistical analysis, expression was assorted synoptically as either negative or positive.
Statistical analyses
The relationships between the PFS of post-operative patients and the expression of p53, COX2, EGFR and nm23 and other clinical parameters were analyzed by SPSS 19.0 statistical software. Kaplan-Meier survival estimates and Cox regression analysis were used for calculating PFS (dependent variable). And different prognostic factors, including the tested markers, were used to depict their independent effects on the survival. Contingency tables and chi-squared test (Pearson) were used to evaluate the relationships between the expression of p53, COX2, EGFR, nm23 and other factors, such as tumor stage, grade of tumor differentiation, gender, age, etc. All data were described by the hierarchical analysis. Differences were considered as significant when P < 0.05.
ACKNOWLEDGMENTS
The authors thank everyone for technical assistance and English language editing.
CONFLICTS OF INTEREST
All authors have no potential conflicts of interest to disclose.
GRANT SUPPORT
This research was supported by grants from the National Key Technology R&D Program (No.2015BAI12B12) and the National Natural Science Foundation of China (No. 31570877, 31570908, 81171653, 31428005, 31570877, 31570908).
REFERENCES
1. Shomaf M, Yousef AL, Ababna N, Bobali Y. Cyclooxygenase-2 (COX2) gene polymorphisms and the risk of sporadic colorectal cancer and polyps among Jordanian population. Turk J Gastroenterol. 2015; 26: 154-8. doi: 10.5152/tjg.2015.6174.
2. Costabile V, Duraturo F, Delrio P, Rega D, Pace U, Liccardo R, Rossi GB, Genesio R, Nitsch L, Izzo P, De Rosa M. Lithium chloride induces mesenchymaltoepithelial reverting transition in primary colon cancer cell cultures. Int J Oncol. 2015; 46: 1913-23. doi: 10.3892/ijo.2015.2911.
3. Liu X, George GC, Tsimberidou AM, Naing A, Wheler JJ, Kopetz S, Fu S, Piha-Paul SA, Eng C, Falchook GS, Janku F, Garrett C, Karp D, et al. Retreatment with anti-EGFR based therapies in metastatic colorectal cancer: impact of intervening time interval and prior anti-EGFR response. BMC Cancer. 2015; 15: 713. doi: 10.1186/s12885-015-1701-3.
4. Abdullah M, Rani AA, Sudoyo AW, Makmun D, Handjari DR, Hernowo BS. Expression of NF-kB and COX2 in colorectal cancer among native Indonesians: the role of inflammation in colorectal carcinogenesis. Acta Med Indones. 2013; 45: 187-92.
5. Fabbri A, Travaglione S, Ballan G, Loizzo S, Fiorentini C. The cytotoxic necrotizing factor 1 from E. coli: a janus toxin playing with cancer regulators. Toxins (Basel). 2013; 5: 1462-74. doi: 10.3390/toxins5081462.
6. Kim SY, Choi EJ, Yun JA, Jung ES, Oh ST, Kim JG, Kang WK, Lee SH. Syndecan-1 expression is associated with tumor size and EGFR expression in colorectal carcinoma: a clinicopathological study of 230 cases. Int J Med Sci. 2015; 12: 92-9. doi: 10.7150/ijms.10497.
7. Chang SC, Lin JK, Lin TC, Liang WY. Loss of heterozygosity: an independent prognostic factor of colorectal cancer. World J Gastroenterol. 2005; 11: 778-84.
8. Zhang Z, Wang M, Zhou L, Feng X, Cheng J, Yu Y, Gong Y, Zhu Y, Li C, Tian L, Huang Q. Increased HMGB1 and cleaved caspase-3 stimulate the proliferation of tumor cells and are correlated with the poor prognosis in colorectal cancer. J Exp Clin Cancer Res. 2015; 34: 51. doi: 10.1186/s13046-015-0166-1.
9. Fujimori Y, Fujimori T, Imura J, Sugai T, Yao T, Wada R, Ajioka Y, Ohkura Y. An assessment of the diagnostic criteria for sessile serrated adenoma/polyps: SSA/Ps using image processing software analysis for Ki67 immunohistochemistry. Diagn Pathol. 2012; 7: 59. doi: 10.1186/1746-1596-7-59.
10. Liu YJ, Yan PS, Li J, Jia JF. Expression and significance of CD44s, CD44v6, and nm23 mRNA in human cancer. World J Gastroenterol. 2005; 11: 6601-6.
11. Oliveira LA, Artigiani-Neto R, Waisberg DR, Fernandes LC, Lima Fde O, Waisberg J. NM23 protein expression in colorectal carcinoma using TMA (tissue microarray): association with metastases and survival. Arq Gastroenterol. 2010; 47: 361-7.
12. Elagoz S, Egilmez R, Koyuncu A, Muslehiddinoglu A, Arici S. The intratumoral microvessel density and expression of bFGF and nm23-H1 in colorectal cancer. Pathol Oncol Res. 2006; 12: 21-7. doi: PAOR.2006.12.1.0021.
13. Drew JE, Farquharson AJ, Mayer CD, Vase HF, Coates PJ, Steele RJ, Carey FA. Predictive gene signatures: molecular markers distinguishing colon adenomatous polyp and carcinoma. PLoS One. 2014; 9: e113071. doi: 10.1371/journal.pone.0113071.
14. Naumov I, Zilberberg A, Shapira S, Avivi D, Kazanov D, Rosin-Arbesfeld R, Arber N, Kraus S. CD24 knockout prevents colorectal cancer in chemically induced colon carcinogenesis and in APC(Min)/CD24 double knockout transgenic mice. Int J Cancer. 2014; 135: 1048-59. doi: 10.1002/ijc.28762.
15. Kraus S, Hummler S, Toriola AT, Poole EM, Scherer D, Kotzmann J, Makar KW, Kazanov D, Galazan L, Naumov I, Coghill AE, Duggan D, Gigic B, et al. Impact of genetic polymorphisms on adenoma recurrence and toxicity in a COX2 inhibitor (celecoxib) trial: results from a pilot study. Pharmacogenet Genomics. 2013; 23: 428-37. doi: 10.1097/FPC.0b013e3283631784.
16. Normanno N, Pinto C, Castiglione F, Fenizia F, Barberis M, Marchetti A, Fontanini G, De Rosa G, Taddei GL. The Italian external quality assessment for RAS testing in colorectal carcinoma identifies methods-related inter-laboratory differences. J Transl Med. 2015; 13: 287. doi: 10.1186/s12967-015-0655-1.
17. El-Serafi MM, Bahnassy AA, Ali NM, Eid SM, Kamel MM, Abdel-Hamid NA, Zekri AR. The prognostic value of c-Kit, K-ras codon 12, and p53 codon 72 mutations in Egyptian patients with stage II colorectal cancer. Cancer. 2010; 116: 4954-64. doi: 10.1002/cncr.25417.
18. Guo H, Zhou X, Lu Y, Xie L, Chen Q, Keller ET, Liu Q, Zhou Q, Zhang J. Translational progress on tumor biomarkers. Thorac Cancer. 2015; 6: 665-71. doi: 10.1111/1759-7714.12294.
19. Bahnassy AA, Zekri AR, El-Houssini S, El-Shehaby AM, Mahmoud MR, Abdallah S, El-Serafi M. Cyclin A and cyclin D1 as significant prognostic markers in colorectal cancer patients. BMC Gastroenterol. 2004; 4: 22. doi: 10.1186/1471-230X-4-22.
20. Campo E, Miquel R, Jares P, Bosch F, Juan M, Leone A, Vives J, Cardesa A, Yague J. Prognostic significance of the loss of heterozygosity of Nm23-H1 and p53 genes in human colorectal carcinomas. Cancer. 1994; 73: 2913-21.
21. Ookawa K, Sakamoto M, Hirohashi S, Yoshida Y, Sugimura T, Terada M, Yokota J. Concordant p53 and DCC alterations and allelic losses on chromosomes 13q and 14q associated with liver metastases of colorectal carcinoma. Int J Cancer. 1993; 53: 382-7.
22. Liu XH, Yao S, Kirschenbaum A, Levine AC. NS398, a selective cyclooxygenase-2 inhibitor, induces apoptosis and down-regulates bcl-2 expression in LNCaP cells. Cancer Res. 1998; 58: 4245-9.
23. O’Mahony CA, Beauchamp RD, Albo D, Tsujii M, Sheng HM, Shao J, Dubois RN, Berger DH. Cyclooxygenase-2 alters transforming growth factor-beta 1 response during intestinal tumorigenesis. Surgery. 1999; 126: 364-70.
24. Tsujii M, Kawano S, Tsuji S, Sawaoka H, Hori M, DuBois RN. Cyclooxygenase regulates angiogenesis induced by colon cancer cells. Cell. 1998; 93: 705-16.
25. Cherukuri DP, Ishikawa TO, Chun P, Catapang A, Elashoff D, Grogan TR, Bugni J, Herschman HR. Targeted Cox2 gene deletion in intestinal epithelial cells decreases tumorigenesis in female, but not male, ApcMin/+ mice. Mol Oncol. 2014; 8: 169-77. doi: 10.1016/j.molonc.2013.10.009.
26. Hamelin R, Laurent-Puig P, Olschwang S, Jego N, Asselain B, Remvikos Y, Girodet J, Salmon RJ, Thomas G. Association of p53 mutations with short survival in colorectal cancer. Gastroenterology. 1994; 106: 42-8.
27. Ueno H, Hase K, Hashiguchi Y, Shimazaki H, Tanaka M, Miyake O, Masaki T, Shimada Y, Kinugasa Y, Mori Y, Kishimoto M, Kameoka S, Sato Y, et al. Site-specific tumor grading system in colorectal cancer: multicenter pathologic review of the value of quantifying poorly differentiated clusters. Am J Surg Pathol. 2014; 38: 197-204. doi: 10.1097/PAS.0000000000000113.
28. Maguire A, Sheahan K. Controversies in the pathological assessment of colorectal cancer. World J Gastroenterol. 2014; 20: 9850-61. doi: 10.3748/wjg.v20.i29.9850.
29. Takahashi N, Yamada Y, Furuta K, Nagashima K, Kubo A, Sasaki Y, Shoji H, Honma Y, Iwasa S, Okita N, Takashima A, Kato K, Hamaguchi T, et al. Association between serum ligands and the skin toxicity of anti-epidermal growth factor receptor antibody in metastatic colorectal cancer. Cancer Sci. 2015; 106: 604-10. doi: 10.1111/cas.12642.
30. Schneider S, Park DJ, Yang D, El-Khoueiry A, Sherrod A, Groshen S, Streeter O, Iqbal S, Danenberg KD, Lenz HJ. Gene expression in tumor-adjacent normal tissue is associated with recurrence in patients with rectal cancer treated with adjuvant chemoradiation. Pharmacogenet Genomics. 2006; 16: 555-63. doi: 10.1097/01.fpc.0000220563.44724.6d.
31. Yang D, Schneider S, Azuma M, Iqbal S, El-Khoueiry A, Groshen S, Agafitei D, Danenberg KD, Danenberg PV, Ladner RD, Lenz HJ. Gene expression levels of epidermal growth factor receptor, survivin, and vascular endothelial growth factor as molecular markers of lymph node involvement in patients with locally advanced rectal cancer. Clin Colorectal Cancer. 2006; 6: 305-11. doi: 10.3816/CCC.2006.n.049.
32. Roberts PJ, Der CJ. Targeting the Raf-MEK-ERK mitogen-activated protein kinase cascade for the treatment of cancer. Oncogene. 2007; 26: 3291-310. doi: 10.1038/sj.onc.1210422.
33. Barathi VA, Weon SR, Beuerman RW. Expression of muscarinic receptors in human and mouse sclera and their role in the regulation of scleral fibroblasts proliferation. Mol Vis. 2009; 15: 1277-93.
34. Adamczyk A, Niemiec J, Janecka A, Harazin-Lechowska A, Ambicka A, Grela-Wojewoda A, Domagala-Haduch M, Cedrych I, Majchrzyk K, Kruczak A, Rys J, Jakubowicz J. Prognostic value of PIK3CA mutation status, PTEN and androgen receptor expression for metastasis-free survival in HER2-positive breast cancer patients treated with trastuzumab in adjuvant setting. Pol J Pathol. 2015; 66: 133-41.
35. Bozec A, Ebran N, Radosevic-Robin N, Sudaka A, Monteverde M, Toussan N, Etienne-Grimaldi MC, Nigro CL, Merlano M, Penault-Llorca F, Milano G. Combination of mTOR and EGFR targeting in an orthotopic xenograft model of head and neck cancer. Laryngoscope. 2016; 126: E156-63. doi: 10.1002/lary.25754.
36. Lala PK, Nandi P. Mechanisms of trophoblast migration, endometrial angiogenesis in preeclampsia: The role of decorin. Cell Adh Migr. 2016; 10: 111-25. doi: 10.1080/19336918.2015.1106669.
37. Tauziede-Espariat A, Bresson D, Polivka M, Bouazza S, Labrousse F, Aronica E, Pretet JL, Projetti F, Herman P, Salle H, Monnien F, Valmary-Degano S, Laquerriere A, et al. Prognostic and Therapeutic Markers in Chordomas: A Study of 287 Tumors. J Neuropathol Exp Neurol. 2016; 75: 111-20. doi: 10.1093/jnen/nlv010.
38. Liu Z, Han L, Dong Y, Tan Y, Li Y, Zhao M, Xie H, Ju H, Wang H, Zhao Y, Zheng Q, Wang Q, Su J, et al. EGFRvIII/integrin beta3 interaction in hypoxic and vitronectinenriching microenvironment promote GBM progression and metastasis. Oncotarget. 2016; 7: 4680-94. doi: 10.18632/oncotarget.6730.
39. Taniguchi H, Yamazaki K, Yoshino T, Muro K, Yatabe Y, Watanabe T, Ebi H, Ochiai A, Baba E, Tsuchihara K. Japanese Society of Medical Oncology Clinical Guidelines: RAS (KRAS/NRAS) mutation testing in colorectal cancer patients. Cancer Sci. 2015; 106: 324-7. doi: 10.1111/cas.12595.
40. Martinez JA, Prevot S, Nordlinger B, Nguyen TM, Lacarriere Y, Munier A, Lascu I, Vaillant JC, Capeau J, Lacombe ML. Overexpression of nm23-H1 and nm23-H2 genes in colorectal carcinomas and loss of nm23-H1 expression in advanced tumour stages. Gut. 1995; 37: 712-20.
41. Radovic S, Doric M, Hukic A, Babic M, Kuskunovic S, Spahovic N. Immunohistochemical expression and significance of NM23 suppressor protein in primary gastric adenocarcinoma. Bosn J Basic Med Sci. 2013; 13: 72-7.