
INTRODUCTION
Esophageal cancer is one of the most common cancers worldwide, with approximately 456,000 new cases and 400,000 deaths in 2012 [1, 2]. Esophageal squamous cell carcinoma (ESCC) is the most prevalent esophageal cancer in the world, especially in Asian countries [3, 4]. ESCC is highly invasive and rapidly metastatic, often resulting in a poor postoperative quality of life [5, 6]. In spite of clinical advances in the field of oncology, the overall long-term survival rates of ESCC remain dismal [7]. If patients were diagnosed and treated at an early stage, the five-year survival rate after endoscopic mucosectomy could reach 100% [8]. Therefore, there is an urgent need to identify sensitive and specific biomarkers for the early diagnosis of ESCC.
One of the early events that occur during carcinogenesis are the epigenetic changes [9, 10]. Epigenetic modifications cause heritable changes to cells without changes to DNA sequence. Epigenetic modifications, such as methylation, histone modifications, DNA replication timing, nucleosome positioning, or heterochromatization, result in selective gene expression or repression [9, 11]. DNA methylation is one of the most extensively characterized epigenetic modifications [12, 13]. Aberrant DNA methylation has been associated with various human diseases, including cancer [14], autoimmune diseases [15], mental illness [16], and cardiovascular diseases [17]. Large-scale methylation analysis of human genomic DNA may provide a better understanding of the molecular mechanisms involved in the esophageal carcinogenesis [18].
In this epidemiological study, we analyzed the impact of aberrant DNA methylation levels on the clinical and pathological features of ESCC in a Chinese population, and we investigated the methylation profile as a potential biomarker for the diagnosis of esophageal cancer.
RESULTS
Identification of candidate genes
The heat map of hierarchical clustering of methylation according to the data from the Infinium Methylation 450K array is shown in Supplementary Figure 1. Based on diffScore, delta β and gene function, we selected 16 candidate genes (RASSF1, PIK3R1, ITGAV, NFKB1, TAP2, APC, BRCA1, CCND1, CDH1, CDKN2A, BNIP3, HTATIP2, PRDM16, PTEN, PTX3 and SOCS1) for validation (Supplementary Figure S2).
Validation of methylated CpG sites
We collected 43 cancer lesion samples, 43 remote normal-appearing esophageal tissues, and 10 healthy control tissues. The patients included 28 males and 15 females, with the age ranging from 46 to 81 years (Table 1). We also recruited 10 healthy controls, including 7 males and 3 females, with the age ranging from 42 to 74 years (mean ± standard deviation: 58.8 ± 9.2 years). We sequenced 1160 CpG sites in the promoter region of 16 candidate genes. After excluding loci with low calling rate, 961 CpG sites in 15 genes met the requirements for further analysis (Table 2). There were 33.82% (325/961) CpG sites showing significant differences in the distribution of methylation between ESCC and normal esophageal tissues (P < 0.05). The proportion of differentially methylated sites in each gene is shown in Figure 1. There were 195 sites having 2 to 10 fold changes and 58 sites having more than 10 fold changes between ESCC and normal esophageal tissues. 299 out of differentially methylated 325 CpG sites (92 %) had higher methylation level in ESCC samples compared with healthy controls. In addition, 254 CpG sites had significantly different methylation between remote normal-appearing tissues and health controls, and 221 CpG sites had significantly different methylation status between ESCC and remote normal-appearing tissues. The above results are summarized in a Venn diagram in Figure 2. There were 64 CpG sites differentially methylated between these three groups (cancer lesions, remote normal-appearing samples, and health controls). Among them, 54 CpG sites were located in the gene of PRDM16.
Table 1: Clinical characteristics of patients
No. |
Gender |
Age |
Tumor location |
Smoking |
Drinking |
TNM |
G stage (histologic grade) |
|---|---|---|---|---|---|---|---|
1 |
Female |
78 |
Lower |
No |
No |
T2N0M0 |
G3 |
2 |
Female |
68 |
Lower |
No |
No |
T1N0M0 |
G2 |
3 |
Male |
72 |
Middle |
Yes |
No |
T1N0M0 |
G2 |
4 |
Male |
64 |
Middle |
Yes |
Yes |
T3N1M0 |
G2 |
5 |
Male |
69 |
Middle |
No |
No |
T2N0M0 |
G2 |
6 |
Male |
62 |
Middle |
No |
No |
T3N0M0 |
G2 |
7 |
Male |
57 |
Middle |
Yes |
Yes |
T4N0M0 |
G2 |
8 |
Female |
58 |
Upper |
No |
No |
T2N1M0 |
G2 |
9 |
Female |
73 |
Upper |
No |
No |
T3N0M0 |
G2 |
10 |
Female |
68 |
Middle |
No |
No |
T3N1M0 |
G2 |
11 |
Female |
68 |
Upper |
No |
No |
T3N1M0 |
G2 |
12 |
Female |
69 |
Middle |
No |
No |
T2N1M0 |
G2 |
13 |
Female |
64 |
Middle |
No |
No |
T1N0M0 |
G2 |
14 |
Male |
64 |
Lower |
Yes |
Yes |
T2N2M0 |
G2 |
15 |
Female |
61 |
Lower |
No |
No |
T3N1M0 |
G3 |
16 |
Male |
75 |
Middle |
Yes |
No |
T3N1M0 |
G3 |
17 |
Male |
54 |
Middle |
Yes |
No |
T3N0M0 |
G1 |
18 |
Female |
65 |
Middle |
No |
No |
T2N0M0 |
G2 |
19 |
Male |
54 |
Lower |
Yes |
Yes |
T3N1M0 |
G2 |
20 |
Male |
62 |
Middle |
No |
No |
T3N1M0 |
G3 |
21 |
Male |
78 |
Middle |
Yes |
No |
T3N1M0 |
G2 |
22 |
Male |
63 |
Middle |
Yes |
No |
T2N0M0 |
G3 |
23 |
Female |
76 |
Upper |
Yes |
Yes |
T1N0M0 |
G2 |
24 |
Male |
59 |
Middle |
Yes |
Yes |
T2N1M0 |
G3 |
25 |
Female |
60 |
Middle |
No |
No |
T2N1M0 |
G2 |
26 |
Male |
67 |
Middle |
No |
No |
T2N0M0 |
G3 |
27 |
Male |
60 |
Middle |
No |
No |
T2N1M0 |
G3 |
28 |
Male |
60 |
Middle |
No |
No |
T3N1M0 |
G3 |
29 |
Male |
67 |
Middle |
Yes |
Yes |
T3N0M0 |
G2 |
30 |
Male |
46 |
Middle |
Yes |
Yes |
T3N1M0 |
G2 |
31 |
Male |
81 |
Middle |
No |
Yes |
T2N0M0 |
G2 |
32 |
Male |
61 |
Middle |
No |
Yes |
T1N1M0 |
G3 |
33 |
Male |
46 |
Middle |
No |
No |
T3N1M0 |
G3 |
34 |
Male |
65 |
Middle |
Yes |
Yes |
T3N1M0 |
G2 |
35 |
Female |
70 |
Middle |
No |
No |
T3N1M0 |
G3 |
36 |
Male |
67 |
Lower |
No |
No |
T1N0M0 |
G3 |
37 |
Female |
60 |
Upper |
No |
No |
T1N0M0 |
G2 |
38 |
Male |
64 |
Lower |
No |
Yes |
T3N0M0 |
G2 |
39 |
Male |
77 |
Lower |
Yes |
No |
T3N1M0 |
G2 |
40 |
Male |
74 |
Middle |
Yes |
Yes |
T3N2M0 |
G3 |
41 |
Male |
71 |
Lower |
Yes |
Yes |
T3N3M0 |
G3 |
42 |
Female |
71 |
Middle |
No |
No |
T1N0M0 |
G2 |
43 |
Male |
60 |
Middle |
Yes |
Yes |
T2N1M1 |
G2 |
Table 2: Sequenced sites of selected genes
Genes |
Fragment |
Start/Stop |
Size (bp) |
Number of CpG sites |
|---|---|---|---|---|
RASSF1 |
RASSF1_M1 |
50377767/50378028 |
261 |
21 |
RASSF1_M2 |
50378005/50378218 |
213 |
23 |
|
RASSF1_M3 |
50378194/50378472 |
278 |
27 |
|
RASSF1_M5 |
50375039/50375295 |
256 |
23 |
|
RASSF1_M6 |
50374899/50375126 |
227 |
19 |
|
RASSF1_M7 |
50374706/50374925 |
219 |
29 |
|
RASSF1_M9 |
50374301/50374516 |
215 |
13 |
|
PIK3R1 |
PIK3R1_M2 |
67511168/67511412 |
244 |
22 |
PIK3R1_M4 |
67511596/67511806 |
210 |
23 |
|
PIK3R1_M5 |
67511286/67511520 |
234 |
21 |
|
PIK3R1_M6 |
67511047/67511305 |
258 |
22 |
|
PIK3R1_M7 |
67512226/67512438 |
212 |
18 |
|
PIK3R1_M8 |
67584255/67584471 |
216 |
15 |
|
ITGAV |
ITGAV_M1 |
187454700/187454960 |
260 |
21 |
ITGAV_M2 |
187454936/187455177 |
241 |
32 |
|
ITGAV_M3 |
187455157/187455369 |
212 |
21 |
|
NFKB1 |
NFKB1_M2 |
103422534/103422795 |
261 |
37 |
NFKB1_M3 |
103422775/103422981 |
206 |
23 |
|
NFKB1_M4 |
103423077/103423302 |
225 |
18 |
|
TAP2 |
TAP2_M1 |
32806418/32806681 |
263 |
12 |
APC |
APC_M2 |
112073375/112073585 |
210 |
15 |
BRCA1 |
BRCA1_M1 |
41275281/41275523 |
242 |
18 |
BRCA1_M3 |
41275011/41275281 |
270 |
11 |
|
BRCA1_M4 |
41275268/41275528 |
260 |
12 |
|
CCND1 |
CCND1_M3 |
69458670/69458890 |
220 |
14 |
CDKN2A |
CDKN2A-2 |
21993123/21993331 |
208 |
20 |
CDKN2A-4 |
21993770/21993957 |
187 |
16 |
|
CDKN2A-6 |
21994239/21994504 |
265 |
26 |
|
CDKN2A-7 |
21994477/21994700 |
223 |
11 |
|
CDKN2A_M8 |
21972954/21973198 |
244 |
11 |
|
CDKN2A_M9 |
21974670/21974872 |
202 |
15 |
|
CDKN2A_M10 |
21974852/21975095 |
243 |
20 |
|
BNIP3 |
BNIP3-1 |
133795927/133796159 |
232 |
10 |
BNIP3-3 |
133796371/133796631 |
260 |
33 |
|
BNIP3-6 |
133797020/133797250 |
230 |
26 |
|
BNIP3-7 |
133797230/133797402 |
172 |
16 |
|
HTATIP2 |
HTATIP2-1 |
20385087/20385355 |
268 |
24 |
HTATIP2-2 |
20385336/20385546 |
210 |
20 |
|
PRDM16 |
PRDM16-1 |
2983847/2984081 |
234 |
14 |
PRDM16-5 |
2984736/2984979 |
243 |
29 |
|
PRDM16-7 |
2985182/2985386 |
204 |
19 |
|
PRDM16-8 |
2985367/2985573 |
206 |
16 |
|
PRDM16-9 |
2985553/2985775 |
222 |
19 |
|
PTEN |
PTEN-1 |
89623758/89624026 |
268 |
21 |
PTX3 |
PTX3-1 |
157155257/157155524 |
267 |
9 |
PTX3-2 |
157155500/157155711 |
211 |
25 |
|
SOCS1 |
SOCS1-1 |
11349069/11349310 |
241 |
20 |
SOCS1-3 |
11349540/11349759 |
219 |
31 |
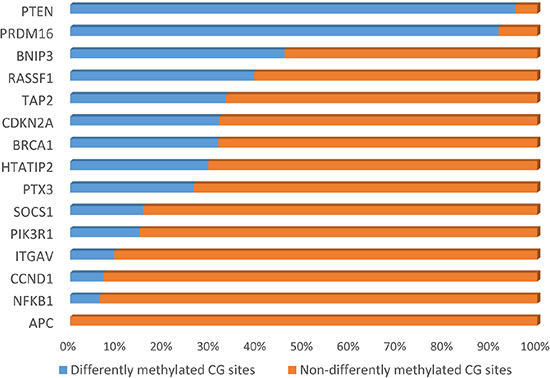
Figure 1: Percent of differentially methylated sites in each candidate gene.
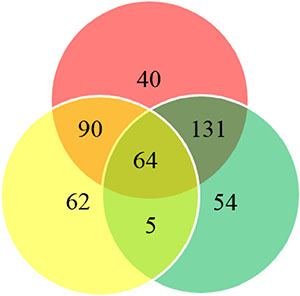
Figure 2: Venn diagram summarizing the differentially methylated sites. Red circle indicates differentially methylated sites between cancer and healthy control tissues; yellow circle indicates differentially methylated sites between cancer and remote normal-appearing tissue; green circle indicates differentially methylated sites between remote normal-appearing and healthy control tissues.
Diagnostic value analysis
We further analyzed the cumulative methylation levels by considering multiple CpG sites in each gene. The diagnostic values of selected CpG sites and genes were estimated based on three different models.
Model 1
We calculated the cumulative methylation by summarizing the frequency of all CpG sites in each gene. Nine genes (APC, BNIP3, BRCA1, CCND1, CDKN2A, HTATIP2, ITGAV, PRDM16 and TAP2) showed significantly different cumulative methylation levels among the three groups. The methylation levels of APC, ITGAV, PRDM16 and PTX3 were significantly different between esophageal cancer and healthy control tissues (Table 3). The AUC (95% CI) of each gene in the diagnosis of ESCC is listed in Table 4. The PRDM16 gene showed the highest diagnostic value with the AUC (95% CI) of 0.958 (0.906–1.000), followed by ITGAV, with the AUC (95% CI) of 0.779 (0.651–0.907).
Table 3: Comparison of cumulative methylation levels of multiple CpG sites in each gene using different models
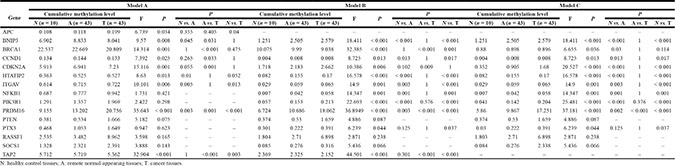
Table 4: Diagnostic values of selected genes for esophageal cancer using different models
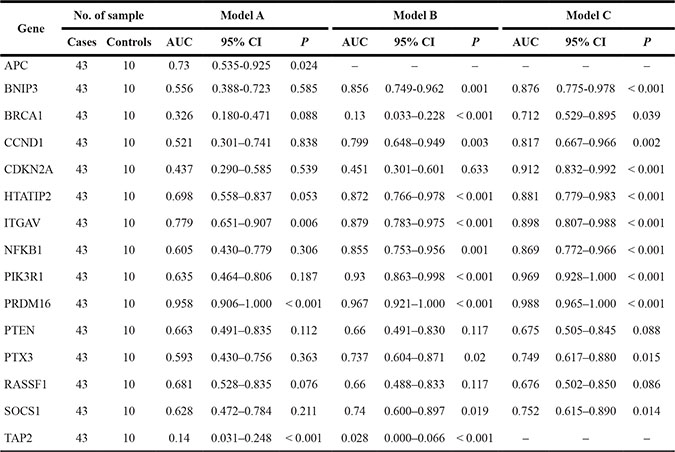
Abbreviations: AUC: area under the curve; CI: confidence interval.
Model 2
By excluding non-significantly differentiated CpG sites, we calculated the cumulative methylation by summarizing the frequency of significant CpG sites in each gene. Eleven genes (BNIP3, BRCA1, CCND1, CDKN2A, HTATIP2, ITGAV, NFKB1, PIK3R1, PRDM16, PTX3 and TAP2) showed significant differences in methylation between groups. The number of differently methylated genes increased to 10 (BNIP3, BRCA1, CCND1, HTATIP2, ITGAV, NFKB1, PIK3R1, PRDM16, PTX3 and TAP2) between ESCC and healthy control tissues (Table 3). The AUC values (95% CI) of each gene in the diagnosis of ESCC are listed in Table 4. Methylation of PRDM16 gene had the highest diagnostic value, with the AUC (95% CI) of 0.967 (0.921–1.000), followed by PIK3R1, with the AUC (95% CI) of 0.930 (0.863–0.998).
Model 3
We further excluded CpG sites with negative correlations and kept 299 sites for analysis. Ten genes (BNIP3, BRCA1, CCND1, CDKN2A, HTATIP2, ITGAV, NFKB1, PIK3R1, PRDM16 and PTX3) had significantly different methylation status among the three groups. The methylation levels of BNIP3, CCND1, CDKN2A, HTATIP2, ITGAV, NFKB1, PIK3R1, PRDM16 and PTX3 were significantly different between esophageal cancer and healthy control tissues (Table 4). The AUC (95% CI) of each gene in the diagnosis of ESCC is listed in Table 4. The methylation of PRDM16 gene showed the highest diagnostic value, with the AUC (95% CI) of 0.988 (0.965–1.000), followed by PIK3R1, with the AUC (95% CI) of 0.969 (0.928–1.000). Compared with findings using model 1 and model 2, the AUC of each gene in model 3 has greatly increased. Especially for BRCA1 and CDKN2A, the AUC increased from less than 0.5 to 0.712 and 0.912, respectively. Based on the model 3, the cumulative methylation level of most genes increased with the histologic changes from normal to normal-appearing tissues and cancer lesions (Figure 3). To avoid false positives caused by multiple comparisons between groups, we used the Bonferroni correction method. Using Bonferroni correction, 49 CpG sites in 4 genes were significant, including 1 site in BNIP3, 1 site in PIK3R1, 46 sites in PRDM16, and 1 site in SOCS1. The cumulative methylation levels of PRDM16 were significantly different among the three groups (F = 38.445, P < 0.001). The AUC of PRDM16 was 0.963 (95% CI: 0.914–1.000).
Figure 3: The cumulative methylation levels of multiple CpG sites in each gene.
Methylation status and clinical characteristics
The methylation frequency was higher in patients at advanced cancer stages. For example, samples from patients with N1-3 stage had an average cumulative methylation value of 9.56 in RASSF1 gene, which was significantly higher than that in patients at N0 stage (cumulative methylation value: 3.54). For HTATIP2 gene, samples from patients at G1-2 stages also had a significantly higher cumulative methylation level compared with patients at G3 stage (P < 0.05, Figure 4). The cumulative methylation levels of these genes did not correlate with patient’s gender (male and female) and age (< 60 and >= 60 years).
Figure 4: The relationship between clinical characteristics and DNA methylation in cancer lesions.
Protein expression and methylation status
Next, we analyzed protein levels of RASSF1, PIK3R1 and PTEN by immunohistochemistry. In the esophageal cancer lesions, PIK3R1 was expressed in 65.5% (19/29) cases (+: 18; ++: 1; +++: 0), PTEN was expressed in 48.3% (15/31) cases (+: 14; ++: 1; +++: 0), and RASSF1 was expressed in 56.7% (17/30) cases (+: 14; ++: 3; +++: 0). We observed a negative correlation between the methylation level and the IOD, but the coefficient was not significant (RASSF1: r = −0.122, P = 0.521; PIK3R1: r = –0.215, P = 0.264; PTEN: r = −0.095, P = 0.619). The methylation level of RASSF1 gene was significantly higher in samples with negative expression than in samples with positive expression (P = 0.022).
DISCUSSION
When cancer occurs, a massive global hypomethylation is frequently observed, while certain genes can be hypermethylated at the CpG islands [19]. Previous studies have indicated aberrant DNA methylation in esophageal cancer; however, those studies have focused on limited CpG sites [20–22]. In this study, we used a two-stage study design, sequenced 1160 CpG sites in the promoter region of 16 candidate genes, and demonstrated that aberrant DNA methylation can be a potential biomarker for esophageal cancer.
Compared with other methods, such as MSP, Q-PCR, MethyLight or bisulfite pyrosequencing, NGS used in this study can capture full sample diversity with small amounts of DNA. In addition, NGS can enhance epigenetic analyses with high coverage density and flexibility, which help advance our understanding of epigenetics at the genomic level [23]. A fluorescently labeled reversible terminator is utilized in this system, allowing for the accrual of qualitative and quantitative information of nucleic acid at an incredible throughput while incurring relatively limited costs [24].
One of the most robust epigenetic marks found in this study was PRDM16 gene. PRDM16 is located near the 1p36.3 breakpoint, encoding a zinc finger transcription factor and contains an N-terminal PR domain. It is known to be a fusion partner of RPN1, RUNX1 and other genes in hematopoietic malignancies [25]. The malfunction of PRDM16 is related to a poor prognosis of cancer patients [26]. For example, PRDM16 is often methylated in lung cancer cells, with downregulated protein expression [27]. The demethylation drug 5-aza-2′-dC upregulates PRDM16 expression and suppresses growth of lung cancer cells [27].
Other genes with a higher AUC (over 0.9) for distinguishing ESCC were PIK3R1 and CDKN2A. PIK3R1 encodes a p85 regulatory subunit alpha and appears to play a tumor suppressor role because PI3K subunit p85α (p85α) regulates and stabilizes p110α [28]. A previous study has reported that the expression of PRK3R1 negatively correlates with hypermethylation of CpG sites in PIK3R1 [29]. Our results also showed similar negative correlations, although they were not statistically significant; this may be due to the limited sample size. CDKN2A blocks phosphorylation of the Rb protein and inhibits cell cycle progression. CDKN2A is aberrantly methylated in esophageal cancer [30], and is associated with metastatic and invasive phenotypes [31]. Similar CDKN2A methylation patterns have been observed in gastric and nasopharyngeal carcinoma [32, 33]. As the regional lymph node metastasis is associated with the patient’s prognosis, the methylation status of these genes might be used to assess the possibility of recurrence and metastasis of ESCC patients and also help to implement proper medications. Moreover, our study shows that the methylation levels of selected genes, such as RASSF1 and HTATIP2, change with the cancer stages, indicating their potential values in the prognosis of ESCC.
There are several limitations in this study. First, the bisulfite conversion efficiency is critical for the accuracy and the reliability of the results. The incomplete conversion of unmethylated cytosine to uracil or inappropriate conversion of methylcytosine to thymine can cause over- or underestimation of the methylation level. It is also noteworthy that the bisulfite conversion technique cannot be used to discriminate the methylated cytosine from 5-hydroxymethylcytosine [34]. Second, the false positives may be caused by multiple comparison when we compared various CpG sites between groups. We used the Bonferroni correction method to adjust for the test level; however, this is an overcorrection when the tests are correlated [35]. Third, aberrant DNA methylation usually occurs somatically in cancer cells and can also be detected in peripheral blood samples [36]. To evaluate the clinical use of aberrant DNA methylation, a blood-based assay is preferable, since it uses a far less invasive procedure.
In conclusion, aberrant DNA methylation is a promising biomarker that has a good predictive value for identifying esophageal cancer in a molecular diagnostic laboratory. The hypermethylation status of PRDM16, PIK3R1, and CDKN2A genes might be used as a potential biomarker for the diagnosis of ESCC.
MATERIALS AND METHODS
Study design
First, we used the Illumina Infinium 450K Methylation Beadchip to construct a genome-wide DNA methylation profile. Then, candidate genes were selected for the validation using the Next-Generation Sequencing (NGS) platform (Illumina MiSeq platform).
Study subjects
This study was approved by the Ethics Committee of Nanjing Medical University. Written informed consent was obtained from all participants. The methods were carried out in accordance with the approved guidelines. Esophageal cancer patients were recruited in the Yangzhong People’s Hospital from 2012 to 2016. Yangzhong is an area with high morbidity and mortality rates of the upper digestive tract cancers [37]. The inclusive criteria were: (1) Patients were diagnosed as ESCC with histopathological evidence; (2) All patients were of Chinese Han origin living in Yangzhong longer than five years; (3) Patients underwent esophagectomy and the lesions were eligible for sampling; (4) None of the patients had received preoperative radiotherapy or chemotherapy. Tissues in the center of the cancer lesion and remote normal-appearing esophagus were excised and immediately stored in -80oC freezer. Healthy control esophageal tissues were collected from individuals who had no cancer history and participated in a screening program for upper digestive tract cancers.
DNA extraction
Genomic DNA was extracted from tissues using the QIAmp DNA Mini Kit (Qiagen, Hilden, Germany). The quality and concentration were evaluated with Thermo NanoDrop 2000-1 spectrophotometer (NanoDrop Technologies, Montchanin, DE, USA).
Infinium methylation 450K array
We used the Infinium 450K Methylation Beadchip (Illumina, San Diego, CA, USA) to evaluate the methylation status of five paired tumor samples and corresponding remote normal-appearing esophagus tissues, along with two normal controls from the healthy population.
Next-generation sequencing (NGS)
Primer design and optimization
Genomic regions were analyzed and transformed to bisulfite-converted sequences by gene CpG software. The primers were designed by the Gensky Bio-Tech Co., Ltd. (Shanghai) to amplify regions of interest from the bisulfite converted DNA. Different sets of primers were compared using 1 ng bisulfite modified positive and negative control DNA samples. The final optimized primers are listed in Table 5.
Table 5: Primers designed for multiplex PCR
Genes |
Fragment |
Forward primer |
Reverse primer |
|---|---|---|---|
RASSF1 |
RASSF1_M1 |
AAGGAGGGAAGGAAGGGTAAG |
CCAACTCCCRCAACTCAATAAAC |
RASSF1_M2 |
GGGGAGTTTGAGTTTATTGAGTTG |
CCCAAATAAAATCRCCACAAAAATC |
|
RASSF1_M3 |
GATTTTTGTGGYGATTTTATTTGG |
TACATATAAACAACCACCTCTACTCATCT |
|
RASSF1_M5 |
GGTAAGYGTATAAGAGTGGTTTTTGGT |
AACAAACCACAATACAAACATTCTC |
|
RASSF1_M6 |
GATTTAGTTTTTGTTTTATTGGGGTAG |
ACCCAAACTAACCCAAACTCC |
|
RASSF1_M7 |
GTTGTTTTAGGTTATTTYGAAAGAAGG |
CTACCCCAATAAAACAAAAACTAAATC |
|
RASSF1_M8 |
GTTAGGAGGGTGGGGTTGTTTA |
CCTTCTTTCRAAATAACCTAAAACAAC |
|
RASSF1_M9 |
GGTYGGTTTTAGTTATAGTTGGATAATG |
TAAACAACCCCACCCTCCTAAC |
|
PIK3R1 |
PIK3R1_M2 |
GTTTGGGGTTGGTTGAAAGAT |
CCTAACRAACCCTTCCTACCAC |
PIK3R1_M4 |
TGGAGYGGAGTTGGAGGAAGTAG |
CACACCCRAAACTACTACTACCTACCTA |
|
PIK3R1_M5 |
GGAAAYGGGAGTTAGGATGG |
CAACAACAACCCCRAATATATATACTC |
|
PIK3R1_M6 |
GTAGYGATTTTGGTTGTAGTTGGAG |
CCATCCTAACTCCCRTTTCC |
|
PIK3R1_M7 |
TTTYGTGGTTTTTTAGTTGTAGTTAGG |
CCAACAACCTACCCAAACTTAAC |
|
PIK3R1_M8 |
GAAATTTAGTTGGTTTTTTAATGAGGA |
ACCTCCCCCCAACCTATTC |
|
ITGAV |
ITGAV_M1 |
TTGAGAGGTAGGATGGGTGAG |
TCTTCTCTCRAAACTCCTACTACCTCT |
ITGAV_M2 |
AGGTAGTAGGAGTTTYGAGAGAAGAAG |
AAACTCAACCCTCTTACCTACCC |
|
ITGAV_M3 |
GGGGTAGGTAAGAGGGTTGAG |
ACTCCTCCTCCTTCCAAATCTC |
|
NFKB1 |
NFKB1_M2 |
GGGGTAGGAAGAGGAGGTTT |
AACCRAACCAAACCAATCAAC |
NFKB1_M3 |
GTTGATTGGTTTGGTTYGGTT |
CCCTACCRAACCCCCACT |
|
NFKB1_M4 |
GGGAGGAGGTTGATAGTAGTTGAG |
CACTCCAACCTTCTCACCATC |
|
TAP2 |
TAP2_M1 |
GGTGGTTTAYGTTTGTAATTATAGTATTTTG |
CTCACTCTTATCRCCCAAACTAAAATAC |
TAP2_M2 |
GTTAAGGTTTTTATTTTGGGTTGG |
TCTCCAATTACAAAACATTCTCCA |
|
TAP2_M3 |
GGAGTGGGTAGTTATTTGGGTTG |
CCAACCCAAAATAAAAACCTTAAC |
|
APC |
APC_M2 |
GGGTTAGGGTTAGGTAGGTTGTG |
CATTCTATCTCCAATAACACCCTAAC |
BRCA1 |
BRCA1_M1 |
GGGAGGAATTTTGTAAAGAAGAGG |
ACRAACTAAAAAACTCCTCCAACAC |
BRCA1_M2 |
GGGGAGGYGGTAATGTAAAGAT |
ACCCCTCAACCCCAATATTTA |
|
BRCA1_M3 |
AGTGATGTTTTGGGGTATTGG |
AAACTCCTAACCTCATAACCAACC |
|
BRCA1_M4 |
GAGGTTAGGAGTTTTAGATTAGTTTGATT |
CCATCCTCTCATACATACCAACC |
|
CCND1 |
CCND1_M3 |
TAGGGTTTGATTTTYGTTTGTAGG |
AAAACCCCAAAAATTCAAACTC |
CDH1 |
CDH1_M1 |
GGAATTGTAAAGTATTTGTGAGTTTG |
CTCCTCAAAACCCRAACTTTCT |
CDKN2A |
CDKN2A-2 |
GGGATATGGAGGGGGAGAT |
CTTCTTCCTCTTTCCTCTTCCC |
CDKN2A-4 |
AATAAAATAAGGGGAATAGGGGAG |
CCATCTTCCCACCCTCAA |
|
CDKN2A-6 |
GTAGTTAAGGGGGTAGGAGTGG |
ACTACTACCCTAAACRCTAACTCCTCAA |
|
CDKN2A-7 |
TTGAGGAGTTAGYGTTTAGGGTAGTAGT |
TCAATAATACTACRAAAACCACATATCTAAATC |
|
CDKN2A_M8 |
GTTTTTTAGGTTGGAGTGTAATGG |
TCTATAATCCCAACATTCTAAAAAACC |
|
CDKN2A_M9 |
TTAGAGGATTTGAGGGATAGGGT |
AACCAATCAACCRAAAACTCC |
|
CDKN2A_M10 |
GGAGTTTTYGGTTGATTGGTT |
CCCAAAAAACCTCCCCTTT |
|
BNIP3 |
BNIP3-1 |
GGTAAYGTGGATTTTGAGGTTGT |
CCATCCTCCCCTTCCRTAC |
BNIP3-3 |
GGTTGYGGGATGTGTTTTAGTT |
CAAACCTCTACCCCTCRCCC |
|
BNIP3-6 |
GGTGGGTYGGAGTTGAGYGT |
TACACCRCRAAAACCCCTTAC |
|
BNIP3-7 |
GTAAGGGGTTTTYGGGGTGTA |
CCTCTAAAAAATACCTCCCAATCC |
|
HTATIP2 |
HTATIP2-1 |
TTTGGGTGAGTTGAGTTTAGTAGG |
AAACATCCCACCTTCCCTAA |
HTATIP2-2 |
TTAGGGAAGGTGGGATGTTT |
ACTACTAACATCACTAAACATACCCCAC |
|
PRDM16 |
PRDM16-1 |
GGTAGGGAATGGGGTTGTG |
CTAAACCTTCTACCTTAAATCCTCC |
PRDM16-2 |
GGAGGATTTAAGGTAGAAGGTTTAG |
ACTCCTAACCTTACCCTCCCTAC |
|
PRDM16-3 |
GTAGGGAGGGTAAGGTTAGGAGT |
AATAACCCRAACCCAAAAACCT |
|
PRDM16-4 |
AGGTTTTTGGGTTYGGGTTATT |
AACTAAACCACCTTCRAAAACCC |
|
PRDM16-5 |
GGGTTTTYGAAGGTGGTTTAGTT |
CTCCRCCACTACCCAAAC |
|
PRDM16-7 |
GAGGGGAGAATGTAGGAGAAAAG |
CTACTACTCCCRCCCCAACC |
|
PRDM16-8 |
GGTTGGGGYGGGAGTAGTAG |
CACTTATCTCTCCCCCCTCTC |
|
PRDM16-9 |
GAGAGGGGGGAGAGATAAGTG |
CACTATCTTCATCTCCCCAACA |
|
PTEN |
PTEN-1 |
TTAGGGAGGGGGTTTGAGT |
CTCCTCAACAACCAAAAACCTAA |
PTX3 |
PTX3-1 |
GTAGGTTTGGGYGGGTTGTT |
TCCAAAACACTAATCAACCTAACCT |
PTX3-2 |
AGGTTAGGTTGATTAGTGTTTTGGA |
CTCCTTACCTACCRACAACCAA |
|
SOCS1 |
SOCS1-1 |
GGGGAGGGTATTTATATGGTTTTA |
ACTAAAAACCCCRCTACRCCAAC |
SOCS1-2 |
GTTGGYGTAGYGGGGTTTTTAGT |
CCTACRAATTCTACTAAAAACCCCTAA |
|
SOCS1-3 |
TTAGGGGTTTTTAGTAGAATTYGTAGG |
CAATCTCCACAACAACAAAACC |
Bisulfite conversion and multiplex amplification
Genomic DNA (about 400 ng) was subjected to sodium bisulfite modification using EZ DNA Methylation™-GOLD Kit (Zymo Research, Orange, CA, USA) according to the manufacturer’s protocols. An un-methylated cytosine was converted to uracil when treated with bisulfite, whereas a methylated cytosine remained as cytosine [38]. A multiplex PCR was performed using the optimized primer sets. A 20 μl PCR reaction mixture was prepared for each reaction, including 1x buffer (TaKaRa, Tokyo, Japan), 3 mM Mg2+, 0.2 mM dNTP, 0.1 μM of each primer, 1U HotStarTaq polymerase (TaKaRa, Tokyo, Japan) and 2 μl of template DNA. The cycling program was 95ºC for 2 min; 11 cycles of 94ºC for 20 sec, 63ºC for 40 sec with a decreasing temperature step of 0.5ºC per cycle, 72ºC for 1 min; then followed by 24 cycles of 94ºC for 20 sec, 65ºC for 30 sec, 72ºC for 1 min; 72ºC for 2 min.
Index PCR and sequencing
PCR amplicons were then diluted and amplified using the indexed primers. Specifically, a 20 μl mixture was prepared for each reaction, including 1x buffer (NEB, MA, USA), 0.3 mM dNTP, 0.3 μM forward primer, 0.3 μM index primer, 1 U Q5TM DNA polymerase (NEB, MA, USA) and 1 μL of diluted template (PCR amplicons from the previous step). The cycling program was 98ºC for 30 sec; 11 cycles of 98ºC for 10 sec, 65ºC for 30 sec, 72ºC for 30 sec; 72ºC for 5 min. The PCR products (170 bp –270 bp) were separated by agarose electrophoresis and purified using the QIAquick Gel Extraction kit (Qiagen, Hilden, Germany). Libraries from different samples were quantified and pooled together, followed by sequencing on the Illumina MiSeq platform according to the manufacturer's protocols. Sequencing was performed with a 2 × 300 bp paired-end mode. Quality control of sequencing-reads was performed by FastQC (http://www.bioinformatics.bbsrc.ac.uk/projects/fastqc/). Filtered-reads were aligned back to the reference genome using the Bismark software (http://www.bioinformatics.babraham.ac.uk/projects/bismark/). After reads recalibration withUSEARCH [39], the methylation and haplotype were analyzed using the Perl script.
Immunohistochemistry
Sections (4 μm) of formalin fixed, paraffin embedded tissues were prepared. The slides were dried at 56oC for 1 hour, then deparaffinized with fresh xylene and rehydrated through ethanol washes. Antigen retrieval was performed by citrate buffer incubation (pH 6.0) using a microwave oven for 10 min at 100oC. Slides were incubated for 15 min with 3% hydrogen peroxide, washed in PBS, and incubated with an appropriate primary antibody followed by a secondary antibody. Sections were counterstained, and examined by fluorescence microscopy. Antibodies and dilutions used in immunocytochemistry were as follows: rabbit anti-PTEN (1:100); rabbit anti-RASSF1 (1:100); rabbit anti- PIK3R1 (1:100); rabbit anti IgG (1:400). The integrated optical density (IOD) was calculated for each sample [40]. For semi-quantitative analysis of the degree of staining, slides were independently scored by two pathologists. The scores were defined as follows: 0 (< 5% positive tumor cells); 1 (≤ 25% positive tumor cells); 2 (26–50% positive tumor cells); 3 (51–75% positive tumor cells); and 4 (> 75% positive tumor cells). Staining intensity was graded as: 0 (no staining); 1 (weak staining: light yellow); 2 (moderate staining: yellow brown); and 3 (strong staining: brown). Staining index (SI) was calculated as the product of staining intensity score and the proportion of positive tumor cells [41]. An SI score of 9–12 indicated strong positive (+++); 5–8 indicated positive (++); 1–4 indicated weakly positive (+); 0 indicated negative (–) staining.
Statistical analysis
We used the IBM SPSS Statistics 19.0 (IBM Corp., NY, USA) and the R program (https://www.r-project.org/) to analyze the data. Individual and cumulative methylation statuses of candidate genes were analyzed. We used the t-test, ANOVA or nonparametric test to compare the differences of methylation between groups. Considering the false positive caused by multiple comparisons, the Bonferroni correction was applied. The receiver operative characteristics (ROC) curve was drafted to reflect the diagnostic value of biomarkers. The area under the curve (AUC) together with 95% confidence interval (CI) were calculated.
CONFLICTS OF INTEREST
The authors declare that they have no competing interests.
FUNDING
This study is supported by the National Natural Science Foundation of China (81172268), Social Development Project in Jiangsu Province (BE2015694), Scientific Research Innovation Project for Graduate Student in Jiangsu Province (KYLX16_1125), Qing Lan Project (2014), Priority Academic Program Development of Jiangsu Higher Education Institutions (PAPD), and Medical Science and Technology Development Foundation of Jiangsu (Y201313). The funding agencies had no role in the study design, data collection, analysis, decision to publish, or preparation of the manuscript.
REFERENCES
1. Napier KJ, Scheerer M, Misra S. Esophageal cancer: A Review of epidemiology, pathogenesis, staging workup and treatment modalities. World J Gastrointest Oncol. 2014; 6:112–120.
2. Arnold M, Soerjomataram I, Ferlay J, Forman D. Global incidence of oesophageal cancer by histological subtype in 2012. Gut. 2015; 64:381–387.
3. Ingelfinger JR, Rustgi AK, El-Serag HB. Esophageal Carcinoma. New England Journal of Medicine. 2014; 371:2499–2509.
4. Vizcaino AP, Moreno V, Lambert R, Parkin DM. Time trends incidence of both major histologic types of esophageal carcinomas in selected countries, 1973–1995. Int J Cancer. 2002; 99:860–868.
5. Enzinger PC, Mayer RJ. Esophageal cancer. N Engl J Med. 2003; 349:2241–2252.
6. Naidoo R, Ramburan A, Reddi A, Chetty R. Aberrations in the mismatch repair genes and the clinical impact on oesophageal squamous carcinomas from a high incidence area in South Africa. J Clin Pathol. 2005; 58:281–284.
7. Cao H, Li E, Xu L. Abstract 2205: A three-gene signature predicts esophageal squamous cell carcinoma prognosis. Cancer Res. 2014; 74:2205–2205.
8. Wang GQ. [30-year experiences on early detection and treatment of esophageal cancer in high risk areas]. Zhongguo Yi Xue Ke Xue Yuan Xue Bao. 2001; 23:69–72.
9. Feinberg AP, Ohlsson R, Henikoff S. The epigenetic progenitor origin of human cancer. Nat Rev Genet. 2006; 7:21–33.
10. Jia Y, Yang Y, Brock MV, Cao B, Zhan Q, Li Y, Yu Y, Herman JG, Guo M. Methylation of TFPI-2 is an early event of esophageal carcinogenesis. Epigenomics. 2012; 4:135–146.
11. Soto J, Rodriguez-Antolin C, Vallespin E, de Castro Carpeno J, Ibanez de Caceres I. The impact of next-generation sequencing on the DNA methylation-based translational cancer research. Transl Res. 2016; 169:1–18 e11.
12. Siegfried Z, Simon I. DNA methylation and gene expression. Wiley Interdiscip Rev Syst Biol Med. 2010; 2:362–371.
13. Gravina GL, Festuccia C, Marampon F, Popov VM, Pestell RG, Zani BM, Tombolini V. Biological rationale for the use of DNA methyltransferase inhibitors as new strategy for modulation of tumor response to chemotherapy and radiation. Mol Cancer. 2010; 9:305.
14. Das PM, Singal R. DNA methylation and cancer. J Clin Oncol. 2004; 22:4632–4642.
15. Sun B, Hu L, Luo ZY, Chen XP, Zhou HH, Zhang W. DNA methylation perspectives in the pathogenesis of autoimmune diseases. Clin Immunol. 2016; 164:21–27.
16. Nestler EJ, Pena CJ, Kundakovic M, Mitchell A, Akbarian S. Epigenetic Basis of Mental Illness. Neuroscientist. 2016; 22:447–463.
17. Zhong J, Agha G, Baccarelli AA. The Role of DNA Methylation in Cardiovascular Risk and Disease: Methodological Aspects, Study Design, and Data Analysis for Epidemiological Studies. Circ Res. 2016; 118:119–131.
18. Baba Y, Watanabe M, Baba H. Review of the alterations in DNA methylation in esophageal squamous cell carcinoma. Surg Today. 2013; 43:1355–1364.
19. Portela A, Esteller M. Epigenetic modifications and human disease. Nat Biotechnol. 2010; 28:1057–1068.
20. Wang J, Sasco AJ, Fu C, Xue H, Guo G, Hua Z, Zhou Q, Jiang Q, Xu B. Aberrant DNA methylation of P16, MGMT, and hMLH1 genes in combination with MTHFR C677T genetic polymorphism in esophageal squamous cell carcinoma. Cancer epidemiology, biomarkers & prevention. 2008; 17:118–125.
21. Ma K, Cao B, Guo M. The detective, prognostic, and predictive value of DNA methylation in human esophageal squamous cell carcinoma. Clin Epigenetics. 2016; 8:43.
22. Takahashi T, Matsuda Y, Yamashita S, Hattori N, Kushima R, Lee YC, Igaki H, Tachimori Y, Nagino M, Ushijima T. Estimation of the fraction of cancer cells in a tumor DNA sample using DNA methylation. PloS one. 2013; 8:e82302.
23. Ashktorab H, Daremipouran M, Goel A, Varma S, Leavitt R, Sun X, Brim H. DNA methylome profiling identifies novel methylated genes in African American patients with colorectal neoplasia. Epigenetics. 2014; 9:503–512.
24. Reis-Filho JS. Next-generation sequencing. Breast Cancer Res. 2009; 11:S12.
25. Sonnet M, Claus R, Becker N, Zucknick M, Petersen J, Lipka DB, Oakes CC, Andrulis M, Lier A, Milsom MD, Witte T, Gu L, Kim-Wanner SZ, et al. Early aberrant DNA methylation events in a mouse model of acute myeloid leukemia. Genome Med. 2014; 6:34.
26. Duhoux FP, Ameye G, Montano-Almendras CP, Bahloula K, Mozziconacci MJ, Laibe S, Wlodarska I, Michaux L, Talmant P, Richebourg S, Lippert E, Speleman F, Herens C, et al. PRDM16 (1p36) translocations define a distinct entity of myeloid malignancies with poor prognosis but may also occur in lymphoid malignancies. Br J Haematol. 2012; 156:76–88.
27. Tan SX, Hu RC, Liu JJ, Tan YL, Liu WE. Methylation of PRDM2, PRDM5 and PRDM16 genes in lung cancer cells. Int J Clin Exp Pathol. 2014; 7:2305–2311.
28. Cizkova M, Vacher S, Meseure D, Trassard M, Susini A, Mlcuchova D, Callens C, Rouleau E, Spyratos F, Lidereau R, Bieche I. PIK3R1 underexpression is an independent prognostic marker in breast cancer. BMC Cancer. 2013; 13:545.
29. Sen S, Bhattacharjee S, Mukhopadhyay I, Mandal P, Sharma S, Roy Chowdhury R, Sengupta S. Abstract 1056: Impact of host methylome on cervical cancer pathogenesis. Cancer Res. 2015; 75:1056–1056.
30. Kaz AM, Grady WM. Epigenetic biomarkers in esophageal cancer. Cancer Lett. 2014; 342:193–199.
31. Kishino T, Niwa T, Yamashita S, Takahashi T, Nakazato H, Nakajima T, Igaki H, Tachimori Y, Suzuki Y, Ushijima T. Integrated analysis of DNA methylation and mutations in esophageal squamous cell carcinoma. Mol Carcinog. 2016.
32. Byun DS, Lee MG, Chae KS, Ryu BG, Chi SG. Frequent epigenetic inactivation of RASSF1A by aberrant promoter hypermethylation in human gastric adenocarcinoma. Cancer Res. 2001; 61:7034–7038.
33. Lo KW, Kwong J, Hui AB, Chan SY, To KF, Chan AS, Chow LS, Teo PM, Johnson PJ, Huang DP. High frequency of promoter hypermethylation of RASSF1A in nasopharyngeal carcinoma. Cancer Res. 2001; 61:3877–3881.
34. Zhang Y, Jeltsch A. The application of next generation sequencing in DNA methylation analysis. Genes. 2010; 1:85–101.
35. Sham PC, Purcell SM. Statistical power and significance testing in large-scale genetic studies. Nat Rev Genet. 2014; 15:335–346.
36. Jahr S, Hentze H, Englisch S, Hardt D, Fackelmayer FO, Hesch RD, Knippers R. DNA fragments in the blood plasma of cancer patients: quantitations and evidence for their origin from apoptotic and necrotic cells. Cancer Res. 2001; 61:1659–1665.
37. Wang JM, Xu B, Hsieh CC, Jiang QW. Longitudinal trends of stomach cancer and esophageal cancer in Yangzhong County: a high-incidence rural area of China. European journal of gastroenterology & hepatology. 2005; 17:1339–1344.
38. Guo S, Yan F, Xu J, Bao Y, Zhu J, Wang X, Wu J, Li Y, Pu W, Liu Y, Jiang Z, Ma Y, Chen X, et al. Identification and validation of the methylation biomarkers of non-small cell lung cancer (NSCLC). Clin Epigenetics. 2015; 7:3.
39. Edgar RC. Search and clustering orders of magnitude faster than BLAST. Bioinformatics. 2010; 26:2460–2461.
40. Wu D, Tao J, Xu B, Li P, Lu Q, Zhang W. Downregulation of Dicer, a component of the microRNA machinery, in bladder cancer. Mol Med Rep. 2012; 5:695–699.
41. Su P, Zhang Q, Yang Q. Immunohistochemical analysis of Metadherin in proliferative and cancerous breast tissue. Diagn Pathol. 2010; 5:38.