
INTRODUCTION
TP53 mutations and dysfunction occur in more than half of all human cancer cases [1], and are independent markers of poor prognoses in some cancers [2]. In addition to mutations in TP53 itself, mutations in p53 pathway genes are significantly enriched in cancer [3]. Thus, the study of the p53 pathway and its interaction networks is a promising source of insight for discovering therapeutic targets for TP53-mutated cancers [4]. Although the associations of p53 dysfunction, p53 interaction networks, and oncogenesis have been widely explored [5], a systematic analysis of TP53 mutations and the related interaction networks in various types of human cancers is lacking. The Cancer Genome Atlas (TCGA) datasets cover 33 different cancer types and more than 10,000 cancer cases in total (https://gdc-portal.nci.nih.gov/). Each TCGA cancer type contains different types of “omics” data, including: whole exome (genome) sequencing; genomic DNA copy number arrays; DNA methylation; mRNA expression array and RNA-Seq data; microRNA sequencing; reverse-phase protein arrays; and clinical metadata. There have been a number of studies of genomic alterations across cancer types based on TCGA data [6–8]. However, few of them have focused on systematically exploring genomic alterations of TP53 and its related interaction networks across a number of different cancer types.
Some therapeutic strategies have been proposed to treat TP53-mutated cancers, such as restoring wild-type activity to; promoting the degradation of; or targeting pathways regulated by mutant p53 [9]. We have suggested a strategy of identifying synthetic lethality gene pairs involving TP53 for the development of a treatment for TP53-mutated cancers [10]. Two genes are synthetic lethal (SL) if dysfunction of either alone does not result in cell death, but dysfunction of both does [11]. Thus, the targeted disruption of a gene that is SL for TP53 should selectively kill cancer cells with somatic mutations in TP53, but spare normal TP53-wildtype cells. The large amount of cancer genomic data available in TCGA now enable us to identify potential SL genes for TP53.
In this study we explored genomic alterations of TP53 and its interaction networks by analyzing TCGA data across 33 human cancer types. We analyzed TP53 mutation and gene expression data to identify potential nodes in TP53 interaction networks, and performed survival analyses based on TP53 mutations and expression profiles across the 33 cancer types, respectively. We also identified potential SL genes for TP53 to find molecular targets for personalized therapy of TP53-mutated cancer patients.
RESULTS
TP53 mutations in cancer
We calculated TP53 mutation rates for 33 cancer types (Table 1). Almost one-third of cancer types have a TP53 mutation rate greater than 50%, and more than one-half have a rate greater than 30%. The two cancer types with the highest TP53 mutation rates affect women: uterine carcino-sarcoma (UCS) (91.2%) and ovarian serous cystadeno-carcinoma (OV) (83%). The other eight cancer types with a TP53 mutation rate that exceeds 50% include four gastro-intestinal cancers: esophageal carcinoma (ESCA), rectal adeno-carcinoma (READ), pancreatic adeno-carcinoma (PAAD) and colon adeno-carcinoma (COAD); two lung cancers: lung squamous-cell carcinoma (LUSC) and lung adeno-carcinoma (LUAD); and head-and-neck squamous-cell carcinoma (HNSC) and brain lower-grade glioma (LGG). For each cancer type, we ranked the affected genes in decreasing order of mutation rate (Supplementary Table S1). We found that TP53 has the highest mutation rate in six cancer types: UCS, OV, ESCA, LUSC, HNSC and sarcoma (SARC), and the second-highest mutation rate in seven other cancer types: READ, LUAD, LGG, bladder urothelial carcinoma (BLCA), stomach adeno-carcinoma (STAD), liver hepato-cellular carcinoma (LIHC), and breast-invasive carcinoma (BRCA). If we exclude the extremely long TTN gene, which has the highest mutation rate in eight cancer types, we find that TP53 has the highest mutation rate in ten cancer types, and is one of the top three genes with the highest mutation rate in 16 cancer types. These data confirm that TP53 is frequently mutated in a wide variety of cancer types.
Table 1: Mutation rates of TP53 in the 33 TCGA cancer types
Cancer type |
Full name |
Mutation rate (%)a |
Rankb |
|---|---|---|---|
UCS |
uterine carcino-sarcoma |
91.2 |
1 |
OV |
ovarian serous cystadeno-carcinoma |
83 |
1 |
ESCA |
esophageal carcinoma |
82.7 |
1 |
LUSC |
lung squamous-cell carcinoma |
82 |
1 |
READ |
rectum adeno-carcinoma |
79 |
2 |
HNSC |
head-and-neck squamous-cell carcinoma |
71.6 |
1 |
PAAD |
pancreatic adeno-carcinoma |
64.7 |
3 |
COAD |
colon adeno-carcinoma |
56 |
3 |
LUAD |
lung adeno-carcinoma |
54.2 |
2 |
LGG |
brain lower-grade glioma |
53.5 |
2 |
BLCA |
bladder urothelial carcinoma |
49.9 |
2 |
STAD |
stomach adeno-carcinoma |
47.5 |
2 |
SARC |
sarcoma |
36.1 |
1 |
KICH |
kidney chromophobe |
33.3 |
6 |
LIHC |
liver hepato-cellular carcinoma |
31.1 |
2 |
BRCA |
breast-invasive carcinoma |
30.9 |
2 |
UCEC |
uterine corpus endometrial carcinoma |
28.6 |
7 |
GBM |
glioblastoma multiforme |
23.4 |
6 |
ACC |
adrenocortical carcinoma |
20 |
70 |
SKCM |
skincutaneous melanoma |
15.3 |
459 |
PRAD |
prostate adeno-carcinoma |
12 |
4 |
CHOL |
cholangio-carcinoma |
11.1 |
49 |
DLBC |
lymphoid neoplasm diffuse large B-cell lymphoma |
10.4 |
248 |
LAML |
acute myeloid leukemia |
8.1 |
8 |
CESC |
cervical squamous-cell carcinoma and endocervical adeno-carcinoma |
4.5 |
347 |
THYM |
thymoma |
3.3 |
182 |
KIRP |
kidney renal papillary-cell carcinoma |
2.5 |
170 |
KIRC |
kidney renal clear-cell carcinoma |
2.4 |
152 |
TGCT |
testicular germ-cell tumors |
1.4 |
3280 |
THCA |
thyroid carcinoma |
0.8 |
624 |
PCPG |
pheochromocytoma and paraganglioma |
0.6 |
2938 |
UVM |
uveal melanoma |
0 |
NA |
aTP53 mutation rates are listed in decreasing order.
bThe rank of the TP53 mutation rate in the corresponding cancer type.
TP53 has a relatively low mutation rate in some cancer types, such as thymoma (THYM) (3.3%); kidney renal papillary-cell carcinoma (KIRP) (2.5%); kidney renal clear-cell carcinoma (KIRC) (2.4%); testicular germ-cell tumors (TGCT) (1.4%); thyroid carcinoma (THCA) (0.8%); pheochromocytoma and paraganglioma (PCPG) (0.6%); and uveal melanoma (UVM) (0%). However, most of these cancers are relatively rare. Surprisingly, there are marked differences in the TP53 mutation rates in cancers from the same organ but different cell types, e.g., in KIRP, KIRC, and kidney chromophobe (KICH), with rates of 2.5%, 2.4% and 33.3%, respectively.
TP53 mutations are comprised of eight classes: missense, nonsense, frame-shift deletion, frame-shift insertion, in-frame deletion, in-frame insertion, silent and splice-site. Figure 1 summarizes the proportion of each class of TP53 mutations in all 33 TCGA cancer types. The most frequent classes of TP53 mutations are missense (62%), nonsense (14%) and frame-shift deletions (9%). The proportions of each class of mutations in all of the TP53 mutations in each cancer type are listed in Supplementary Table S2. In general, nonsense mutations, frame-shift deletions, frame-shift insertions and splice-site mutations are all highly deleterious, and 34.5% of all TP53 mutations fall into one of these classes. In contrast, in-frame deletions, in-frame insertions, and silent mutations have comparatively much less deleterious effects, but only 3.5% of all TP53 mutations fall into one of these mutation classes. Since most TP53 missense mutations are deleterious [12], we can conclude that deleterious or altered-function mutations predominate among TP53 mutations discovered in cancers.
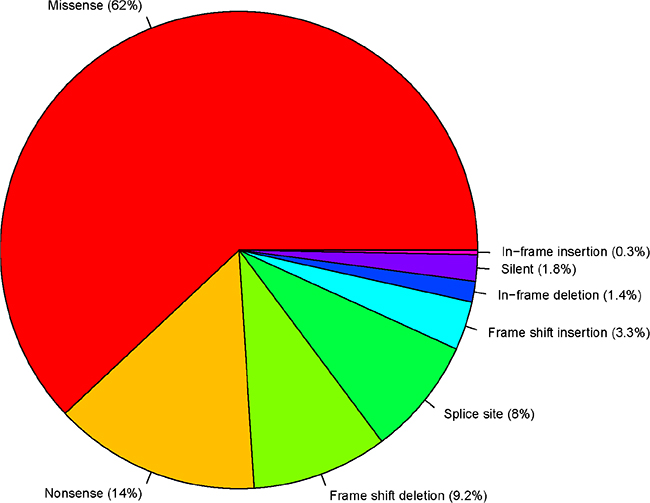
Figure 1: TP53 variant classification.
Genes with elevated expression levels in TP53-mutated cancers
Genes that are more highly expressed in TP53-mutated cancers compared to TP53-wildtype cancers
The most important function of p53 is to act as a transcription factor that directly or indirectly regulates thousands of other genes [13]. Upon exposure to stress stimuli such as DNA damage, hypoxia, or oncogene activation, p53 acts as a tumor suppressor by transcriptional repression of oncogenes [14]. Once mutations compromise p53’s transcriptional repression function, genes that are usually repressed by it should have elevated expression in TP53-mutated cancers compared to TP53-wildtype cancers or normal tissue. We identified genes potentially repressed by p53 by comparing gene expression levels in cancers with non-silent (functionally significant) TP53 mutations compared to TP53-wildtype cancers in the TCGA datasets. Genes that are highly expressed in TP53-mutated cancers compared to TP53-wildtype cancers were identified in 29 cancer types (four cancer types were excluded from the analysis due to their small numbers of TP53-mutated samples) and are listed in Supplementary Table S3 (fold change > 1.5, false discovery rate (FDR) < 0.05). We call these loci “TP53-MW” genes.
There are 48 TP53-MW genes identified in at least 10 different cancer types (Supplementary Table S4). Two of these genes (CDKN2A and KIF2C) were identified in 13 different cancer types, and 10 genes (DEPDC1, CENPF, CDC20, KIF14, CENPA, NUF2, ANLN, TTK, FAM72D and OIP5) in 12 different cancer types. The expression level of CDKN2A (cyclin-dependent kinase inhibitor 2A) in TP53-mutated cancers is higher than in TP53-wildtype cancers in 13 different cancer types: BLCA, BRCA, LIHC, LUAD, PAAD, SARC, SKCM, UCEC, COAD, GBM, LGG, STAD, and THYM. The CDKN2A gene encodes two proteins: p16INK4a and p14ARF, which both act as tumor suppressors by regulating the cell cycle [15]. p14ARF has been reported to activate p53 by promoting degradation of the product of the MDM2 proto-oncogene, which targets p53 [15]. Our results indicate that p53 may in turn inhibit CDKN2A such that loss of p53 function results in upregulation of CDKN2A. The expression level of another gene, KIF2C (kinesin family member 2C), is also higher in TP53-mutated cancers than in TP53-wildtype cancers in 13 different cancer types: BRCA, LIHC, LUAD, UCEC, KIRC, PAAD, ACC, PRAD, BLCA, SKCM, STAD, SARC and LGG. This gene encodes a kinesin-like protein that may regulate cellular senescence of human primary cells via a p53-dependent pathway [16]. A previous study has shown that KIF2C expression is significantly suppressed by p53 in breast cancer cells [17], a finding consistent with our results from the TCGA datasets (e.g., BRCA).
There are a total of 120 TP53-MW genes that are common to more than one-quarter of the 29 different cancer types (Figure 2 and Supplementary Table S3). These 120 genes encode 25 different classes of proteins (Figure 3). Of these, 18% encode nucleic-acid binding proteins, and the remainder encode various cytoskeletal proteins, hydrolases, transferases, receptors, transcription factors, signaling molecules, and enzyme modulators and kinases, indicating that p53 transcriptionally represses genes encoding many different classes of proteins. Eight members of this class of 120 TP53-MW genes encode protein kinases: AURKA, BUB1, BUB1B, CDK1, MELK, NEK2, PLK1 and TTK. The products of these eight genes are of particular interest as targets for the development of small-molecule kinase inhibitors, a strategy adopted by several cancer therapies [18]. Since TP53 mutations are not directly druggable, targeting druggable SL partners of TP53 may be a promising approach to the treatment of TP53-mutated cancers [10]. Network analysis of the gene set made up of TP53 and these eight kinase-encoding genes using IPA (Ingenuity Pathway Analysis) software shows that TP53 directly interacts with all of these genes, confirming the relevance of these identified genes to p53 (Figure 4). In fact, previous studies have revealed that all the eight kinase-encoding genes interact with TP53 [19–25].
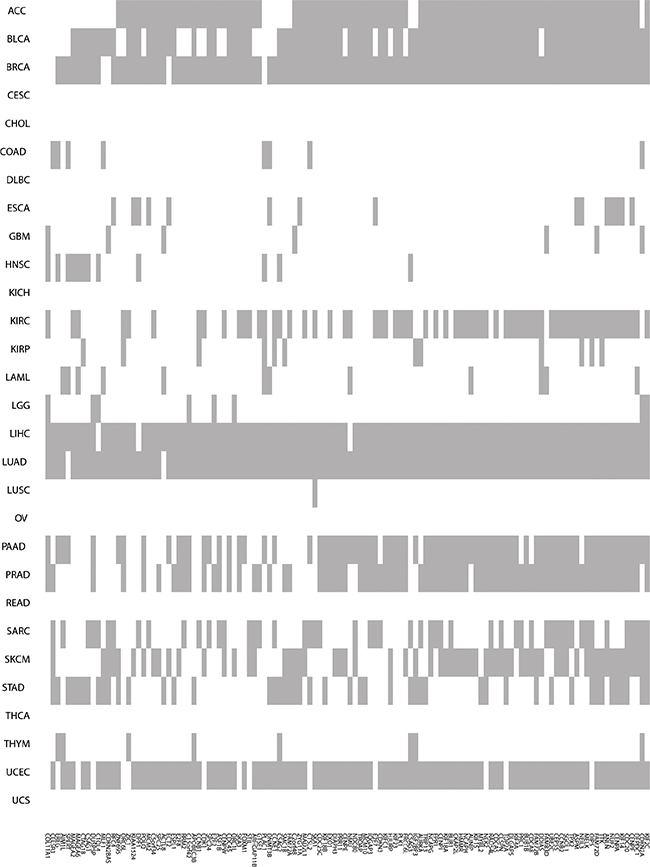
Figure 2: Higher-expression-level genes in TP53-mutated cancers compared to TP53-wildtype cancers. The grey color indicates that a gene is more highly expressed in TP53-mutated cancers and the white color indicates that it isn’t.
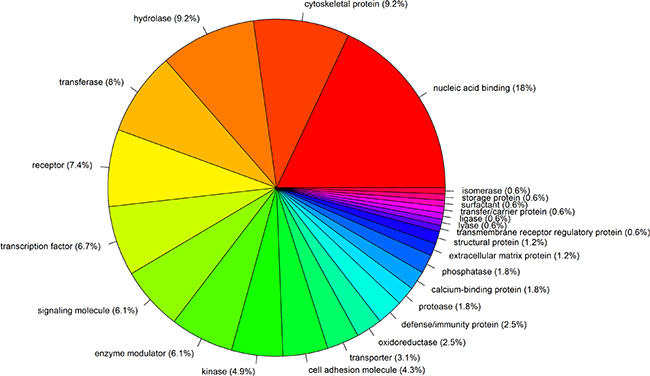
Figure 3: Protein classes of 120 genes that are more highly expressed in TP53-mutated cancers compared to TP53-wildtype cancers.
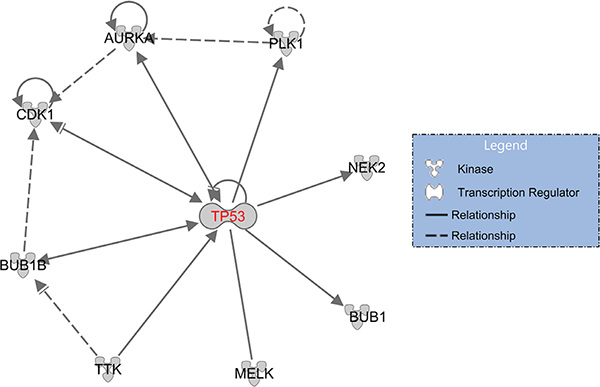
Figure 4: TP53 regulates or interacts with eight kinase-encoding genes. A solid line indicates a direct interaction, and a dashed line an indirect interaction; an arrow pointing from A to B indicates that A causes B to be activated, which includes any direct interaction, e.g., binding, phosphorylation, modification, etc.; an arrow ending with ““ pointing from A to B indicates that A causes B to be either activated or inhibited.
Using the PANTHER Classification System [26], we categorized the 120 TP53-MW genes into eight molecular function classes: binding (GO:0005488), catalytic activity (GO:0003824), channel regulator activity (GO:0016247), enzyme regulator activity (GO:0030234), nucleic acid binding transcription factor activity (GO:0001071), receptor activity (GO:0004872), structural molecule activity (GO:0005198), and transporter activity (GO:0005215). Most of the TP53-MW gene products are involved in binding and catalytic activity (> 70%), and the others are involved in nucleic-acid binding, transcription factor, receptor, structural molecule, transporter, enzyme regulator, and channel regulator activity (Supplementary Figure S1). Using Gene Set Enrichment Analysis (GSEA) software [27], we identified 75 canonical pathways significantly associated with this 120-gene set, as shown in Supplementary Table S5 (FDR < 0.05). Supplementary Table S5 shows that these gene products are significantly involved in p53-related pathways such as cell cycle [28], p53 signaling, DNA replication [29], PLK1 signaling [30], and Aurora A/B signaling [31].
Genes that are more highly expressed in TP53-mutated cancers compared to TP53-wildtype cancers, and also higher in TP53-wildtype cancers than in normal controls
Among the genes that are more highly expressed in TP53-mutated cancers than in TP53-wildtype cancers, there is an interesting subset whose expression is also higher in TP53-wildtype cancers than in normal tissue. We call these loci “TP53-MWN” genes. In other words, a TP53-MWN gene’s expression level follows this pattern: TP53-mutated cancers > TP53-wildtype cancers > normal controls. Thus a TP53-MWN gene has an elevated expression level in cancers relative to normal tissue, and further has an elevated expression in TP53-mutated cancers than in TP53-wildtype cancers, suggesting that TP53-MWN genes are oncogenic probably by the interaction of their expression products with p53.
To identify TP53-MWN genes, we first identified what we call “TP53-WN” genes, those with a higher expression level in TP53-wildtype cancers than in normal tissue (fold change > 1.5, FDR < 0.05) for 19 cancer types (14 cancer types were excluded from the analysis due to their small numbers or lack of normal samples). TP53-MWN genes are the intersection of the TP53-MW and TP53-WN gene sets (Supplementary Table S6). There are 130 TP53-MWN genes that are common to more than one-quarter of the 19 different cancer types (Supplementary Table S7). KEGG pathway analysis shows that these gene products are mostly involved in the cell cycle; the p53 signaling pathway; pathways in cancer and mismatch repair; and pathways that are specific for a number of different cancer types such as small-cell lung cancer, prostate cancer, bladder cancer, glioma, pancreatic cancer, melanoma, and chronic myeloid leukemia (FDR < 0.05; Supplementary Table S8).
Of the 130 TP53-MWN genes, 11 encode protein kinases: AURKA, AURKB, BUB1, BUB1B, CDK1, GSG2, MELK, NEK2, PLK1, PKMYT1 and TTK. In addition to the previously identified eight kinase-encoding TP53-MW genes, TP53-MWN genes include three more kinase genes: AURKB, GSG2, and PKMYT1, genes whose interactions with TP53 have already been documented [32–34]. Of these 11 kinase genes, TTK follows the TP53-MWN expression pattern in nine different cancer types: BLCA, BRCA, KIRC, KIRP, LIHC, LUAD, PRAD, STAD, and UCEC (Figure 5). TTK encodes a serine/threonine kinase that has been implicated in the regulation of centrosome duplication and mitotic checkpoint response, and plays a role in the stabilization and activation of p53 during spindle disruption [23] (Figure 4). Our results indicate that p53 may in turn inhibit TTK by a negative feedback loop, since TP53 mutations seem to cause the elevated expression of TTK.
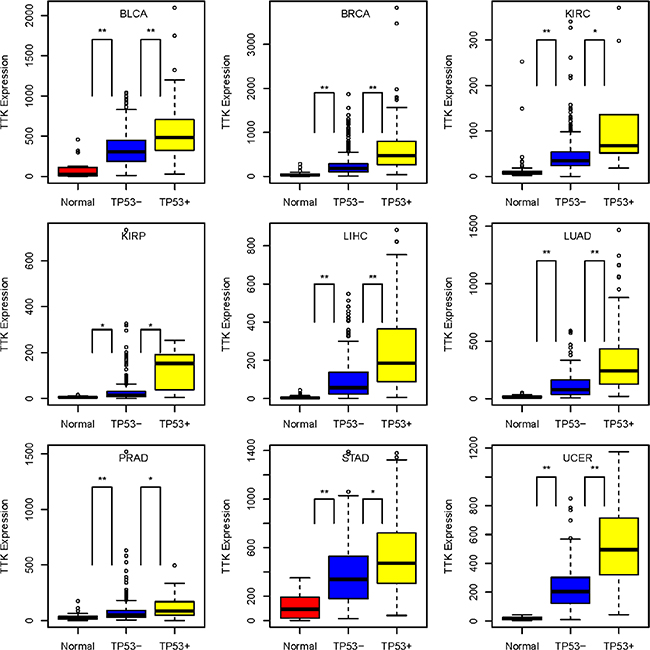
Figure 5: TTK gene expression level pattern: TP53-mutated cancers > TP53-wildtype cancers > normal controls, in nine cancer types. TP53+: TP53-mutated cancers; TP53−: TP53-wildtype cancers; *10−10 < P-value ≤ 0.001; **P-value ≤ 10–10.
Genes that are more highly expressed in TP53-mutated cancers compared to normal tissue
We also identified genes that are more highly expressed in TP53-mutated cancers compared to normal tissue, but that are not more highly expressed in TP53-wildtype cancers compared to normal tissue. We call these loci “TP53-MSN” genes. We are interested in these genes because the mechanism underlying the elevated expression of TP53-MSN genes could be specifically related to TP53 mutations. To identify TP53-MSN genes, we first identified genes with higher expression levels in TP53-mutated cancers than in normal tissue (fold change > 1.5, FDR < 0.05; we call these loci “TP53-MN” genes), and then identified genes with higher expression levels in TP53-wildtype cancers than in normal tissue (fold change > 1.2, FDR < 0.05; we call these loci “TP53-WN2” genes which obviously include the TP53-WN genes). TP53-MSN genes were obtained by subtraction of TP53-WN2 genes from the TP53-MN gene list (Supplementary Table S9). There are 27 TP53-MSN genes that are common to more than one-quarter of the 19 different cancer types (Supplementary Table S10). They encode a wide variety of proteins (Supplementary Figure S2), although more than 50% of them encode nucleic-acid binding proteins; transcription factors; and signaling or cell-adhesion molecules. Network analysis using STRING [35] shows that TP53 inhibits FOSL1, SPHK1, ICAM5, and MSLN. In addition, our results suggest that TP53 may also inhibit other TP53-MSN genes, and that TP53 mutations may contribute to their elevated expression in a number of different cancer types.
Correlation of TP53 mutation rate with clinical phenotypes
We compared the TP53 mutation rates among different clinical phenotypes of cancer patients including gender, race, tumor stage, size or direct extent of the primary tumor (T), lymph nodes (N), and metastasis (M) in 18 cancer types: ACC, BLCA, BRCA, CESC, CHOL, COAD, DLBC, ESCA, GBM, HNSC, KICH, KIRC, KIRP, LAML, LGG, LIHC, LUAD, and LUSC (Supplementary Table S11). We selected these clinical phenotypes and cancer types because there are relatively complete records of these clinical phenotypes in these 18 cancer types in the TCGA datasets. In DLBC the TP53 mutation rate is lower in male than female subjects (unadjusted P-value = 0.05, odds ratio = 0), while in LIHC the rate is higher in male than female subjects (unadjusted P-value = 0.0007, odds ratio = 2.4). The other cancer types show no significant differences in TP53 mutation rates between male and female subjects. For the race phenotype, only HNSC shows a significantly higher TP53 mutation rate in African-American than in White-American subjects (unadjusted P-value = 0.03, odds ratio = 2.48). We did not find significant differences in the TP53 mutation rates among different stages, T, N, or M status of tumor except that ACC shows a significantly higher TP53 mutation rate in large-size cancers (T3, T4) than small-size cancers (T1, T2) (unadjusted P-value = 0.04, odds ratio = 3.42). Since the phenotypes tumor stage, T, N, and M reflect the development or progress status of tumors, our results indicate that TP53 mutations are probably early events in tumorigenesis and drive its progression. This conclusion agrees with previous studies [36, 37].
TP53 mutations are associated with worse cancer outcome prognoses
We compared the overall survival (OS) time between TP53-mutated and TP53-wildtype cancers in 20 cancer types (13 cancer types were excluded from the analysis due to very few samples having both TP53 mutation and survival data). Kaplan-Meier survival curves (Figure 6) show that patients with TP53 mutations have significantly worse OS prognoses compared with those without TP53 mutations in seven cancer types: ACC, COAD, HNSC, KIRC, LAML, LUAD, and PAAD; however, they have better OS prognoses in GBM (log-rank test, unadjusted P-value < 0.05). We also compared the disease-free survival (DFS) time between TP53-mutated and TP53-wildtype cancers in 18 cancer types (15 cancer types were excluded due to very few samples having both TP53 mutation and recurrence data). Kaplan-Meier survival curves (Figure 6) show that patients with TP53 mutations have significantly worse DFS prognoses compared with those without TP53 mutations in three cancer types: ACC, PAAD, and UCEC (log-rank test, unadjusted P-value < 0.05). These results confirm that TP53 mutations lead to poor clinical outcomes in a number of cancers [38–40].
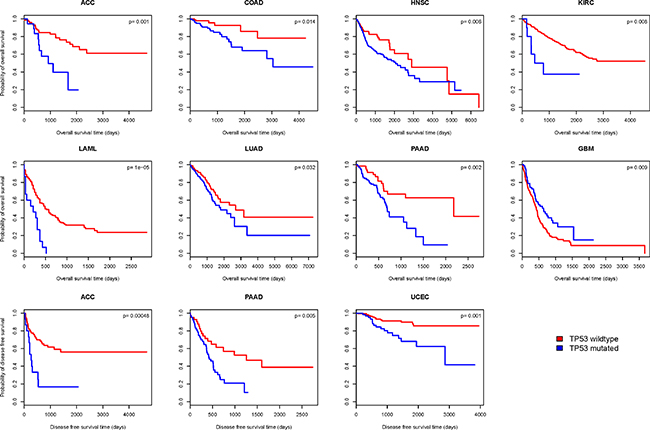
Figure 6: Kaplan–Meier survival curves show significant overall survival (OS) or disease-free survival (DFS) time differences between TP53-mutated and TP53-wildtype cancer patients (log-rank test, unadjusted P-value < 0.05).
TP53 gene expression in cancer
Identification of genes whose expression correlates with TP53 expression in cancer
We identified genes whose expression significantly correlates with TP53 expression in 21 cancer types with normal controls (Pearson product-moment correlation, FDR < 0.05). Supplementary Tables S12 and S13 list genes whose expression positively or negatively correlates with TP53 expression, respectively. Here we call loci whose expression levels positively or negatively correlate with TP53 expression levels as “TP53-PCOR” or “TP53-NCOR” genes, respectively. There are 61 TP53-PCOR and 2 TP53-NCOR genes identified in at least 10 of the 21 cancer types examined (Supplementary Tables S12, S13). Network analysis of the 61 TP53-PCOR genes by STRING [35] shows that TP53 directly interacts with GPS2, NCOR1, SENP3, KDM6B, EIF5A, EEF2, MAP2K4, CHD3 and COPS3, and indirectly interacts with a number of other genes via the hub nodes KDM6B and EEF2 (Figure 7). Gene set enrichment analysis (GSEA) shows that 44 of the 61 TP53-PCOR genes are located in the cytogenetic band (chr17p13) where TP53 is also located (FDR = 5.57*10–80), and that 9 others are located in cytogenetic band chr17p11 (FDR = 5.7*10−9). Thus, a total of 53 (or 87% of) TP53-PCOR genes are located in cytogenetic bands chr17p13,11 (Supplementary Table S14). In contrast, GSEA of 56 TP53-NCOR genes identified in at least one third of the 21 cancer types shows that except for four TP53-NCOR genes (YPEL5, EPT1, LCLAT1, and CLIP4) located in cytogenetic band chr2p23 (FDR = 0.003) and four (MAGEA6, MAGEA12, MAGEA2, and CSAG1) located in cytogenetic band chrxq28 (FDR = 0.015), no significant number of TP53-NCOR genes cluster in a cytogenetic band. This analysis reveals that in cancers, genes positively co-expressed with TP53 mainly cluster near the TP53 locus, while genes negatively co-expressed with TP53 are sparsely distributed over the genome, and can be found at locations that are very distant from TP53.
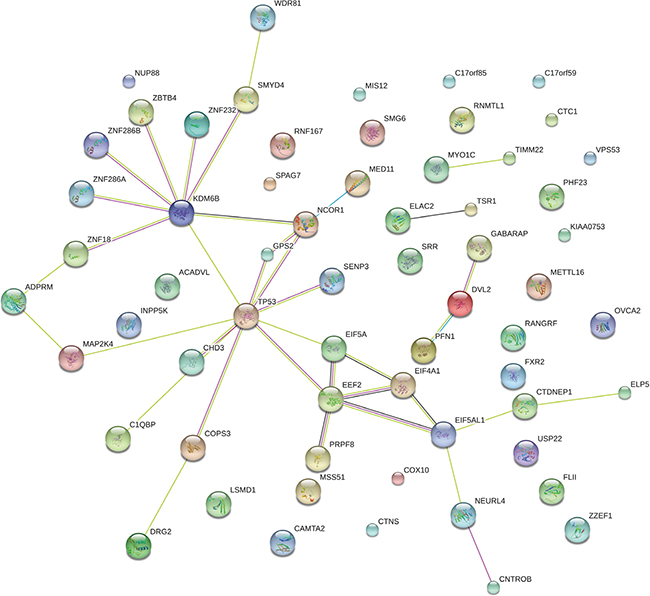
Figure 7: Network analysis of the 61 TP53-PCOR genes by STRING. A TP53-PCOR locus is a gene whose expression positively correlates with TP53 expression in cancers but not in normal tissue (Pearson product-moment correlation, FDR < 0.05).
Differential expression of TP53 among TP53-mutated cancers, TP53-wildtype cancers and normal tissue
We compared TP53 expression among TP53-mutated cancers, TP53-wildtype cancers and normal tissue, and identified cancers with significantly different expression of TP53 (P-value < 0.05). Table 2 shows that in 14 of 29 cancer types analyzed, TP53 expression is significantly lower in TP53-mutated compared to TP53-wildtype cancers. It makes sense that some TP53 mutations compromise p53 tumor suppressor function by reducing TP53 expression. However, TP53 expression is higher in TP53-mutated cancers than in normal tissue in some cancer types: GBM, KIRP and LUSC; whereas it is lower in some others such as LIHC, HNSC, KICH and PAAD. The explanation for these results could be that some TP53 mutations result in overexpression of mutant forms of TP53 while other mutations simply inactivate TP53 [12]. In 19 TCGA cancer types with at least four normal control samples we found that TP53 expression differed significantly between TP53-wildtype cancers and normal tissue in 11 cancer types. Interestingly, 10 of these 11 cancer types show elevated expression of TP53 in their TP53-wildtype subtype compared to normal controls. These results confirm that TP53 accumulation occurs in a number of cancers [41–43], and indicates that this accumulation is independent of TP53 mutations.
Table 2: Comparison of TP53 expression
TP53-mutated vs. TP53-wildtype cancer |
||
|---|---|---|
Cancer type |
P-value |
Fold changec |
SKCM |
7.12*10–22 |
2.14 |
LIHC |
1.08*10–9 |
1.64 |
HNSC |
5.07*10–8 |
1.61 |
LUAD |
6.95*10–8 |
1.34 |
BRCA |
2.15*10–6 |
1.22 |
PRAD |
3.32*10–5 |
1.32 |
UCEC |
0.0002 |
1.35 |
STAD |
0.0003 |
1.33 |
BLCA |
0.001 |
1.27 |
THCA |
0.002 |
1.46 |
DLBC |
0.007 |
2.1 |
KIRC |
0.017 |
1.24 |
ACC |
0.02 |
1.37 |
COAD |
0.045 |
1.23 |
TP53–mutated cancer vs. normal tissue |
||
Cancer type |
P–value |
Fold changed |
GBM |
3.23*10–8 |
5.7 |
LIHC |
0.001 |
0.64 |
KIRP |
0.002 |
1.75 |
HNSC |
0.002 |
0.66 |
LUSC |
0.007 |
1.41 |
KICH |
0.03 |
0.75 |
PAAD |
0.047 |
0.67 |
TP53–wildtype cancer vs. normal tissue |
||
Cancer type |
P–value |
Fold changee |
KIRC |
4.09*10–27 |
1.5 |
GBM |
7.42*10–18 |
6.63 |
KIRP |
1.31*10–17 |
1.83 |
THCA |
2.64E*10–15 |
1.3 |
LUAD |
4.22*10–10 |
1.52 |
CHOL |
2.44*10–6 |
2.47 |
STAD |
0.0004 |
1.54 |
COAD |
0.0005 |
1.49 |
KICH |
0.003 |
0.75 |
UCEC |
0.004 |
1.53 |
PRAD |
0.026 |
1.16 |
c Mean TP53 expression in TP53-wildtype cancers / mean TP53 expression in TP53-mutated cancers.
d Mean TP53 expression in TP53-mutated cancers / mean TP53 expression in normal tissue.
e Mean TP53 expression in TP53-wildtype cancers / mean TP53 expression in normal tissue.
We then divided TP53 mutations into truncating and non-truncating classes to observe their respective effects on TP53 expression. Truncating mutations include nonsense, frame-shift deletion, frame-shift insertion and splice-site, while non-truncating mutations include missense, in-frame deletion, and in-frame insertion (silent mutations were excluded from these analyses due to their minor effect on gene function). As expected, in 23 of 29 cancer types analyzed, TP53 expression is significantly lower in TP53-truncated cancers than in other TP53-mutated cancers, and in the other six cancer types TP53 expression does not significantly differ between them (P-value < 0.05, Supplementary Table S15). In 24 of the 29 cancer types, TP53 expression is significantly lower in TP53-truncated cancers than in TP53-wildtype cancers, and in the other five cancer types TP53 expression does not differ significantly between them (P-value < 0.05, Supplementary Table S16). In 14 of the 15 cancer types with both TP53-truncated cancers and normal samples to compare, TP53 expression is significantly lower in TP53-truncated cancers than in normal tissue, and in one cancer type TP53 expression does not differ significantly between them (P-value < 0.05, Supplementary Table S17). These results confirm that TP53-truncating mutations result in decreased TP53 expression most likely by causing TP53 mRNA decay [44, 45].
In contrast, TP53 non-truncating mutations may result in increased TP53 expression. Indeed, in nine of 31 cancer types analyzed, TP53 expression is significantly higher in TP53-mutated but TP53-non-truncating cancers than in TP53-wildtype cancers, and only in one cancer type is TP53 expression significantly lower in TP53-mutated but TP53-non-truncating cancers (P-value < 0.05, Supplementary Table S18). Also, in 11 of the 15 cancer types, TP53 expression is significantly higher in TP53-mutated but TP53-non-truncating cancers than in normal tissue, and in the other four cancer types TP53 expression does not differ significantly between them (P-value < 0.05, Supplementary Table S19). Interestingly, in eight cancer types (BRCA, LUSC, ESCA, SARC, OV, ACC, READ, and STAD), TP53 expression follows this pattern: TP53-mutated but TP53-non-truncating cancers > TP53-wildtype cancers > TP53-truncated cancers. In 11 cancer types (BRCA, LUAD, LUSC, GBM, COAD, ESCA, BLCA, READ, PRAD, UCEC and STAD), TP53 expression follows this pattern: TP53-mutated but TP53-non-truncating cancers > normal tissue > TP53-truncated cancers. Finally, in one cancer type (STAD), TP53 expression follows this pattern: TP53-mutated but TP53-non-truncating cancers > TP53-wildtype cancers > normal tissue > TP53-truncated cancers.
Association between TP53 gene expression levels and cancer prognosis
We compared OS and DFS between TP53 higher-expression-level and TP53 lower-expression-level cancers in 25 cancer types (eight cancer types were excluded from the analysis due to very few samples having both TP53 expression and survival data). Kaplan-Meier survival curves (Figure 8) show that patients with higher expression levels of TP53 have significantly worse OS prognoses than those with lower expression levels of TP53 in four cancer types (KIRC, KIRP, OV and UCS), but have better OS prognoses in STAD (log-rank test, unadjusted P-value < 0.05). Patients with higher expression levels of TP53 have significantly worse DFS prognoses than those with lower expression levels of TP53 in two cancer types (UCS and OV), but have better DFS prognoses in HNSC (log-rank test, unadjusted P-value < 0.05). In the four cancer types (KIRC, KIRP, OV and UCS) in which higher expression levels of TP53 are associated with significantly worse OS or DFS prognoses, TP53 only shows significantly different expression in TP53-wildtype cancers (where it is higher) compared to TP53-mutated cancers in KIRK. Since TP53-mutated KIRCs have a worse OS prognosis than TP53-wildtype KIRCs (Figure 6), TP53 lower-expression-level KIRCs should have a worse OS prognosis than TP53 higher-expression-level KIRCs if the association between TP53 expression and cancer prognosis correlates with TP53 mutation status. Therefore, the association between TP53 expression and cancer prognosis is unlikely to correlate with TP53 mutation status in KIRC, KIRP, OV and UCS. However, in STAD and HNSC, where patients with higher expression levels of TP53 have better OS or DFS prognoses than those with lower expression levels of TP53 (Figure 8), the association could be confounded by TP53 mutation status since TP53 shows significantly higher expression levels in TP53-wildtype cancers compared to TP53-mutated cancers in STAD and HNSC (Table 2), and TP53-wildtype cancers have better OS or DFS prognoses than TP53-mutated cancers in a number of cancer types including HNSC (Figure 6). In fact, when we compared OS and DFS prognoses between TP53 higher-expression-level and TP53 lower-expression-level TP53-wildtype cancers, we found no significant association between TP53 expression and cancer prognoses in either of these two cancer types. Thus, these results confirm that TP53 accumulation leads to poor clinical outcomes in cancer. This is in line with the results of previous studies [42, 46].
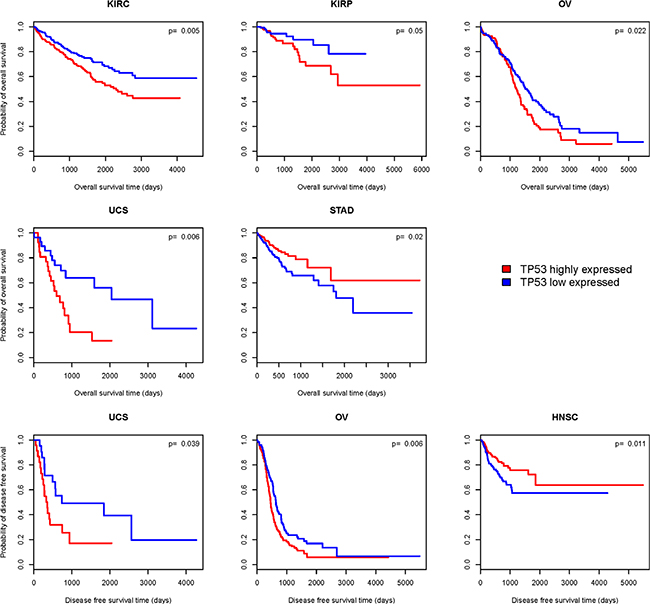
Figure 8: Kaplan–Meier survival curves show significant overall survival (OS) or disease-free survival (DFS) time differences between TP53 higher-expression-level and TP53 lower-expression-level cancer patients (log-rank test, unadjusted P-value < 0.05).
We then examined the effects of both TP53 mutation and expression status on patient survival (log-rank test, unadjusted P-value < 0.05). We found that TP53-mutated cancer patients with higher expression levels of TP53 have significantly worse OS prognoses than TP53-mutated cancer patients with lower expression levels of TP53 in ACC and UCS, and that the former category also have significantly worse DFS prognoses than the latter category in UCS. We also found that TP53-wildtype cancer patients with higher expression levels of TP53 also have significantly worse OS prognoses than TP53-wildtype cancer patients with lower expression levels of TP53 in KIRC, and that the former category also have significantly worse DFS prognoses than the latter category in BRCA. It was only in GBM that TP53-wildtype cancer patients with higher expression levels of TP53 have significantly better DFS prognoses than TP53-wildtype cancer patients with lower expression levels of TP53. These results again indicate that elevated TP53 expression is frequently associated with poor clinical outcomes in cancer.
Identify potential SL genes for TP53
The identification of druggable SL gene partners for TP53 may be an important approach to the treatment of TP53-mutated cancers, as mutant p53 is not directly druggable. To identify potential SL genes for TP53 we hypothesize that TP53 SL partners (oncogenes) are hyper-activated in TP53-mutated cancers compared to both TP53-wildtype cancers and normal tissue, as TP53-mutated cancer cells have to rely more heavily on TP53’s SL partners for survival than TP53-wildtype cancer cells or normal cells. We first examined the intersection of the TP53-MW and TP53-MSN gene lists for each of the relevant 19 cancer types described earlier (Supplementary Table S20; 14 cancer types were excluded from the analysis due to their small numbers or lack of normal samples). There are 1,863 such genes identified in at least one cancer type. Among the 1,863 potential SL genes for TP53, we are particularly interested in kinase-encoding genes because kinase inhibitors have been intensively investigated, and are a key class of anticancer drugs in clinical use or trials [18]. Table 3 lists 43 kinase-encoding genes in the 1,863 gene list. These kinase genes are mainly involved in p53 and cancer-related pathways: e.g., pathways in cancer, cell cycle, ERK signaling, MAPK signaling, TGF-β signaling, EGFR signaling, ErbB signaling, RAS signaling, axon guidance, focal adhesion, and the immune system. Table 3 shows that most of these kinases have clinically approved or investigational inhibitors or agonists. Among these kinase-encoding genes, CDK6 (cyclin-dependent kinase 6) has been validated as an SL partner with TP53 in a previous study [47]; and EPHB2 MST1R, NEK2, PAK6, PLK1, SPHK1, STK31, STYK1 and UCK2 have been predicted to be SL with TP53 in a computational biology study [10].
Table 3: The 43 kinase-encoding genes that are potentially synthetic lethal for TP53
Symbol |
Description |
Cancer typef |
Pathwayg |
Compoundh |
|---|---|---|---|---|
ACVR1C |
activin A receptor, type IC |
ESCA |
TGF-β signaling |
Adenosine triphosphate |
ALK |
anaplastic lymphoma receptor tyrosine kinase |
UCEC |
ERK signaling, MAPK signaling |
Crizotinib, Crenolanib |
ALPK2 |
alpha-kinase 2 |
UCEC |
NA |
NA |
BRDT |
bromodomain, testis-specific |
HNSC, LIHC |
NA |
Xd14 |
BRSK2 |
BR serine/threonine kinase 2 |
STAD |
LKB1 signaling |
ADP |
CAMKV |
CaM kinase-like vesicle-associated |
BRCA, STAD, UCEC |
EGFR signaling |
NA |
CDK6 |
cyclin-dependent kinase 6 |
HNSC |
Cell cycle, Pathways in cancer |
Flavopiridol, Palbociclib |
CIT |
citron (rho-interacting, serine/threonine kinase 21) |
ESCA, LIHC |
ERK signaling |
Cisplatin, Gemcitabine |
DAPK2 |
death-associated protein kinase 2 |
KIRC |
Pathways in cancer, Apoptosis |
ADP |
EGFR |
epidermal growth factor receptor |
HNSC |
EGFR signaling, ErbB signaling, RAS signaling |
Erlotinib, Gefitinib |
EIF2AK2 |
eukaryotic translation initiation factor 2-alpha kinase 2 |
UCEC |
Viral carcinogenesis, Immune system, EIF2 signaling |
Adenosine triphosphate |
EPHA2 |
EPH receptor A2 |
PAAD |
Ras signaling, PI3K-AKT signaling |
Dasatinib, Regorafenib |
EPHA8 |
EPH receptor A8 |
UCEC |
ERK signaling, |
Adenosine triphosphate |
EPHB2 |
EPH receptor B2 |
UCEC |
ERK signaling, |
Db04395 |
EPHB3 |
EPH receptor B3 |
BRCA |
ERK signaling, |
Adenosine triphosphate |
ERN2 |
endoplasmic reticulum to nucleus signaling 2 |
PAAD |
NA |
Adenosine diphosphate |
FGFR3 |
fibroblast growth factor receptor 3 |
STAD, UCEC |
Ras signaling, |
Masitinib, Ponatinib |
GUCY2C |
guanylate cyclase 2C (heat stable enterotoxin receptor) |
STAD |
Metabolism, |
Linaclotide |
HUNK |
hormonally up-regulated Neu-associated kinase |
COAD |
NA |
Adenosine triphosphate |
KIAA1804 |
mixed lineage kinase 4 |
UCEC |
NA |
NA |
KSR2 |
kinase suppressor of ras 2 |
LIHC, UCEC |
Ras signaling, |
Diglycerides Group |
LCK |
lymphocyte-specific protein tyrosine kinase |
BRCA |
Immune system, |
Dasatinib, Ponatinib |
MAP4K1 |
mitogen-activated protein kinase kinase kinase kinase 1 |
UCEC |
MAPK signaling, |
NA |
MAPK12 |
mitogen-activated protein kinase 12 |
HNSC |
MAPK signaling, |
Doramapimod |
MAPK15 |
mitogen-activated protein kinase 15 |
PRAD |
MAPK pathway, |
NA |
MAST1 |
microtubule associated serine/threonine kinase 1 |
UCEC |
NA |
Adenosine triphosphate |
MET |
met proto-oncogene (hepatocyte growth factor receptor) |
LUAD, PAAD |
Ras signaling, |
Crizotinib, Foretinib, Tivantinib |
MST1R |
macrophage stimulating 1 receptor (c-met-related tyrosine kinase) |
PAAD |
ERK signaling, |
Foretinib |
MYLK2 |
myosin light chain kinase 2 |
KIRC |
Focal adhesion, |
Prenylamine |
MYO3B |
myosin IIIB |
HNSC |
ERK signaling, |
Adenosine triphosphate |
NEK2 |
NIMA (never in mitosis gene a)-related kinase 2 |
PAAD |
Cell cycle, |
Adenosine triphosphate |
NEK3 |
NIMA (never in mitosis gene a)-related kinase 3 |
COAD |
Prolactin signaling |
Adenosine triphosphate |
PAK6 |
p21 protein (Cdc42/Rac)-activated kinase 6 |
STAD |
ErbB signaling, |
Guanosine triphosphate |
PKN1 |
protein kinase N1 |
UCEC |
cAMP signaling, |
Quercetin |
PLK1 |
polo-like kinase 1 |
PAAD |
Cell cycle, |
Gsk461364, Volasertib |
PTK6 |
PTK6 protein tyrosine kinase 6 |
PAAD |
Cell cycle, |
Vandetanib |
RET |
ret proto-oncogene |
HNSC |
Pathways in cancer, |
Sorafenib, Sunitinib, Imatinib, Vandetanib |
ROS1 |
c-ros oncogene 1 , receptor tyrosine kinase |
BLCA |
ERK signaling, |
Crizotinib, Ceritinib |
STK31 |
serine/threonine kinase 31 |
LIHC |
Sperm motility |
NA |
STYK1 |
serine/threonine/tyrosine kinase 1 |
PAAD |
Focal adhesion |
Adenosine triphosphate |
TTBK1 |
tau tubulin kinase 1 |
UCEC |
NA |
Adenosine triphosphate |
TYRO3 |
TYRO3 protein tyrosine kinase |
LIHC |
ERK signaling, |
BMS-777607 |
WNK3 |
WNK lysine deficient protein kinase 3 |
LUAD |
Ion channel transport |
Adenosine triphosphate |
f Cancer types in which the kinase gene has a potential synthetic lethality relationship with TP53.
g Pathways the kinase gene is related to.
h Compounds are kinase inhibitors or agonists that have been approved or under investigation currently.
*Data on Pathways and Compounds are from the GeneCards (www.genecards.org), KEGG (www.genome.jp/kegg/), REACTOME (www.reactome.org/), TARGET (www.broadinstitute.org/cancer/cga/target), and DGIdb (dgidb.genome.wustl.edu) databases.
To further validate these potential TP53 SL partners, we examined data from the Cancer Cell Line Project (http://www.cancerrxgene.org/). In a recent study [48], Iorio et al. identified a number of molecular markers of drug sensitivity using 265 compounds and pharmacogenomic screens in cancer cell lines. They found that TP53-mutated HNSCs are sensitive to the Rac GTPases inhibitor EHT 1864. Among the potential TP53 SL partners in HNSC (Supplementary Table S20), we found that PARVB and ARHGEF25 are associated with the activity of Rac GTPases. This demonstrates that PARVB and ARHGEF25 have synthetic lethality relationships with TP53 in HNSC. In addition, Iorio et al. found that TP53-mutated cancers are sensitive to the compounds Doxorubicin, Gemcitabine, Paclitaxel, Etoposide and 5-Fluorouracil. The targets of these compounds have been predicted to be TP53’s SL partners in this analysis, e.g., the genes CYP2D6, NQO1, XDH, ABCC1, ABCC2, ABCC6, SLC22A16, CIT, SLC28A3, MAP4, UGT1A1, DPYD and UPP1 (Supplementary Table S20).
Moreover, we compared IC50 (drug concentration that reduces viability by 50%) values between TP53-mutated and TP53-wildtype cancer cell lines for each of the 265 compounds mentioned above. We found that BI-2536, GW843682X, Epothilone B, Afatinib and Gefitinib have significantly lower IC50 values in TP53-mutated cancer cell lines than in TP53-wildtype cancer cell lines (P-value < 0.05, FDR < 0.2, Supplementary Table S21). This indicates that TP53-mutated cancer cell lines are more sensitive to these compounds than TP53-wildtype cancer cell lines. The higher sensitivity of TP53-mutated cancer cell lines to these compounds could be attributed to the SL interactions between the targets of these compounds and TP53. Actually, the compounds’ targets such as PLK1 and EGFR have been identified to be SL with TP53 by this method. Table 4 lists potential TP53’s SL partners that have supporting evidence provided by the Cancer Cell Line Project.
Table 4: The synthetic lethal genes with TP53 evidenced by the cancer cell line project
Symbol |
Description |
Compoundi |
Target pathwayj |
|---|---|---|---|
PARVB |
parvin, beta |
EHT 1864 |
cytoskeleton |
ARHGEF25 |
Rho guanine nucleotide exchange factor (GEF) 25 |
EHT 1864 |
cytoskeleton |
CYP2D6 |
cytochrome P450, family 2, subfamily D, polypeptide 6 |
Doxorubicin |
DNA replication |
NQO1 |
NAD(P)H dehydrogenase, quinone 1 |
Doxorubicin |
DNA replication |
XDH |
xanthine dehydrogenase |
Doxorubicin |
LKB1 signaling |
ABCC1 |
ATP-binding cassette, sub-family C (CFTR/MRP), member 1 |
Doxorubicin, |
DNA replication, cytoskeleton |
ABCC2 |
ATP-binding cassette, sub-family C (CFTR/MRP), member 2 |
Doxorubicin, |
DNA replication, cytoskeleton |
ABCC6 |
ATP-binding cassette, sub-family C (CFTR/MRP), member 6 |
Doxorubicin, |
DNA replication |
SLC22A16 |
solute carrier family 22 (organic cation/carnitine transporter), member 16 |
Doxorubicin |
DNA replication |
CIT |
citron rho-interacting serine/threonine kinase |
Gemcitabine |
DNA replication |
SLC28A3 |
solute carrier family 28 (concentrative nucleoside transporter), member 3 |
Gemcitabine |
DNA replication |
MAP4 |
microtubule-associated protein 4 |
Paclitaxel |
cytoskeleton |
UGT1A1 |
UDP glucuronosyltransferase 1 family, polypeptide A1 |
Etoposide |
DNA replication |
DPYD |
dihydropyrimidine dehydrogenase |
5-Fluorouracil |
DNA replication |
UPP1 |
uridine phosphorylase 1 |
5-Fluorouracil |
DNA replication |
PLK1 |
polo-like kinase 1 |
BI-2536, GW843682X |
mitosis |
EGFR |
epidermal growth factor receptor |
Afatinib, Gefitinib |
EGFR signaling |
MAST1 |
microtubule associated serine/threonine kinase 1 |
Epothilone B |
cytoskeleton |
TUBA4A |
tubulin, alpha 4a |
Epothilone B |
cytoskeleton |
TUBA8 |
tubulin, alpha 8 |
Epothilone B |
cytoskeleton |
iCompounds and their targets data are from the Cancer Cell Line Project (www.cancerrxgene.org/) and DrugBank (www.drugbank.ca/).
jThe target pathway data are from the Cancer Cell Line Project (www.cancerrxgene.org/).
DISCUSSION
In our study we performed extensive analyses of TP53 mutation, gene expression, and clinical data from 33 TCGA cancer type-specific datasets. We identified potential TP53 interaction networks, the association between patient survival and TP53 mutation or gene expression status, and potential druggable SL partners of TP53.
When comparing TP53 expression levels among TP53-mutated (truncating mutations and non-truncating mutations) cancers, TP53-wildtype cancers and normal tissue, we found that TP53 expression is consistently lower in TP53-truncated cancers compared to other cancers or normal tissue, while TP53 expression is often higher in TP53-mutated but TP53-non-truncating cancers compared to other cancers or normal tissue. This indicates that TP53-truncating mutations reduce TP53 expression but some non-truncating mutations are capable of increasing it. However, we did not find significant survival time (OS or DFS) differences between TP53-truncated and TP53-mutated but TP53-non-truncated classes of cancer patients, indicating that both types of TP53 mutations are equally deleterious and lead to poor clinical outcomes. Interestingly, TP53 expression is almost always elevated in TP53-wildtype cancers compared to normal controls in a number of cancer types. This indicates that p53 often accumulates in cancers, and that this accumulation could be stimulated by stress responses in cancer cells regardless of TP53 mutation status. Furthermore, survival analyses suggest that p53 accumulation leads to poor clinical outcomes in many types of cancers.
Druggable SL gene partners for TP53 may yield insights into the personalized treatment of patients with TP53-mutated cancers, as p53 mutants are not directly druggable. A successful example of applying the synthetic lethality approach is the targeting of cancers with dysfunction of the breast-cancer susceptibility genes 1 and 2 (BRCA1 and BRCA2) by poly(adenosine diphosphate [ADP]–ribose) polymerase (PARP) inhibitors [49]. In the present study, we identified potential TP53 SL partners based on the hypothesis that they should be overexpressed in TP53-mutated cancers compared to both TP53-wildtype cancers and normal tissue. Moreover, we validated some of the SL interactions by exploring the pharmacogenomic data from the Cancer Cell Line Project. One interesting finding is that there are five compounds to which TP53-mutated cancer cell lines are more sensitive than TP53-wildtype cancer cell lines, whereas there are many more (73) compounds to which TP53-wildtype cancer cell lines are more sensitive than TP53-mutated cancer cell lines (Supplementary Table S21). This implies that TP53-mutated cancers may have fewer treatment options and their proliferation is more difficult to control than TP53-wildtype cancers. Druggable TP53 SL partners that are kinase-encoding genes are of particular interest. We identified 43 kinase-encoding genes that are potentially SL to TP53. Although these SL interactions need to be validated by experimental investigation, they represent a promising direction for future studies.
MATERIALS AND METHODS
Materials
We downloaded RNA-Seq gene expression data (Level 3), gene somatic mutation data (Level 2), and clinical data for all of the 33 cancer types for which data are available from the TCGA data portal (https://gdc-portal.nci.nih.gov/). For survival analyses we used clinical data from FireBrowse (http://gdac.broadinstitute.org/). We obtained pharmacogenomic data from the Cancer Cell Line Project (http://www.cancerrxgene.org/). The pharmacogenomic data cover 265 screened compounds and their targets, and include cancer cell lines’ drug response, drug sensitivity, and somatic mutation data.
Class comparison to identify differentially-expressed genes
We normalized TCGA RNA-Seq gene expression data by base-2 log transformation. We identified differentially expressed genes between two classes of samples using Student’s t test. To adjust for multiple tests, we calculated adjusted P-values (FDR) for t test P-values. The FDR was estimated using the method of Benjami and Hochberg [50]. We used the threshold of FDR < 0.05 and mean gene-expression fold-change > 1.5 to identify the differentially expressed genes. In comparisons of TP53 expression, we used the threshold of P-value < 0.05.
Comparison of the TP53 mutation rates among different clinical phenotypes
We compared the TP53 mutation rates among different clinical phenotypes of cancer patients using Fisher’s Exact Test. Each phenotype was divided into two classes: gender (male vs. female); race (African-American vs. White-American); tumor stage (early stage (Stage I-II) vs. late stage (Stage III-IV)); tumor size (T) (small size (T1-2) vs. large size (T3-4)); lymph nodes (N) (without regional lymph nodes (N0) vs. with lymph nodes (N1-3); metastasis (M) (no metastasis (M0) vs. metastasis (M1)). A threshold of P-value < 0.05 was used to evaluate the significance of differences in the TP53 mutation rates between two classes of phenotypes.
Expression correlation analysis
We identified genes whose expression significantly correlates with TP53 expression in cancers, but does not correlate with TP53 expression in normal tissue, by Pearson product-moment correlation analysis. Again, the FDR was used to adjust the P-value by the method of Benjami and Hochberg [50]. A threshold of FDR < 0.05 was used to evaluate the significance of expression correlations.
Gene-set enrichment analysis
We categorized the sets of genes we identified into different molecular function classes or protein classes by the PANTHER Classification System [26]. We performed pathway analysis of the gene sets using KEGG (www.genome.jp/kegg/), REACTOME (www.reactome.org/) and the GSEA tool (http://software.broadinstitute.org/gsea/msigdb/). We carried out network analysis of gene sets using the Ingenuity Pathway Analysis tool (IPA, Ingenuity® Systems, www.ingenuity.com) and STRING [35].
Survival analyses
We performed survival analyses of TCGA patients based on TP53 mutation data and TP53 gene expression data, respectively. Kaplan-Meier survival curves were used to show the survival (overall survival or disease-free survival) differences between TP53-mutated cancer patients and TP53-wildtype cancer patients, and between TP53 higher-expression-level patients and TP53 lower-expression-level patients. TP53 higher-expression-level and lower-expression-level patients were determined by the median values of TP53 expression. If the TP53 expression level in a patient was higher than the median value, the patient was classified as TP53 higher-expression-level; otherwise as TP53 lower-expression-level. We used the log-rank test to calculate the significance of survival-time differences between two classes of patients with a threshold of P-value < 0.05.
Identification of potential SL genes for TP53
We first identified the set of genes whose expression is significantly higher in TP53-mutated cancers than in TP53-wildtype cancers (Student’s t test, FDR < 0.05, fold change > 1.5), and then identified the set of genes whose expression is significantly higher in TP53-mutated cancers than in normal tissue (Student’s t test, FDR < 0.05, fold change > 1.5), but not significantly higher in TP53-wildtype cancers than in normal tissue (Student’s t test, FDR < 0.05, fold change > 1.2). We identified potential SL genes for TP53 from the intersection of these two gene sets. To identify genes whose elevated expression is specifically related to TP53-mutated cancers, we believe that it is necessary to exclude as many genes as possible whose expression is significantly higher in TP53-wildtype cancers than in normal tissue. Therefore, we used a lower fold-change threshold of > 1.2 instead of > 1.5.
Comparison of drug sensitivity between TP53-mutated and TP53-wildtype cancer cell lines
We compared IC50 values between TP53-mutated and TP53-wildtype cancer cell lines for compounds using Student’s t test. We identified the compounds to which TP53-mutated and TP53-wildtype cancer cell lines have significantly different IC50 values using a threshold of P-value < 0.05.
ACKNOWLEDGMENTS
We thank Dr. Robert Boissy from the University of Nebraska Medical Center for editing the manuscript.
CONFLICTS OF INTEREST
The authors declare no conflicts of interest.
GRANT SUPPORT
This work was supported by startup funds awarded to XW by the China Pharmaceutical University.
Authors’ contributions
XW conceived of and designed the research, performed data analyses, and wrote the manuscript. QS performed data analyses. Both authors read and approved the final manuscript.
REFERENCES
1. Hollstein M, Sidransky D, Vogelstein B, Harris CC. p53 mutations in human cancers. Science. 1991; 253:49–53.
2. Petitjean A, Achatz MI, Borresen-Dale AL, Hainaut P, Olivier M. TP53 mutations in human cancers: functional selection and impact on cancer prognosis and outcomes. Oncogene. 2007; 26:2157–2165.
3. Stracquadanio G, Wang X, Wallace MD, Grawenda AM, Zhang P, Hewitt J, Zeron-Medina J, Castro-Giner F, Tomlinson IP, Goding CR, Cygan KJ, Fairbrother WG, Thomas LF, et al. The importance of p53 pathway genetics in inherited and somatic cancer genomes. Nature reviews Cancer. 2016; 16:251–265.
4. Khoo KH, Verma CS, Lane DP. Drugging the p53 pathway: understanding the route to clinical efficacy. Nature reviews Drug discovery. 2014; 13:217–236.
5. Levine AJ, Oren M. The first 30 years of p53: growing ever more complex. Nat Rev Cancer. 2009; 9:749–758.
6. Zack TI, Schumacher SE, Carter SL, Cherniack AD, Saksena G, Tabak B, Lawrence MS, Zhsng CZ, Wala J, Mermel CH, Sougnez C, Gabriel SB, Hernandez B, et al. Pan-cancer patterns of somatic copy number alteration. Nat Genet. 2013; 45:1134–1140.
7. Kandoth C, McLellan MD, Vandin F, Ye K, Niu B, Lu C, Xie M, Zhang Q, McMichael JF, Wyczalkowski MA, Leiserson MD, Miller CA, Welch JS, et al. Mutational landscape and significance across 12 major cancer types. Nature. 2013; 502:333–339.
8. Cancer Genome Atlas Research N, Weinstein JN, Collisson EA, Mills GB, Shaw KR, Ozenberger BA, Ellrott K, Shmulevich I, Sander C, Stuart JM. The Cancer Genome Atlas Pan-Cancer analysis project. Nat Genet. 2013; 45:1113–1120.
9. Muller PA, Vousden KH. Mutant p53 in cancer: new functions and therapeutic opportunities. Cancer Cell. 2014; 25:304–317.
10. Wang X, Simon R. Identification of potential synthetic lethal genes to p53 using a computational biology approach. BMC medical genomics. 2013; 6:30.
11. Kaelin WG, Jr. The concept of synthetic lethality in the context of anticancer therapy. Nat Rev Cancer. 2005; 5:689–698.
12. Petitjean A, Mathe E, Kato S, Ishioka C, Tavtigian SV, Hainaut P, Olivier M. Impact of mutant p53 functional properties on TP53 mutation patterns and tumor phenotype: lessons from recent developments in the IARC TP53 database. Human mutation. 2007; 28:622–629.
13. Beckerman R, Prives C. Transcriptional regulation by p53. Cold Spring Harbor perspectives in biology. 2010; 2:a000935.
14. Ho J, Benchimol S. Transcriptional repression mediated by the p53 tumour suppressor. Cell death and differentiation. 2003; 10:404–408.
15. Zhang Y, Xiong Y, Yarbrough WG. ARF promotes MDM2 degradation and stabilizes p53: ARF-INK4a locus deletion impairs both the Rb and p53 tumor suppression pathways. Cell. 1998; 92:725–734.
16. Gwon MR, Cho JH, Kim JR. Mitotic centromere-associated kinase (MCAK/Kif2C) regulates cellular senescence in human primary cells through a p53-dependent pathway. FEBS letters. 2012; 586:4148–4156.
17. Shimo A, Tanikawa C, Nishidate T, Lin ML, Matsuda K, Park JH, Ueki T, Ohta T, Hirata K, Fukuda M, Nakamura Y, Katagiri T. Involvement of kinesin family member 2C/mitotic centromere-associated kinesin overexpression in mammary carcinogenesis. Cancer science. 2008; 99:62–70.
18. Gharwan H, Groninger H. Kinase inhibitors and monoclonal antibodies in oncology: clinical implications. Nature reviews Clinical oncology. 2016; 13:209–227.
19. Hsueh KW, Fu SL, Chang CB, Chang YL, Lin CH. A novel Aurora-A-mediated phosphorylation of p53 inhibits its interaction with MDM2. Biochimica et biophysica acta. 2013; 1834:508–515.
20. Beeharry N, Yen TJ. p53-dependent apoptosis in response to spindle damage is linked to loss of Bub1. Cancer biology & therapy. 2009; 8:645–647.
21. Degenhardt Y, Greshock J, Laquerre S, Gilmartin AG, Jing J, Richter M, Zhang X, Bleam M, Halsey W, Hughes A, Moy C, Liu-Sullivan N, Powers S, et al. Sensitivity of cancer cells to Plk1 inhibitor GSK461364A is associated with loss of p53 function and chromosome instability. Molecular cancer therapeutics. 2010; 9:2079–2089.
22. Ganguly R, Mohyeldin A, Thiel J, Kornblum HI, Beullens M, Nakano I. MELK-a conserved kinase: functions, signaling, cancer, and controversy. Clinical and translational medicine. 2015; 4:11.
23. Huang YF, Chang MD, Shieh SY. TTK/hMps1 mediates the p53-dependent postmitotic checkpoint by phosphorylating p53 at Thr18. Molecular and cellular biology. 2009; 29:2935–2944.
24. Oikawa T, Okuda M, Ma Z, Goorha R, Tsujimoto H, Inokuma H, Fukasawa K. Transcriptional control of BubR1 by p53 and suppression of centrosome amplification by BubR1. Molecular and cellular biology. 2005; 25:4046–4061.
25. Spurgers KB, Gold DL, Coombes KR, Bohnenstiehl NL, Mullins B, Meyn RE, Logothetis CJ, McDonnell TJ. Identification of cell cycle regulatory genes as principal targets of p53-mediated transcriptional repression. The Journal of biological chemistry. 2006; 281:25134–25142.
26. Mi H, Muruganujan A, Casagrande JT, Thomas PD. Large-scale gene function analysis with the PANTHER classification system. Nature protocols. 2013; 8:1551–1566.
27. Subramanian A, Tamayo P, Mootha VK, Mukherjee S, Ebert BL, Gillette MA, Paulovich A, Pomeroy SL, Golub TR, Lander ES, Mesirov JP. Gene set enrichment analysis: a knowledge-based approach for interpreting genome-wide expression profiles. Proceedings of the National Academy of Sciences of the United States of America. 2005; 102:15545–15550.
28. Chen J. The Cell-Cycle Arrest and Apoptotic Functions of p53 in Tumor Initiation and Progression. Cold Spring Harbor perspectives in medicine. 2016; 6.
29. Ho CC, Siu WY, Lau A, Chan WM, Arooz T, Poon RY. Stalled replication induces p53 accumulation through distinct mechanisms from DNA damage checkpoint pathways. Cancer research. 2006; 66:2233–2241.
30. McKenzie L, King S, Marcar L, Nicol S, Dias SS, Schumm K, Robertson P, Bourdon JC, Perkins N, Fuller-Pace F, Meek DW. p53-dependent repression of polo-like kinase-1 (PLK1). Cell cycle. 2010; 9:4200–4212.
31. Dauch D, Rudalska R, Cossa G, Nault JC, Kang TW, Wuestefeld T, Hohmeyer A, Imbeaud S, Yevsa T, Hoenicke L, Pantsar T, Bozko P, Malek NP, et al. A MYC-aurora kinase A protein complex represents an actionable drug target in p53-altered liver cancer. Nature medicine. 2016.
32. Marxer M, Ma HT, Man WY, Poon RY. p53 deficiency enhances mitotic arrest and slippage induced by pharmacological inhibition of Aurora kinases. Oncogene. 2014; 33:3550–3560.
33. Passer BJ, Nancy-Portebois V, Amzallag N, Prieur S, Cans C, Roborel de Climens A, Fiucci G, Bouvard V, Tuynder M, Susini L, Morchoisne S, Crible V, Lespagnol A, et al. The p53-inducible TSAP6 gene product regulates apoptosis and the cell cycle and interacts with Nix and the Myt1 kinase. Proceedings of the National Academy of Sciences of the United States of America. 2003; 100:2284–2289.
34. Zhang Z, Wang Y, Yao R, Li J, Lubet RA, You M. p53 Transgenic mice are highly susceptible to 4-nitroquinoline-1-oxide-induced oral cancer. Molecular cancer research. 2006; 4:401–410.
35. Franceschini A, Szklarczyk D, Frankild S, Kuhn M, Simonovic M, Roth A, Lin J, Minguez P, Bork P, von Mering C, Jensen LJ. STRING v9.1: protein-protein interaction networks, with increased coverage and integration. Nucleic Acids Res. 2013; 41:D808–815.
36. Bernardini MQ, Baba T, Lee PS, Barnett JC, Sfakianos GP, Secord AA, Murphy SK, Iversen E, Marks JR, Berchuck A. Expression signatures of TP53 mutations in serous ovarian cancers. BMC Cancer. 2010; 10:237.
37. Leitao MM, Soslow RA, Baergen RN, Olvera N, Arroyo C, Boyd J. Mutation and expression of the TP53 gene in early stage epithelial ovarian carcinoma. Gynecologic oncology. 2004; 93:301–306.
38. Xiang JF, Wang WQ, Liu L, Xu HX, Wu CT, Yang JX, Qi ZH, Wang YQ, Xu J, Liu C, Long J, Ni QX, Li M , et al. Mutant p53 determines pancreatic cancer poor prognosis to pancreatectomy through upregulation of cavin-1 in patients with preoperative serum CA19–9 >/= 1,000 U/mL. Scientific reports. 2016; 6:19222.
39. Rao B, Gao Y, Huang J, Gao X, Fu X, Huang M, Yao J, Wang J, Li W, Zhang J, Liu H, Wang L, Wang J. Mutations of p53 and K-ras correlate TF expression in human colorectal carcinomas: TF downregulation as a marker of poor prognosis. International journal of colorectal disease. 2011; 26:593–601.
40. Kim MC, Choi JE, Lee SJ, Bae YK. Coexistent Loss of the Expressions of BRCA1 and p53 Predicts Poor Prognosis in Triple-Negative Breast Cancer. Ann Surg Oncol. 2016.
41. Rubio MP, von Deimling A, Yandell DW, Wiestler OD, Gusella JF, Louis DN. Accumulation of wild type p53 protein in human astrocytomas. Cancer Res. 1993; 53:3465–3467.
42. Thor AD, Moore DH, II, Edgerton SM, Kawasaki ES, Reihsaus E, Lynch HT, Marcus JN, Schwartz L, Chen LC, Mayall BH, et al. Accumulation of p53 tumor suppressor gene protein: an independent marker of prognosis in breast cancers. J Natl Cancer Inst. 1992; 84:845–855.
43. Gnjatic S, Cai Z, Viguier M, Chouaib S, Guillet JG, Choppin J. Accumulation of the p53 protein allows recognition by human CTL of a wild-type p53 epitope presented by breast carcinomas and melanomas. J Immunol. 1998; 160:328–333.
44. Anczukow O, Ware MD, Buisson M, Zetoune AB, Stoppa-Lyonnet D, Sinilnikova OM, Mazoyer S. Does the nonsense-mediated mRNA decay mechanism prevent the synthesis of truncated BRCA1, CHK2, and p53 proteins? Human mutation. 2008; 29:65–73.
45. Gardner LB. Nonsense-mediated RNA decay regulation by cellular stress: implications for tumorigenesis. Molecular cancer research. 2010; 8:295–308.
46. Mattioni M, Soddu S, Prodosmo A, Visca P, Conti S, Alessandrini G, Facciolo F, Strigari L. Prognostic role of serum p53 antibodies in lung cancer. BMC Cancer. 2015; 15:148.
47. Wang X, Zhang Y, Han ZG, He KY. Malignancy of Cancers and Synthetic Lethal Interactions Associated With Mutations of Cancer Driver Genes. Medicine. 2016; 95:e2697.
48. Iorio F, Knijnenburg TA, Vis DJ, Bignell GR, Menden MP, Schubert M, Aben N, Goncalves E, Barthorpe S, Lightfoot H, Cokelaer T, Greninger P, van Dyk E, et al. A Landscape of Pharmacogenomic Interactions in Cancer. Cell. 2016; 166:740–754.
49. McLornan DP, List A, Mufti GJ. Applying synthetic lethality for the selective targeting of cancer. N Engl J Med. 2014; 371:1725–1735.
50. Benjami Y, Hochberg Y. Controlling the false discovery rate: a practical and powerful approach to multiple testing. Journal of the Royal Statistical Society B. 1995; 57:289–300.