
INTRODUCTION
Non-small cell lung cancer (NSCLC) accounts for 85% of lung cancers and adenocarcinoma is the predominant histologic subtype of lung cancer. Early-stage lung adenocarcinoma shows broad spectrum of prognosis, and moreover, reported low survival rates in a substantial proportion of patients [1–3]. Reflecting the histologic heterogeneity of lung adenocarcinoma, there is an increasing body of evidence that sublobar resection may achieve oncologic outcomes similar to those of lobectomy in early-stage NSCLC [4], although some studies have reported the contradictory result that postoperative adjuvant chemotherapy improves the prognosis even in operable early-stage NSCLC [5].
Radiomics is an ongoing field of research that enables us to obtain additional information from standard medical images using computational post-processing techniques. In an effort to enable more accurate molecular and genetic profiling of tumors, many studies have been performed with the aim of predicting treatment response and, furthermore, accomplish a step toward personalized medicine. Al-Kadi et al. showed that computed tomography (CT) features with texture analysis can be helpful in differentiating aggressive from nonaggressive NSCLC [6], and Kido et al. showed differences between histologic subtypes of peripheral bronchogenic carcinoma using textural parameters on CT [7]. Accordingly, we might expect radiomics to provide noninvasive analysis of lung adenocarcinoma and allow more effective evaluation of tumor aggressiveness based on tumor grade.
Therefore, the purpose of our study was to evaluate the usefulness of surrogate biomarkers as predictors of histopathologic tumor grade with radiomics data obtained from dual energy CT (DECT), with the ultimate aim of patient stratification for optimal treatment.
RESULTS
Correlation between pathologic stage and other pathologic features
Among stage 1A tumors, 6/72 (8%) were grade 3 with mainly micropapillary or solid subtype. The extent of invasion showed a positive correlation with pathologic stage (P < 0.01). In particular, the extent of invasion in stage 1A was 12.9 ± 7.6, which was significantly lower than that of stage 1B, 2A, and 2B. Tumor cellularity in all pathologic stages was 46.7 to 60.0 without significant difference among stages 1A through 2B. The relationships between pathologic stage and pathologic features are shown in the Supplementary Table S1.
Correlation between imaging parameters and pathology
Table 1 shows comparisons of all CT and PET parameters according to three pathologic tumor grades. A significant difference in various parameters including SUVmax, size, and density of the nodule was found among tumors of different pathologic grade (all P < 0.01). A multinomial logistic regression analysis with the stepwise variable selection procedure was performed for significant factors according to the univariate analysis, and two CT factors, i-uniformity and 97.5th percentile CT attenuation value, were shown to be independent significant factors to stratify the three grades. On multivariate analysis, there was no variable showing multicollinearity (VIF. 10) on VIF analysis; thus, no variable was removed from the multivariate analysis for that reason. As shown in Table 2, i-uniformity was a significant factor in stratifying grade 2 from grade 1 (OR = 0.037 and P < 0.01), and 97.5th percentile CT attenuation value was a significant factor in stratifying grade 2 from grade 1 (OR = 1.006 and P < 0.01) and grade 3 from grade 1 (OR = 1.041 and P = 0.02).
Table 1: Characteristics of early-stage lung adenocarcinoma according to histologic tumor grade
Variables |
Grade 1 (n = 19) |
Grade 2 (n = 65) |
Grade 3 (n = 7) |
P |
|---|---|---|---|---|
Age (y) |
57.8 ± 8.9 |
58.9 ± 9.0 |
57.6 ± 4.2 |
0.82 |
Male:female ratio** |
12 : 7 |
26 : 39 |
6 : 1 |
0.49 |
Smoking habits |
0.93 |
|||
Ever/Never |
10/9 |
19/46 |
6/1 |
|
PET parameter |
||||
SUVmax |
0.44 ± 0.46 |
3.1 ± 2.67 |
5.44 ± 3.84 |
< 0.01* |
CT parameters |
||||
Solidity |
< 0.01* |
|||
Non-solid (n = 39) |
16 |
23 |
0 |
|
Part-solid (n = 22) |
1 |
19 |
2 |
|
Solid (n = 30) |
2 |
23 |
5 |
|
Physical Factors |
||||
Size in lung setting (mm) |
15.58 ± 7.76 |
25.15 ± 11.59 |
22.57 ± 9.54 |
0.28 |
Size in mediastinal setting (mm) |
2.68 ± 6.90 |
13.57 ± 13.11 |
19.86 ± 11.19 |
< 0.01* |
Volume (cm3) |
2.20 ± 2.91 |
6.88 ± 10.28 |
7.14 ± 9.80 |
0.76 |
Density |
0.41 ± 0.17 |
0.72 ± 0.21 |
0.82 ± 0.21 |
< 0.01* |
i-Density |
1.17 ± 0.02 |
1.03 ± 0.39 |
0.83 ± 0.55 |
< 0.01* |
g-Density |
1.88 ± 0.17 |
1.54 ± 0.22 |
1.43 ± 0.20 |
< 0.01* |
Mass (g) |
0.83 ± 1.12 |
5.23 ± 7.37 |
6.31 ± 8.64 |
0.79 |
i-Mass (g) |
2.10 ± 2.58 |
5.38 ± 7.90 |
7.07 ± 10.77 |
0.29 |
g-Mass |
3.79 ± 5.53 |
9.39 ± 17.20 |
10.22 ± 13.24 |
0.37 |
Histogram analysis |
||||
Skewness |
0.41 ± 0.66 |
–0.67 ± 1.01 |
–1.17 ± 0.48 |
< 0.01* |
i-Skewness |
1.19 ± 1.48 |
0.29 ± 0.71 |
–0.20 ± 0.40 |
0.02* |
g-Skewness |
–0.31 ± 0.60 |
0.52 ± 0.79 |
0.98 ± 0.83 |
< 0.01* |
Kurtosis |
3.37 ± 1.83 |
4.04 ± 4.43 |
3.36 ± 2.05 |
0.02* |
i-Kurtosis |
8.17 ± 8.36 |
4.13 ± 2.88 |
2.88 ± 1.70 |
< 0.01* |
g-Kurtosis |
3.15 ± 1.71 |
3.77 ± 2.60 |
3.85 ± 1.83 |
< 0.01* |
75th percentile (HU) |
–496 ± 192 |
–175 ± 210 |
43.3 ± 133 |
< 0.01* |
i-75th percentile (HU) |
66.1 ± 25.1 |
75.7 ± 33.7 |
50.0 ± 27.1 |
< 0.01* |
g-75th percentile |
734 ± 119 |
471 ± 205 |
379 ± 218 |
< 0.01* |
97.5th percentile (HU) |
–329 ± 171 |
–49.3 ± 151 |
67.8 ± 45.5 |
0.01* |
i-97.5th percentile (HU) |
135.7 ± 25.2 |
134 ± 58.5 |
76.0 ± 61.5 |
< 0.01* |
g-97.5th percentile |
838 ± 55.9 |
687 ± 182 |
780 ± 103 |
< 0.01* |
Texture analysis |
||||
Uniformity |
0.0046 ± 0.0034 |
0.0028 ± 0.0019 |
0.0020 ± 0.0031 |
0.08 |
i-Uniformity |
0.0134 ± 0.0046 |
0.0071 ± 0.0047 |
0.0061 ± 0.0046 |
< 0.01* |
g-Uniformity |
0.0057 ± 0.0039 |
0.0031 ± 0.0017 |
0.0031 ± 0.0018 |
0.48 |
Entropy |
8.26 ± 0.91 |
8.85 ± 1.26 |
7.99 ± 2.71 |
0.10 |
i-Entropy |
6.64 ± 0.49 |
6.38 ± 2.39 |
5.13 ± 3.42 |
< 0.01* |
g-Entropy |
7.95 ± 0.99 |
8.78 ± 0.68 |
8.86 ± 0.83 |
0.40 |
Gradient-variability |
||||
g-Intensity-variability |
7.42 ± 3.84 |
7.97 ± 4.28 |
9.00 ± 2.41 |
0.08 |
g-Size-zone-variability |
8.97 ± 8.18 |
15.7 ± 12.5 |
18.4 ± 13.9 |
0.59 |
Note. Classified according to the International Multidisciplinary Lung Adenocarcinoma Classification system.
Unless otherwise indicated, data are means ± standard deviation.
*P < 0.05.
Table 2: Multinomial logistic regression analysis for stratifying three pathologic tumor grades
Imaging variable |
OR (95% CI) |
P value |
|---|---|---|
i-Uniformity |
||
Grade 1 |
1 |
|
Grade 2 |
0.037 (0.003–0.419) |
< 0.01** |
Grade 3 |
0.110 (0.006–1.887) |
0.13 |
97.5th percentile (HU) |
||
Grade 1 |
1 |
|
Grade 2 |
1.006 (1.002–1.010) |
< 0.01** |
Grade 3 |
1.041 (1.006–1.077) |
0.02* |
Note. CI = confidence interval.
*P < 0.05.
**P < 0.01.
Predictive probability of quantitative CT parameters for stratifying tumor grades
Finally, we used leave-one-out CV procedure to evaluate the accuracy of prediction of pathologic grade and we constructed ROC curves and calculated AUC. (Table 3 and Figure 1). The AUC value calculated from leave-one-out CV for discriminating grade 1 from the other grades was 0.9307 (95% CI: 0.8514–1), which was the highest among the three ROC curves. The AUC for discriminating grade 2 from the other grades was 0.8610 (95% CI: 0.7547–0.9672) and the AUC for discriminating grade 3 was 0.8394 (95% CI: 0.7045–0.9743).
Table 3: Predictive probability of quantitative CT parameters for stratifying tumor grades
Pathologic grade |
Sensitivity (%) |
Specificity (%) |
PPV (%) |
NPV (%) |
|---|---|---|---|---|
Grade 1 |
75.0 (0.500–0.938)* |
96.3 (0.909–1.000)* |
85.7 (0.688–1.000)* |
93.0 (0.871–0.982)* |
Grade 2 |
96.0 (0.900–1.000)* |
57.1 (0.381–0.762)* |
84.2 (0.783–0.909)* |
85.7 (0.688–1.000)* |
Grade 3 |
0 |
100 (1.000–1.000)* |
0 |
93.0 (0.930–0.930)* |
Note. PPV = positive prediction value, NPV = negative prediction value.
*Data in parentheses are the confidence interval.
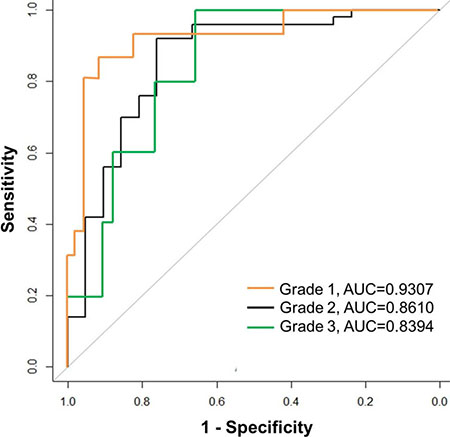
Figure 1: Receiver operating characteristic (ROC) curves for prediction of pathologic grade based on significant imaging parameters. The AUC calculated from leave-one-out CV for discriminating grade 1 from the other grades was 0.9307, which was the highest among three ROC curves. The AUC was 0.8610 for discriminating grade 2 and 0.8394 for discriminating grade 3.
DISCUSSION
Radiomics is an emerging field that converts medical imaging data of a tumor to quantitative biomarkers by the application of advanced computational methodologies [8, 9]. Quantitative imaging features that are extracted from the defined tumor region include descriptors of intensity distribution, spatial relationships between the various intensity levels, and texture heterogeneity patterns [10]. For example, Win et al. [11] reported that CT-derived tumor textural heterogeneity and PET-derived textural heterogeneity were independent predictors of survival. In a radiomics analysis of 440 features extracted from CT data of patients with lung or head-and-neck cancer, [8] a large number of radiomics features were proven to have prognostic power. The data of this study by Aertz et al. [8] suggested that by capturing intratumoral heterogeneity, which is associated with underlying gene expression patterns, radiomics identifies a general prognostic phenotype existing in both lung and head-and-neck cancer. Therefore, radiomics features are expected to have the potential to capture intratumoral heterogeneity and, furthermore, the distinct phenotypic differences of tumors, and have been proven to have prognostic power with clinical significance [8, 10–13].
The prognostic impact of pathologic invasiveness and the need to predict pathologic invasiveness have been described in many studies. Histologic subtypes defined by IASLC/ATS/ERS classification and other pathologic factors such as lymph node involvement and pleural and vessel invasion are known to show correlation with the survival outcome [14, 15]. Consequently, in the clinical setting accurate prediction of pathologic invasiveness may aid the decision for an appropriate operation type based on the status of the tumor. Major lung resection has been recommended as a standard procedure for the treatment of lung adenocarcinoma, but according to recent literature limited surgical resection could be used instead for cases of small-sized lung cancer [16–20]. Meanwhile, some studies have emphasized the importance of stratifying early-stage NSCLC patients to select candidates for adjuvant therapy [14, 15]. The presence of the micropapillary or solid subtype has been shown to be a poor prognostic factor for overall survival and for recurrence in patients with NSCLC [21, 22] and Travis et al. [21] suggested that micropapillary or solid predominant subtype predicts improved responsiveness to adjuvant chemotherapy compared with acinar or papillary predominant tumors in patients with surgically resected lung adenocarcinoma [23].
A major problem with assessing pathologic invasiveness and grade in lung adenocarcinomas has been that these features can be estimated using a whole tumor specimen from complete resection, but not using core biopsy or cytologic material [24–26]. Of course, there have been efforts to provide prognostic information using limited biopsy samples from lung cancer patients, but biopsy samples frequently contain limited amounts of cancer tissue. In fact, according to Coghlin et al., the mean percentage area of tumor in a biopsy sample was only 33.4% [27]. More importantly, our results indicated that tumor cellularity represented only 46.7 to 60.0% of the whole tumor volume. Moreover, the tumor area is not homogenous but tumors themselves are spatially and temporally heterogeneous, therefore complete evaluation of the tumor status is not easily achieved. In this situation radiomics, which can provide a comprehensive view of the entire tumor without invasive procedures, could be the key to achieve full evaluation of tumor status including tumor aggressiveness and also its prognostic power.
However, radiomics still has barriers to its implementation in clinical practice. According to Nyflot et al. [28], various imaging parameters such as acquisition noise, phantom size and reconstruction method show substantial influence on textural features. In addition, since the manual nodule segmentation is yet a gold standard, it suffers from significant inter-reader bias and low reproducibility [29]. To overcome the limitation of radiomics, variation of image acquisition, segmentation and analysis procedures should be minimized.
We aimed to determine the potential of radiomics data from DECT imaging metrics for tumor stratification compared with pathologic results from completely resected tumors. The DECT technique allows differentiation of an iodine substance from other materials by the material decomposition principle [30]. The real iodine component of the tumor can be measured on iodine-enhanced images of DECT and is comparable to the real value of the extent of enhancement [31]. Tumor angiogenesis, which leads to increased microvessel density, results in increased tumor perfusion and thus iodine enhancement [32, 33]. Therefore, the net iodine value obtained through DECT may reflect the level of underlying tumor angiogenesis [34]. On the other hand, a recent study demonstrated that the iodine-related attenuation of DECT in primary lung cancer correlates with the SUVmax of PET/CT because increased glucose metabolism, which is known to have an association with tumor perfusion, increases FDG uptake in PET [32]. These authors also showed that the iodine value could be added to conventional FDG PET/CT for more advanced tumor grading [32]. Overall, with radiomics values derived from DECT and PET/CT, tumor phenotyping with consideration of the tumor metabolism and perfusion could be established in our study.
Our study had several limitations. First, this study was performed at a single institution and therefore the patient population was relatively small. Especially, grade 3 group included only 7 tumors, which is very small and therefore it may have affected the reliability of our results. Further studies with large numbers of patients from multiple centers are needed to confirm the feasibility of DECT and its quantitative analysis for prediction of tumor grade and aggressiveness. Second, the pathologic tumor grades 1, 2, and 3 used in this study only reflect the most predominant subtype of the tumor, without consideration of the presence of other subtypes within the tumor. Future studies should be performed with consideration of tumor heterogeneity and the proportion of the histologic subtype, which can affect the prognosis. Third, potential disagreement between the pathologists in pathologic evaluation was present in this study. However, effort was made to minimize the disagreement since the pathologic assessment was the standard of reference in our study. Two pathologists reviewed the cases independently, followed by reaching consensus in a two-step order. In addition, digital miscroscope system was used to obtain objectivity of visual assessment.
In conclusion, quantification using preoperative DECT imaging metrics can help to predict pathologic aggressiveness based on tumor grade. Among various CT radiomics parameters obtained from DECT, i-uniformity and 97.5th percentile CT attenuation value were proved to be independent significant factors for predicting tumor grade by distinguishing grade 2 or 3 from grade 1.
MATERIALS AND METHODS
Patients
This study was performed as part of an ongoing prospective clinical trial that aimed to determine the value of biomarkers for the prognostic stratification in patients with early-stage lung adenocarcinoma at a single tertiary referral hospital (NCT01482585). This prospective study was approved by the institutional review board and written informed consent was obtained (No. SMC 2011-09-083).
Between October 2011 and May 2013, a total of 101 patients with stage I or II lung adenocarcinoma were prospectively enrolled. Inclusion criteria for our study were as follows: (1) Clinically and radiologically suspected lung adenocarcinoma, (2) Newly-diagnosed stage I or II disease from clinical work-up including F-18-fluorodeoxyglucose (FDG) positron emission tomography (PET)/CT, (3) Eastern Cooperative Oncology Group (ECOG) performance status of 0 or 1 who are eligible for surgery, (4) Age 20 years or older, (5) Able to tolerate DECT imaging as required per protocol, (6) Able to give study-specific informed consent. Exclusion criteria were (1) Prior malignancy, (2) Scheduled for definitive radiation therapy or neoadjuvant concurrent chemoradiation therapy, (3) Poor cardiopulmonary reserve (contraindication for surgery).
All 101 consecutive patients underwent DECT and FDG PET/CT for work-up. Among 101 enrolled patients, 3 patients who were proven to have benign disease after percutaneous biopsy of the lesion and 5 patients who were proven to have unresectable stage III or stage IV lung cancer through further studies were excluded. In addition, one patient who refused surgery was excluded. Overall, 92 patients underwent complete resection and 3 patients with benign disease, 8 patients with pathologic stage III or IV disease, and 1 patient with mucinous adenocarcinoma were additionally excluded. Further details are described in the Supplement. Finally, 80 patients with 91 stage I or II lung adenocarcinomas were included in our analysis (Figure 2). The clinicopathologic characteristics of the 80 patients and 91 lung adenocarcinomas included in this study are summarized in Table 4.
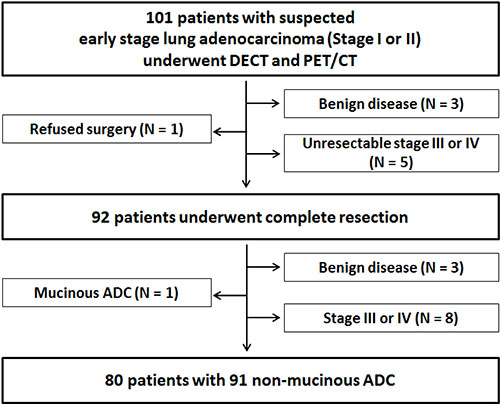
Figure 2: Flow chart of the study population. ADC = adenocarcinoma.
Table 4: Clinicopathologic characteristics of early-stage lung adenocarcinoma (91 tumors of 80 patients)
Characteristics |
Number of patients/nodules |
|---|---|
Gender (%) |
|
Male |
37 (46) |
Female |
43 (54) |
Median age (y) |
58 (35–76)* |
Smoking habits (%) |
|
Non-smoker |
50 (63) |
Current/former smoker |
30 (37) |
Type of operation† |
|
Segmentectomy |
27 (30) |
Lobectomy |
64 (70) |
p-T status† |
|
≤ 2 cm |
53 (58) |
>2 cm |
38 (42) |
p-N status |
|
N0 |
87 (96) |
N1 |
4 (4) |
Histopathology† |
|
AIS |
4 (5) |
MIA |
11 (12) |
Invasive adenocarcinoma |
76 (83) |
Lepidic predominant |
5 (7) |
Acinar/Papillary predominant |
64 (84) |
Micropapillary/Solid predominant |
7 (9) |
Pathologic stage |
|
1A |
72 (58) |
1B |
15 (21) |
2A |
3 (19) |
2B |
1 (2) |
Note. Unless otherwise indicated, data in parentheses are percentages.
AIS = adenocarcinoma in situ, MIA = minimally invasive adenocarcinoma.
*Data in parentheses are the range.
†Data are numbers of tumors (n = 91).
Imaging and Analysis
All patients underwent CT examination using a dual-source CT scanner (Somatom Definition Flash; Siemens Healthcare, Forchheim, Germany) with the dual-energy technique. The overview of dual-energy imaging is described in Figure 3. Three types of data set were generated from the DECT scanning: 80 kV, 140 kV, and enhanced weighted-average images. Further details of image parameters are described in the Supplement. PET/CT images were acquired using a Discovery STe scanner (GE Healthcare, Milwaukee, WI). Unenhanced CT was performed with 16-slice helical CT (140 keV, section width of 3.75 mm, 30–170 mA in AutomA mode) at 1 h after injection of 18F-FDG (5.0 MBq/kg) and emission scan was performed at 2.5 min per frame in 3D mode. PET images were reconstructed using a 3D ordered subsets expectation-maximization algorithm (voxel size, 3.9 × 3.9 × 3.3 mm3). The standardized uptake value (SUV) was calculated by correcting for the injected dose of 18F-FDG and body weight. Virtual non-enhanced images and iodine-enhanced images were generated using the liver Virtual Non-Contrast (VNC) application mode of dedicated dual-energy post-processing software (Syngo Dual Energy; Siemens Medical Solutions, Forchheim, Germany). To obtain the iodine value of both the solid and ground-glass opacity (GGO) component in each tumor, postprocessing was performed with two different types of software. Image data were reconstructed with a section thickness of 1 mm using a D30f (medium smooth) kernel for the iodine-enhanced image and a D45f (medium sharp) kernel for the virtual non-enhanced image.
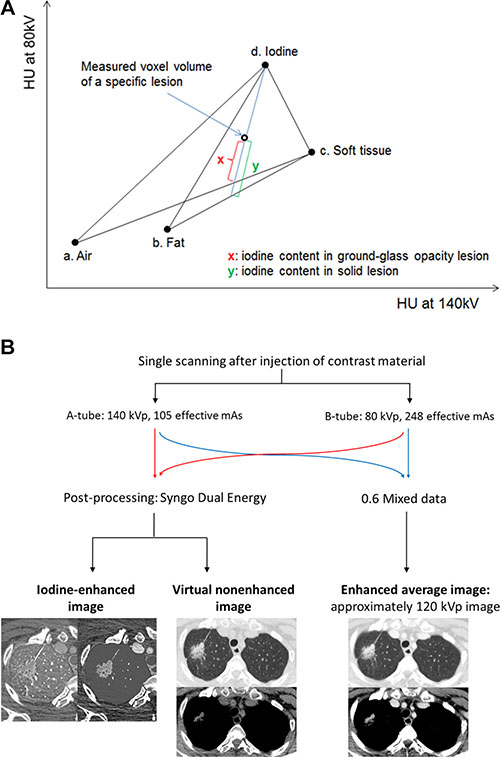
Figure 3: Overview of dual-energy imaging. (A) Diagram of three-material decomposition of voxel used by dual-energy software. (a), (b), (c), and (d) are fixed points of CT attenuation values from two different energies for air, fat, soft tissue, and iodine. Intercept x or y along iodine axis represents iodine content of voxel on this two-energy plot. (x) is the degree of enhancement of ground glass opacity nodule, whereas (y) is the degree of enhancement of solid nodule. (B) Three types of data sets were generated from the DECT scanning: the 80 kV, 140 kV, and enhanced weighted-average images. The weighted-average images were generated by combining the 140-kV and 80-kV data sets with a weighting factor of 0.6 (60% of the information derived from the 80 kV image and 40% derived from the 140 kV image) and these were approximately 120 kV images. The virtual non-enhanced images and iodine-enhanced images were made by using the liver Virtual Non- Contrast (VNC) application mode of dedicated dual-energy postprocessing software (Syngo Dual Energy; Siemens Medical Solutions, Forchheim, Germany).
CT scans were assessed for the type of nodule in terms of GGO nodule (GGN), part-solid nodule, or solid nodule. Nodule size in both the lung setting and mediastinal setting was evaluated manually.
The stability of various quantitative CT features with intra-observer reliability was evaluated through calculation of intra-class correlation coefficients (ICC) in 25 randomly selected patients [35]. The concordance correlation coefficient (CCC) was calculated for each feature using this test-retest image set. Features whose CCC is less than 0.8 were not considered reproducible and were excluded from our analysis. For nodule segmentation, tumors were segmented independently by two chest radiologists who were unaware of clinical and pathologic results by drawing a region of interest (ROI) covering as large an area of the whole tumor as possible. Quantitative CT analysis was performed based on physical, histogram-based, regional, and local features from the manually derived ROI. Histogram analysis was performed for assessment of tumor volume, tumor mass, density, skewness, kurtosis, and CT attenuation values at the 75th and 97.5th percentiles of Hounsfield units (HU). Texture parameters of uniformity, entropy, intensity variability, and size zone variability were also evaluated [36]. These CT parameters were evaluated on both non-contrast images and iodine contrast images.
Overall, the parameters analyzed include global parameters of solidity, size, volume, density, and mass of the tumor on CT, maximum standardized uptake value (SUVmax) on PET/CT, and all parameters obtained through histogram and texture analysis. We differentiated the CT parameters of the iodine map from those of non-contrast images by adding a lowercase “i” as a prefix. Gradient values of the CT parameters were also obtained, which represent the difference of the values obtained from non-contrast images and from the iodine map. These are indicated by the prefix “g”.
Pathologic evaluation
Each resected specimen (the entire tumor) was evaluated with standard pathologic methods as described in the surgical pathologic dissection manual of the Department of Pathology. All resected specimens were designated R0 (no residual tumor at the primary tumor site after surgical resection). For tumor sampling, an approximately 10-mm sample of tumor tissue from the entire tumor specimen was placed on a slide. All slides were scanned to produce a high-quality resolution digital image (0.25 lm/pixel at 40Å) using the Aperio Slide Scanning System (ScanScope T3; Aperio Technologies Inc., Vista, CA, USA). Two lung pathologists interpreted all tissue sections from virtual slides using ImageScope viewing software (Aperio Technologies, Inc.) and a high-resolution monitor [37]. For each case, the specimens were reviewed according to International Association for the Study of Lung Cancer (IASLC)/American Thoracic Society (ATS)/European Respiratory Society (ERS) International Multidisciplinary Lung Adenocarcinoma Classification criteria [38] and staged according to the seventh edition of the TNM classification for lung cancer. Comprehensive histologic subtyping was performed for the primary tumor in a semi-quantitative manner to the nearest 5% level, adding up to a total of 100% subtype components per tumor. The extent of the invasive component and tumor cellularity was measured and the most predominant subtype was recorded (Figure 4). When evaluating the predominant pattern, the central fibrosis area and its extent were disregarded. Next, the tumors were graded into 3 groups. Grade 1 included histologic subtypes of adenocarcinoma in situ (AIS), minimally invasive adenocarcinoma (MIA), and the lepidic pattern of invasive adenocarcinoma. Grade 2 corresponded to tumors that mainly showed acinar or papillary patterns and grade 3 corresponded to tumors that mainly showed micropapillary or solid patterns [21, 24, 26].
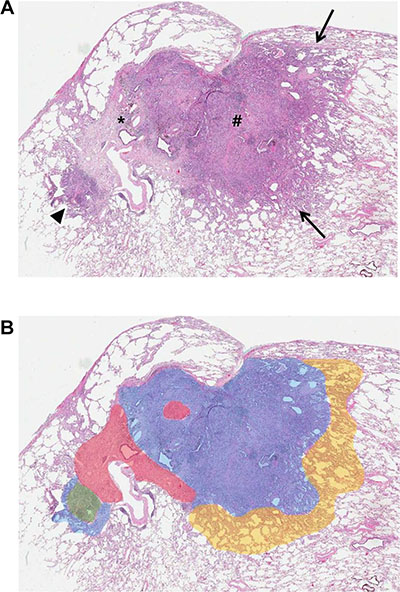
Figure 4: Lung adenocarcinoma in a 76-year-old woman. (A) Photomicrograph shows internal scar tissue (*), surrounding areas of acinar and papillary (#) adenocarcinoma patterns, and lepidic pattern (arrows) (hematoxylin-eosin stain; original magnification, x10). (B) Schematic of tumor components shows estimated percentages of grade 1 (yellow area, 5%), grade 2 (blue area, 60%), grade 3 (green area, 5%), and central fibrosis (red area, 15%).
Statistical analysis
Patient demographics and CT radiomics parameters were compared among the three different pathologic grades using one-way ANOVA with post hoc test of Bonferroni. A multinomial logistic regression model with the stepwise variable selection procedure using a 2-sided alpha of 5% as insertion and deletion criteria was used to predict three grades. In terms of variables for multivariate analysis, multicollinearity examination by using the variance inflation factor (VIF) was also performed. As for multiple nodules in a patient, we did not take into account within-patient correlation because each of them was considered as an independent synchronous lesion [39]. To evaluate the accuracy of the prediction of pathologic grade, we used leave-one-out cross-validation (CV) procedure and we constructed ROC curves plotting sensitivity versus 1-specificity, and calculated the area under the ROC curve (AUC), a measure of predictive power. Statistical analyses were performed using SAS version 9.4 (SAS Institute, Cary, NC, USA) and R 3.0.3 (Vienna, Austria; http://www.R-project.org). A P value less than 0.05 was considered to indicate a statistically significant difference.
The sample size calculation was based on the previous study by Sica et al. entitled “A Grading System of Lung Adenocarcinomas Based on Histologic Pattern is Predictive of Disease Recurrence in Stage I Tumors [24]. According to that report, the accuracy of finally selected grading system for concordance probability estimate was 0.65 (95% confidence interval 0.57–0.73) (p). The necessary sample size was calculated as follows: N = 4(Zcrit)2p(1- p)/D2, with a 90 % confidence interval (CI) of ± 10% (ie, Zcrit = 1.960) and where D = total width of the expected CI, that is, 0.20. Under these conditions, Power analysis indicated that a minimum sample size of 70 patients with lung adenocarcinoma.
Abbreviations
AIS = Adenocarcinoma in situ; AUC = Area under the receiver operating characteristic curve; CT = Computed tomography; DECT = Dual-energy computed tomography; FDG = Fluorodeoxyglucose; GGN = Ground-glass opacity nodule; GGO = Ground-glass opacity; HU = Hounsfield unit; MIA = Minimally invasive adenocarcinoma; NSCLC = Non-small cell lung cancer; PET = Positron emission tomography; ROC= Receiver operating characteristic; ROI = Region of interest; SUVmax = Maximum standardized uptake value; VNC = Virtual non-contrast.
ACKNOWLEDGMENTS
Author contributions: Dr. Ho Yun Lee had full access to all of the data in the study and takes responsibility for the integrity of the data and the accuracy of the data analysis.
Dr. Jung Min Bae contributed to the study design, data collection, statistical analyses, and manuscript writing.
Dr. Ho Yun Lee contributed to the study design, data collection, statistical analyses, and manuscript writing.
Dr. Ji Yun Jeong contributed to the study design, data collection, and manuscript writing.
Mr. Insuk Sohn contributed to the study design, statistical analyses, and manuscript writing.
Ms. Hye Seung Kim contributed to the study design, statistical analyses, and manuscript writing.
Dr. Ji Ye Son contributed to the study design, data collection, and manuscript writing.
Dr. O Jung Kwon contributed to the clinical review of cases and editing of the manuscript.
Dr. Joon Young Choi contributed to the clinical review of cases and editing of the manuscript.
Dr. Kyung Soo Lee contributed to the clinical review of cases and editing of the manuscript.
Dr. Young Mog Shim contributed to the clinical review of cases and editing of the manuscript.
CONFLICTS OF INTEREST
All authors contributed to the research, writing and preparation of this manuscript. None of the authors has a potential conflict of interest or financial relationship to disclose.
GRANT SUPPORT
This study has received funding through grants from the Korean Foundation for Cancer Research (KFCR-CB-2011-02-02).
REFERENCES
1. Zhang J, Wu J, Tan Q, Zhu L, Gao W. Why do pathological stage IA lung adenocarcinomas vary from prognosis?: a clinicopathologic study of 176 patients with pathological stage IA lung adenocarcinoma based on the IASLC/ATS/ERS classification. J Thorac Oncol. 2013; 8:1196–1202.
2. Maeda R, Yoshida J, Ishii G, Hishida T, Nishimura M, Nagai K. Prognostic impact of histology on early-stage non-small cell lung cancer. Chest. 2011; 140:135–145.
3. Shedden K, Taylor JM, Enkemann SA, Tsao MS, Yeatman TJ, Gerald WL, Eschrich S, Jurisica I, Giordano TJ, Misek DE, Chang AC, Zhu CQ, Strumpf D, et al. Gene expression-based survival prediction in lung adenocarcinoma: a multi-site, blinded validation study. Nat Med. 2008; 14:822–827.
4. Sakurai H, Asamura H. Sublobar resection for early-stage lung cancer. Transl Lung Cancer Res. 2014; 3:164–172.
5. Tanaka F, Yoneda K. Adjuvant therapy following surgery in non-small cell lung cancer (NSCLC). Surg Today. 2015.
6. Al-Kadi OS, Watson D. Texture analysis of aggressive and nonaggressive lung tumor CE CT images. IEEE Trans Biomed Eng. 2008; 55:1822–1830.
7. Kido S, Kuriyama K, Higashiyama M, Kasugai T, Kuroda C. Fractal analysis of internal and peripheral textures of small peripheral bronchogenic carcinomas in thin-section computed tomography: comparison of bronchioloalveolar cell carcinomas with nonbronchioloalveolar cell carcinomas. J Comput Assist Tomogr. 2003; 27:56–61.
8. Aerts HJ, Velazquez ER, Leijenaar RT, Parmar C, Grossmann P, Carvalho S, Bussink J, Monshouwer R, Haibe-Kains B, Rietveld D, Hoebers F, Rietbergen MM, Leemans CR, et al. Decoding tumour phenotype by noninvasive imaging using a quantitative radiomics approach. Nat Commun. 2014; 5:4006.
9. Coroller TP, Grossmann P, Hou Y, Rios Velazquez E, Leijenaar RT, Hermann G, Lambin P, Haibe-Kains B, Mak RH, Aerts HJ. CT-based radiomic signature predicts distant metastasis in lung adenocarcinoma. Radiother Oncol. 2015; 114:345–350.
10. Lambin P, Rios-Velazquez E, Leijenaar R, Carvalho S, van Stiphout RG, Granton P, Zegers CM, Gillies R, Boellard R, Dekker A, Aerts HJ. Radiomics: extracting more information from medical images using advanced feature analysis. Eur J Cancer. 2012; 48:441–446.
11. Win T, Miles KA, Janes SM, Ganeshan B, Shastry M, Endozo R, Meagher M, Shortman RI, Wan S, Kayani I. Tumor heterogeneity and permeability as measured on the CT component of PET/CT predict survival in patients with non–small cell lung cancer. Clin Cancer Res. 2013; 19:3591–3599.
12. Chicklore S, Goh V, Siddique M, Roy A, Marsden PK, Cook GJ. Quantifying tumour heterogeneity in 18F-FDG PET/CT imaging by texture analysis. Eur J Nucl Med Mol Imaging. 2013; 40:133–140.
13. Yoon HJ, Sohn I, Cho JH, Lee HY, Kim JH, Choi YL, Kim H, Lee G, Lee KS, Kim J. Decoding Tumor Phenotypes for ALK, ROS1, and RET Fusions in Lung Adenocarcinoma Using a Radiomics Approach. Medicine (Baltimore). 2015; 94:e1753.
14. Yoshizawa A, Motoi N, Riely GJ, Sima CS, Gerald WL, Kris MG, Park BJ, Rusch VW, Travis WD. Impact of proposed IASLC/ATS/ERS classification of lung adenocarcinoma: prognostic subgroups and implications for further revision of staging based on analysis of 514 stage I cases. Mod Pathol. 2011; 24:653–664.
15. Zeybek A, Toru S, Ozbudak IH, Sarper A, Oz N, Bozcuk H, Ozbilim G, Demircan A. Clinical and pathologic prognostic factors that are influential in the survival and prognosis of lung adenocarcinomas and invasive predominant subtypes. Int Surg. 2013; 98:191–199.
16. Okada M, Koike T, Higashiyama M, Yamato Y, Kodama K, Tsubota N. Radical sublobar resection for small-sized non-small cell lung cancer: a multicenter study. J Thorac Cardiovasc Surg. 2006; 132:769–775.
17. Koike T, Yamato Y, Yoshiya K, Shimoyama T, Suzuki R. Intentional limited pulmonary resection for peripheral T1 N0 M0 small-sized lung cancer. J Thorac Cardiovasc Surg. 2003; 125:924–928.
18. Suzuki K, Koike T, Asakawa T, Kusumoto M, Asamura H, Nagai K, Tada H, Mitsudomi T, Tsuboi M, Shibata T, Fukuda H, Kato H. A prospective radiological study of thin-section computed tomography to predict pathological noninvasiveness in peripheral clinical IA lung cancer (Japan Clinical Oncology Group 0201). J Thorac Oncol. 2011; 6:751–756.
19. Raghunath S, Maldonado F, Rajagopalan S, Karwoski RA, DePew ZS, Bartholmai BJ, Peikert T, Robb RA. Noninvasive risk stratification of lung adenocarcinoma using quantitative computed tomography. J Thorac Oncol. 2014; 9:1698–1703.
20. Koike T, Koike T, Yoshiya K, Tsuchida M, Toyabe S. Risk factor analysis of locoregional recurrence after sublobar resection in patients with clinical stage IA non-small cell lung cancer. J Thorac Cardiovasc Surg. 2013; 146:372–378.
21. Travis WD, Brambilla E, Nicholson AG, Yatabe Y, Austin JH, Beasley MB, Chirieac LR, Dacic S, Duhig E, Flieder DB. The 2015 World Health Organization Classification of Lung Tumors: Impact of Genetic, Clinical and Radiologic Advances Since the 2004 Classification. J Thorac Oncol. 2015; 10:1243–1260.
22. Nitadori J-i, Bograd AJ, Kadota K, Sima CS, Rizk NP, Morales EA, Rusch VW, Travis WD, Adusumilli PS. Impact of micropapillary histologic subtype in selecting limited resection vs lobectomy for lung adenocarcinoma of 2 cm or smaller. J Natl Cancer Inst. 2013:djt166.
23. Tsao M-S, Marguet S, Le Teuff G, Lantuejoul S, Shepherd FA, Seymour L, Kratzke R, Graziano SL, Popper HH, Rosell R. Subtype Classification of Lung Adenocarcinoma Predicts Benefit From Adjuvant Chemotherapy in Patients Undergoing Complete Resection. J Clin Oncol. 2015; 33:3439–3446.
24. Sica G, Yoshizawa A, Sima CS, Azzoli CG, Downey RJ, Rusch VW, Travis WD, Moreira AL. A grading system of lung adenocarcinomas based on histologic pattern is predictive of disease recurrence in stage I tumors. Am J Surg Pathol. 2010; 34:1155–1162.
25. Barletta JA, Yeap BY, Chirieac LR. Prognostic significance of grading in lung adenocarcinoma. Cancer. 2010; 116:659–669.
26. Lee HY, Jeong JY, Lee KS, Kim HJ, Han J, Kim BT, Kim J, Shim YM, Kim JH, Song I. Solitary pulmonary nodular lung adenocarcinoma: correlation of histopathologic scoring and patient survival with imaging biomarkers. Radiology. 2012; 264:884–893.
27. Coghlin CL, Smith LJ, Bakar S, Stewart KN, Devereux GS, Nicolson MC, Kerr KM. Quantitative analysis of tumor in bronchial biopsy specimens. J Thorac Oncol. 2010; 5:448–452.
28. Nyflot MJ, Yang F, Byrd D, Bowen SR, Sandison GA, Kinahan PE. Quantitative radiomics: impact of stochastic effects on textural feature analysis implies the need for standards. J Med Imaging (Bellingham). 2015; 2:041002.
29. Kumar V, Gu Y, Basu S, Berglund A, Eschrich SA, Schabath MB, Forster K, Aerts HJ, Dekker A, Fenstermacher D, Goldgof DB, Hall LO, Lambin P, et al. Radiomics: the process and the challenges. Magn Reson Imaging. 2012; 30:1234–1248.
30. Johnson TR, Krauss B, Sedlmair M, Grasruck M, Bruder H, Morhard D, Fink C, Weckbach S, Lenhard M, Schmidt B, Flohr T, Reiser MF, Becker CR. Material differentiation by dual energy CT: initial experience. Eur Radiol. 2007; 17:1510–1517.
31. Chae EJ, Song JW, Seo JB, Krauss B, Jang YM, Song KS. Clinical utility of dual-energy CT in the evaluation of solitary pulmonary nodules: initial experience. Radiology. 2008; 249:671–681.
32. Schmid-Bindert G, Henzler T, Chu TQ, Meyer M, Nance JW Jr, Schoepf UJ, Dinter DJ, Apfaltrer P, Krissak R, Manegold C, Schoenberg SO, Fink C. Functional imaging of lung cancer using dual energy CT: how does iodine related attenuation correlate with standardized uptake value of 18FDG-PET-CT? Eur Radiol. 2012; 22:93–103.
33. Yi CA, Lee KS, Kim EA, Han J, Kim H, Kwon OJ, Jeong YJ, Kim S. Solitary Pulmonary Nodules: Dynamic Enhanced Multi–Detector Row CT Study and Comparison with Vascular Endothelial Growth Factor and Microvessel Density 1. Radiology. 2004; 233:191–199.
34. Son JY, Lee HY, Kim JH, Han J, Jeong JY, Lee KS, Kwon OJ, Shim YM. Quantitative CT analysis of pulmonary ground-glass opacity nodules for distinguishing invasive adenocarcinoma from non-invasive or minimally invasive adenocarcinoma: the added value of using iodine mapping. Eur Radiol. 2015.
35. Yoon HJ, Sohn I, Cho JH, Lee HY, Kim JH, Choi YL, Kim H, Lee G, Lee KS, Kim J. Decoding Tumor Phenotypes for ALK, ROS1, and RET Fusions in Lung Adenocarcinoma Using a Radiomics Approach. Medicine. 2015; 94.
36. Goh V, Ganeshan B, Nathan P, Juttla JK, Vinayan A, Miles KA. Assessment of response to tyrosine kinase inhibitors in metastatic renal cell cancer: CT texture as a predictive biomarker. Radiology. 2011; 261:165–171.
37. Ozluk Y, Blanco PL, Mengel M, Solez K, Halloran PF, Sis B. Superiority of virtual microscopy versus light microscopy in transplantation pathology. Clin Transplant. 2012; 26:336–344.
38. Travis WD, Brambilla E, Noguchi M, Nicholson AG, Geisinger KR, Yatabe Y, Beer DG, Powell CA, Riely GJ, Van Schil PE, Garg K, Austin JH, Asamura H, et al. International association for the study of lung cancer/american thoracic society/european respiratory society international multidisciplinary classification of lung adenocarcinoma. J Thorac Oncol. 2011; 6:244–285.
39. Kim HK, Choi YS, Kim K, Shim YM, Jeong SY, Lee KS, Kwon OJ, Kim J. Management of ground-glass opacity lesions detected in patients with otherwise operable non-small cell lung cancer. J Thorac Oncol. 2009; 4:1242–1246.