
INTRODUCTION
Breast cancer (BC) is the most common tumor causing high mortality among women worldwide. It is characterized by high heterogeneity in respect of prognosis, clinical course, phenotype and molecular characteristics. A molecular classification of BC based on microarray studies has distinguished at least five subtypes with luminal type A (lumA), and a basal-like type comprising a triple negative immunophenotype (TN) [1–6]. While lumA BC is associated with a very good prognosis, the rapidly developing and metastatic TN BC has a poor clinical outcome.
The Notch pathway is an evolutionary conserved signaling mechanism determining cell fate and involved in regulation of proliferation, differentiation, vascular remodeling and angiogenesis in embryonic and adult tissues [7]. Mammals express four Notch receptors (NOTCH1-NOTCH4) and five DSL ligands: DLL1, DLL3, DLL4, JAG1 and JAG2. The canonical Notch pathway is activated by interaction of DSL ligands with Notch receptors leading to two sequential proteolytic cleavages of the receptors: the first performed by ADAM/TACE metalloprotease, and the second in the remaining portion of Notch by the γ-secretase complex (comprising PSEN1, PSEN2, PEN2, APH1, nicastrin). This results in the release of the Notch intracellular domain (NICD), which in the nucleus forms a complex with DNA binding protein RPBJ and MAML family transcriptional coactivators. The latter induces the expression of Notch target genes encoding transcription factors (TFs), i.e. HES1 and HEY1 [8, 9].
Studies show that aberrant Notch signaling plays an important role in breast cancer development and progression via promotion of growth, invasion, angiogenesis and metastasis. Interestingly, the Notch pathway can be either tumor suppressive or oncogenic, depending on the expression profiles of its receptors and ligands [10]. In particular, high expression of NOTCH1 and NOTCH3 has been reported to be associated with hormone receptor-negative tumors. NOTCH4, similar to NOTCH1 and NOTCH3 functions as an oncogene, but with hormone receptor-positive BC [11]. On the contrary, high expression of NOTCH2 has been associated with better survival [12], which might be associated with increased apoptosis in vitro [13]. Other studies indicate that elevated NOTCH1 and JAG1 in patients with BC is correlated with poor overall survival [14], and that the loss of NUMB expression increases Notch activity and thus increases proliferation of tumor cells [15].
Epithelial-to-mesenchymal transition (EMT) is a key mechanism for differentiating cells in complex tissues [16]. During tumor progression, various processes associated with EMT may increase the motility and invasiveness of cancer cells. When they become mesenchymal stem cells, epithelial cells lose their polarity, adherens junctions, tight junctions and cytokeratin intermediate filaments, but gain migratory properties [17, 18]. These changes can occur concomitantly with the upregulation of SNAIL, SIP1/ZEB2 and SLUG, which are the direct transcriptional repressors of E-cadherin, and also with the acquisition of mesenchymal markers such as vimentin, N-cadherin and fibronectin [18, 19]. Among the many mechanisms implicated in EMT progression, accumulating evidence shows that the Notch signaling pathway is important in many human malignancies. NOTCH1 has been found to be the major regulator of invasion and metastasis in esophageal carcinoma by inducing EMT through SNAIL in vitro [20]. In colorectal HT29 cancer cells, elevated expression of the Notch intracellular domain (NICD) and NFkβp65 resulted in the upregulation of BCL-XL, which subsequently led to inhibition of apoptosis and greater tumor progression [21]. Furthermore, the activation of NOTCH1 was crucial for TGF β-induced EMT in epithelial ovarian cancer and was manifested by inhibition of E-cadherin [22].
The present study examines whether the differential expression of Notch signaling members has any effect on disease-free survival (DFS) in lumA and TN BC. We focused on luminal type A and triple negative breast cancers as the most biologically distant subtypes of breast cancer. Moreover, they are characterized by completely different hormone receptor status (ER+, PR+, HER2- vs ER-, PR-, HER2-), which is considered as cellular proliferation and differentiation factor itself that contributes to distinct characteristics of both cancer types. It attempts to identify the common and unique expression profiles of Notch targets differentiating lumA and TN BC, which may be potentially considered as prognostic biomarkers. Our results indicate that the altered expression of particular Notch signaling genes may play a role in the activation of EMT related processes and affect tissue architecture and remodeling.
RESULTS
Disease free survival analysis
The study examined how differences in Notch pathway gene expression influence DFS in lumA and TN BC. Expression cutoff points and the numbers of patients assigned to groups based on low or high Notch gene expression are listed in Table 1. Differential expression of several genes like APH1B, DLK1, JAG1, NOTCH4, PSEN2, HES5 had no significant effect on DFS, and were therefore excluded from further analyses. Remaining members of Notch signaling demonstrated contrary effect on DFS in both breast cancer subtypes. Specifically, relatively high expression of HES1, PSEN1 and LFNG was correlated with good prognosis in lumA (HR=0.23, p=0.0064; HR=0.24, p=0.0062; HR=0.28, p=0.029, respectively) (Figure 1), while lowered expression was associated with better DFS in TN (HR>100, p=0.0016; HR=11.22, p=0.033; HR=11.22, p=0.033, respectively) (Figure 2).
Table 1: Statistics for DFS analysis
Gene |
Cutoff |
Number of patients in group |
||
|---|---|---|---|---|
Low expression* |
High expression* |
|||
lumA BC |
||||
ADAM10 |
2301 |
304 |
63 |
|
ADAM17 |
577.3 |
133 |
234 |
|
APH1B |
710.3 |
237 |
130 |
|
HES1 |
1071 |
159 |
208 |
|
HES4 |
115.7 |
269 |
98 |
|
HEY1 |
558.3 |
350 |
17 |
|
LFNG |
418.4 |
57 |
310 |
|
NOTCH1 |
581.6 |
67 |
300 |
|
NOTCH3 |
7861 |
348 |
19 |
|
NUMB |
1738 |
271 |
96 |
|
PSEN1 |
1818 |
99 |
268 |
|
TN BC |
||||
ADAM10 |
1467 |
34 |
80 |
|
HES1 |
1744 |
95 |
19 |
|
LFNG |
534.3 |
90 |
24 |
|
NOTCH1 |
3594 |
96 |
18 |
|
NOTCH2 |
7515 |
85 |
29 |
|
NOTCH3 |
4715 |
69 |
45 |
|
PSEN1 |
2928 |
98 |
16 |
|
* We defined “low expression” as the expression values below and “high expression” as the expression values above the determined cutoff.
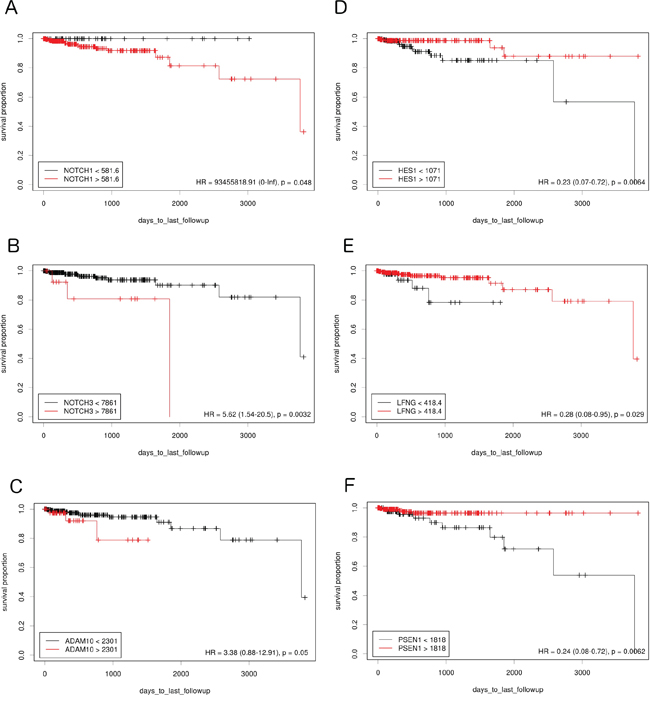
Figure 1: The prognostic effect of Notch member expression on DFS in lumA BC. Kaplan-Meier curves are plotted for A. NOTCH1, B. NOTCH 3, C. ADAM10, D. HES1, E. LFNG and F. PSEN1.
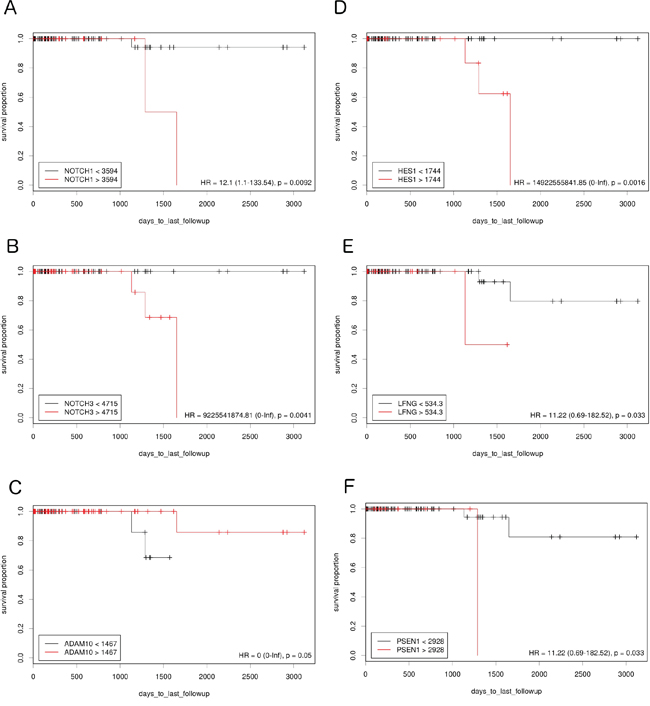
Figure 2: The prognostic effect of Notch member expression on DFS in TN BC. Kaplan-Meier curves are plotted for A. NOTCH1, B. NOTCH 3, C. ADAM10, D. HES1, E. LFNG and F. PSEN1.
On the contrary, lowered expression of ADAM10 was correlated with better prognosis in lumA (HR=3.38, p=0.05) (Figure 1) and higher expression with better prognosis in TN (HR<0.001, p=0.05) (Figure 2). Lowered NOTCH1 and NOTCH3 expression was favorable for DFS in both lumA (HR>100, p=0.048; HR=3.91, p=0.023, respectively) (Figure 1) and TN (HR=12.1, p=0.0092; HR=100, p=0.0041, respectively) (Figure 2).
Some of the analyzed genes demonstrated a significant impact in only one of the subtypes. In particular, lowered expression of NOTCH2 was correlated with better prognosis in TN (HR=100, p<0.001) and ADAM17, and HEY1 in lumA (HR=4.71, p=0.011; HR=4.42, p=0.012, respectively); in contrast, overexpression of DLL4, JAG2 and NUMB was favorable in lumA (HR=0.29, p=0.044; HR=0.3, p=0.023; HR=0, p=0.025, respectively).
Gene enrichment analysis of Notch pathway downstream effect
Transcription factor binding motifs
Gene Set Enrichment Analysis (GSEA) was performed to examine global biological differences between DFS groups based on previously computed cutoff points for Notch pathway genes for which differential expression had a significant influence on disease recurrence predicted outcome. GSEA of the molecular signatures of TF binding motifs found distinct associations between Notch signaling and TF involved in the regulation of cell cycle, tissue architecture and remodeling. In particular, targets of the E2F TF family were upregulated in HES1 and PSEN1 lumA DFS bad prognosis group (Figure 3) and TN good prognosis group (Figure 4), as well as in the NOTCH1 bad prognosis group in both subtypes. E2F1 targets were significantly upregulated in the lumA ADAM10, NOTCH1 and NOTCH3 bad prognosis phenotypes (Figure 5). Similar results were found for SP1 target genes (Figure 6). In addition, SP1 was found to be upregulated in the ADAM10 lumA high phenotype (ES>0.1), which indicated that its upregulation contributes to a lumA-favorable prognosis, although at a considerably lower level (Figure 6). Interestingly, SP1 different targets were upregulated in bad and good prognosis groups of lumA according to ADAM10 differentiation. Furthermore, GATA3 target genes were upregulated in the poorer prognosis groups of lumA ADAM10, NOTCH1 and NOTCH3 (Figure 7), while no significant upregulation in GATA3 targets was found in the TN subtype. Additionally, targets of LEF1, AP1, SRF, SMAD and NFKB were significantly upregulated in unfavorable prognosis lumA NOTCH1 and NOTCH3. Statistics for upregulated TF gene sets are listed in Table 2. Detailed results are available as Supplementary File 1.
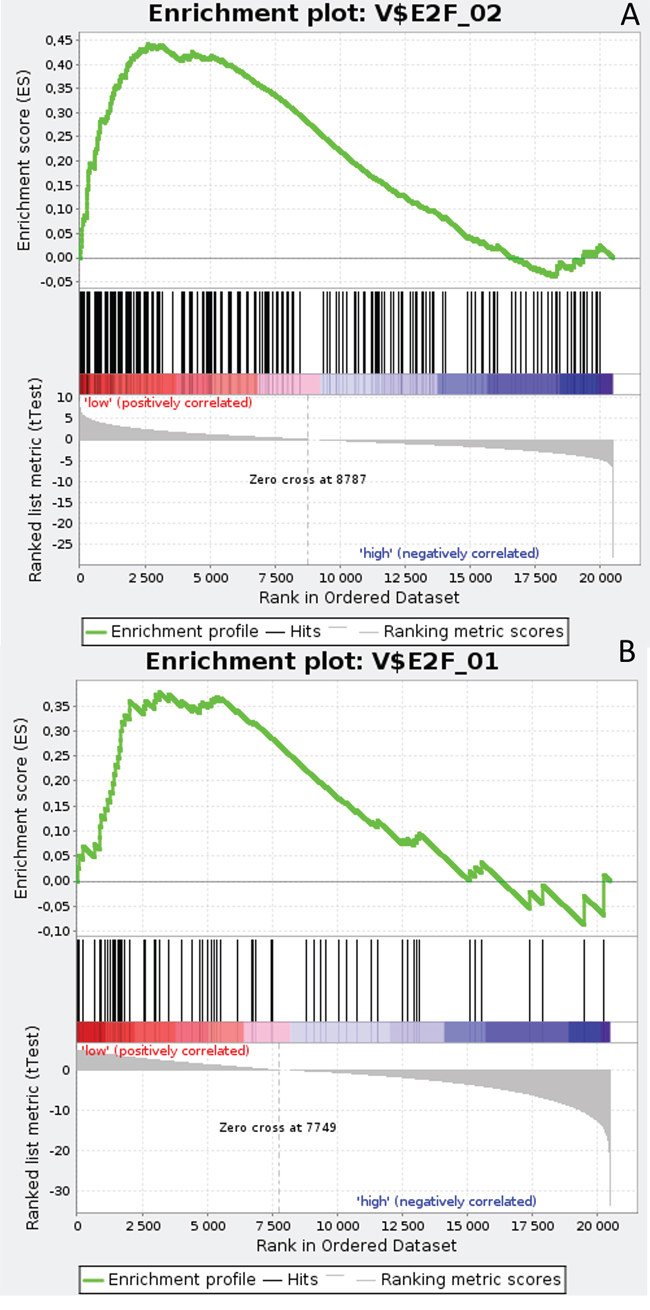
Figure 3: Enrichment plots presenting E2F target gene set in lumA A. HES1-low subgroup, B. PSEN1-low subgroup.
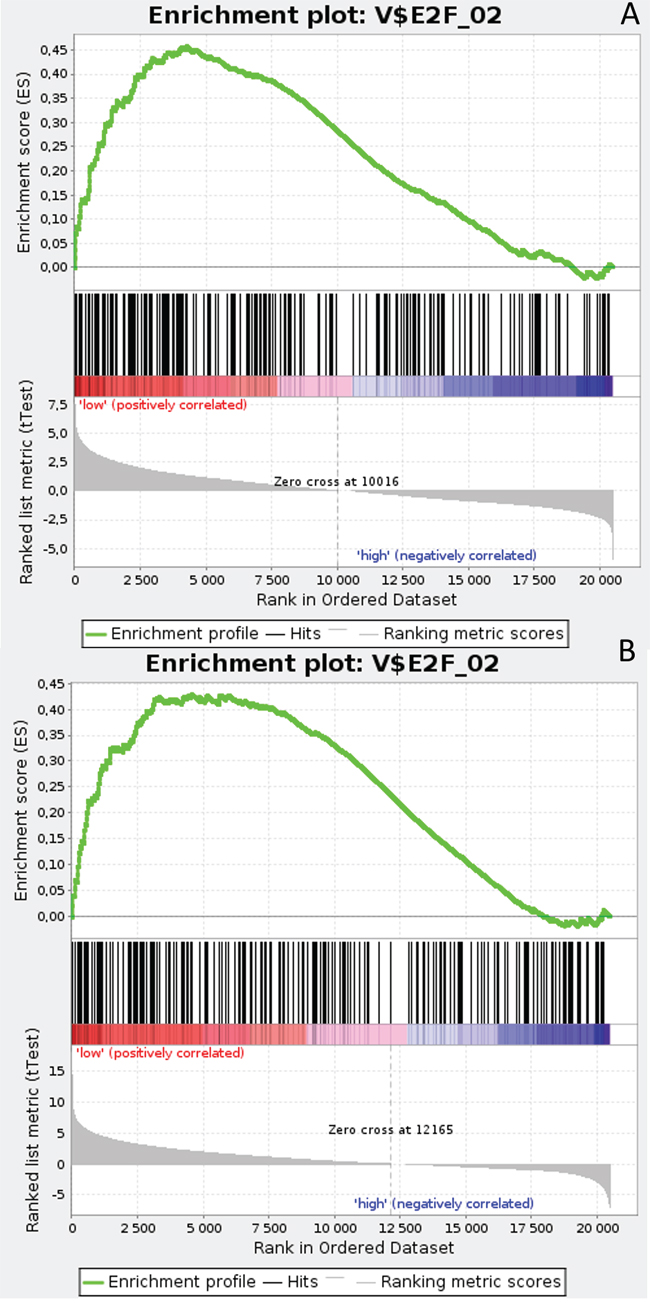
Figure 4: Enrichment plots presenting E2F target gene set in TN A. HES1-low, B. PSEN1-low subgroups.
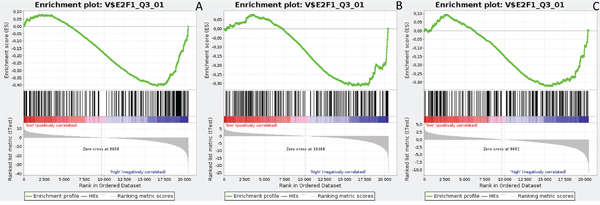
Figure 5: Enrichment plots presenting E2F1 targets in lumA A. ADAM10-high, B. NOTCH1-high, C. NOTCH3-high subgroups.
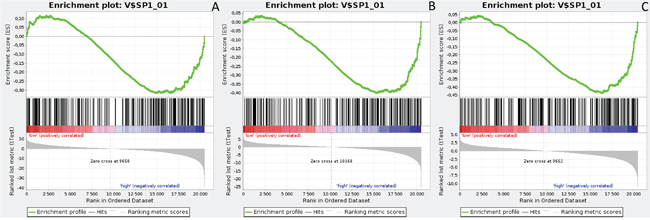
Figure 6: Enrichment plots presenting SP1 targets in lumA A. ADAM10-high, B. NOTCH1-high, C. NOTCH3-high subgroups.
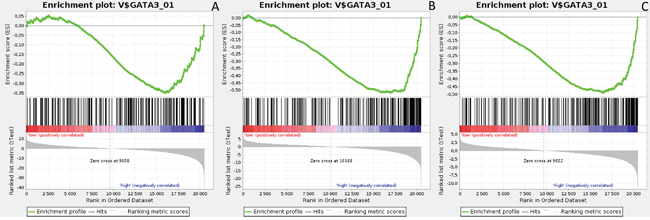
Figure 7: Enrichment plots presenting GATA3 targets in lumA A. ADAM10-high, B. NOTCH1-high, C. NOTCH3-high subgroups.
Table 2: Selected TF targets gene sets for ADAM10, NOTCH1 and NOTCH3 unfavorable prognosis in lumA
Transcription factors |
ADAM10 |
NOTCH1 |
NOTCH3 |
|||
|---|---|---|---|---|---|---|
FDR |
p-value |
FDR |
p-value |
FDR |
p-value |
|
E2F_Q2 |
0.015 |
0.022 |
0.156 |
0.186 |
0.493 |
0.463 |
E2F1_Q3_01 |
0.012 |
0<0.001 |
0.094 |
0.053 |
0.094 |
0.039 |
SP1_Q6 |
0.047 |
0.002 |
0.005 |
0<0.001 |
0.140 |
0.079 |
GATA3 |
0.225 |
0.197 |
0<0.001 |
0<0.001 |
0.003 |
0<0.001 |
AP1_Q2 |
0.132 |
0.071 |
0<0.001 |
0<0.001 |
0.012 |
0.002 |
SMAD_Q6 |
0.012 |
0.001 |
0<0.001 |
0<0.001 |
0.007 |
0<0.001 |
SRF_Q6 |
0.155 |
0.178 |
0<0.001 |
0<0.001 |
0<0.001 |
0<0.001 |
NFKB_Q6 |
0.144 |
0.134 |
0<0.001 |
0<0.001 |
0.007 |
0<0.001 |
P53_02 |
0.043 |
0.008 |
0<0.001 |
0<0.001 |
0.005 |
0<0.001 |
LEF1_Q2 |
0.008 |
0<0.001 |
0.003 |
0.001 |
0.010 |
0.004 |
HIF1_Q3 |
0.001 |
0<0.001 |
0.039 |
0.010 |
0.246 |
0.192 |
MYC_Q2 |
0.204 |
0.180 |
0.201 |
0.202 |
0.288 |
0.268 |
GSEA analysis of gene ontology (BP, CC, MF), KEGG canonical pathways and chemical and genetic perturbations
Results varied between lumA/TN and favorable/unfavorable phenotypes (determined by DFS analysis) according to differential expression of the Notch signaling pathway; however, only the significantly upregulated gene sets related to EMT were analyzed. Specifically, only gene sets containing the genes VIM, MMP2, CDH2, ITGA5, ITGB6, SPARC, FN1 and VNT were significantly upregulated in ADAM10, NOTCH1 and NOTCH3 unfavorable prognosis (Table 3). Detailed results are available as Supplementary File 2.
Table 3: Selected gene sets regarding GO BP, CC, MF and KEGG canonical pathways for ADAM10, NOTCH1 and NOTCH3 unfavorable prognosis in lumA, essential in EMT
Hallmark gene set |
EMT genes |
ADAM10 |
NOTCH1 |
NOTCH3 |
|---|---|---|---|---|
GO Biological process |
||||
Tissue remodeling |
SPARC |
- |
0.003 |
0.019 |
Tissue development |
SMAD2, SPARC |
- |
0.002 |
0.014 |
Transmembrane receptor protein tyrosine kinase signaling pathway |
FOXC2, SMAD2 |
0.139 |
0.003 |
0.033 |
TGF- β receptor signaling pathway |
SMAD2, SMAD3 |
0.035 |
0.003 |
0.058 |
GO Cellular compartment |
||||
Extracellular region |
MMP2, MMP3, MMP9, VNT |
- |
0.002 |
0.004 |
Cytoskeleton |
VIM, CTNNB1 |
0.058 |
0.025 |
0.031 |
Integrin complex |
ITGA5, ITGB6 |
0.041 |
0.01 |
0.017 |
Receptor complex |
ITGA5, ITGB6, SMAD3 |
0.111 |
0.006 |
0.041 |
GO Molecular function |
||||
Structural molecule activity |
VIM |
- |
0.06 |
0.068 |
Structural constituent of cytoskeleton |
VIM |
- |
0.007 |
0.007 |
KEGG Canonical pathway |
||||
Adherens junction |
SMAD2, SMAD3, CTNNB1 |
0.001 |
0.002 |
0.018 |
Tight junction |
CTNNB1 |
0.158 |
0.002 |
0.016 |
Focal adhesion |
ITGA5, ITGB6, FN1, CTNNB1, VTN |
0.034 |
<0.001 |
<0.001 |
ECM receptor interaction |
ITGA5, ITGB6, FN1, VTN |
0.056 |
<0.001 |
0.002 |
Regulation of actin cytoskeleton |
ITGA5, ITGB6, FN1 |
0.029 |
<0.001 |
0.019 |
Cell adhesion molecules cams |
CDH2 |
- |
<0.001 |
0.21 |
TGF- β signaling pathway |
SMAD2, SMAD3 |
0.005 |
<0.001 |
0.015 |
Wnt signaling pathway |
CTNNB1, SMAD2, SMAD3 |
0.041 |
0.003 |
0.049 |
GSEA of chemical and genetic perturbations (CGPs) indicated the upregulation of gene sets associated with resistance/sensitivity to various treatment and aberrant processes related to cancer progression/metastasis. ADAM10, NOTCH1 and NOTCH3 unfavorable prognosis groups demonstrated similar profiles of response to treatment, showing upregulation in resistance to doxorubicin, alkylating agents, endocrine therapy, mitoxantrone, dasatinib and cisplatin as well as sensitivity to fluorouracil, cyclophosphamide and vincristine. Additionally, upregulation was found in CTNNB1 oncogenic signature, metastasis, EMT and metastasis through EMT (Table 4). Detailed results are available as Supplementary File 3.
Table 4: Selected CGPs in lumA unfavorable prognosis groups
ADAM10 |
HES1 |
NOTCH1 |
NOTCH3 |
PSEN1 |
|
|---|---|---|---|---|---|
Doxorubicin resistance |
0.108 |
- |
0.001 |
0.007 |
- |
Tamoxifen resistance dn |
0.204 |
0.231 |
- |
- |
- |
Alkylating agents resistance up |
- |
- |
0.002 |
0.022 |
- |
Alkylating agents resistance dn |
0.034 |
0.193 |
- |
- |
0.221 |
Endocrine therapy resistance |
0.001 |
- |
0.25 |
0.156 |
- |
Mitoxantrone resistance |
0.006 |
- |
0.033 |
0.108 |
- |
Dasatinib resistance up |
0.232 |
- |
0.001 |
0.005 |
- |
Cisplatin resistance up |
0.245 |
- |
0.005 |
0.008 |
- |
Sensitivity to fluorouracil |
0.019 |
- |
0.023 |
0.191 |
- |
Sensitivity to cyclophosphamide |
0.065 |
- |
- |
- |
- |
Sensitivity to vincristine |
0.231 |
- |
0.045 |
0.021 |
- |
CTNNB1 oncogenic signature |
0.000 |
0.15 |
0.082 |
0.214 |
- |
Metastasis up |
0.001 |
0.191 |
0.22 |
- |
0.042 |
Epithelial-to-mesenchymal tansition up |
0.22 |
- |
0.000 |
0.000 |
- |
Cancer mesenchymal transition signature |
- |
- |
0.019 |
0.005 |
- |
Metastasis EMT up |
0.177 |
- |
0.063 |
0.029 |
- |
Additionally, GSEA heat maps were generated for the top 50 gene markers for each phenotype of DFS prognosis. Figures 8 and 9 present heat maps for the lumA ADAM10 and NOTCH1 phenotypes, showing the marker genes for comparing good and bad prognoses. Selected markers of ADAM10 and NOTCH1 unfavorable prognosis are listed in Table 5. Heatmaps of the gene markers for HES1, PSEN1, LFNG and NOTCH3 phenotype are available as Supplementary Files 4-7.
Table 5: Marker genes for ADAM10 and NOTCH1 lumA phenotypes
ADAM10 |
NOTCH1 |
|---|---|
ANAPC1, APOOL, ASXL2, ATF2, C10orf118, C1orf58, C9orf102, C9orf41, CCDC75, CCNT1, CLOCK, CSNK2A1P, DDI2, DPP8, ETV3, EXOC6B, FAM63B, GTF2A1, GTF3C4, IDE, IPMK, LATS1, LCOR, LEPROT, LIMS1, LMTK2, LNPEP, LOC284441, MAP3K2, MGAT5, PAFAH1B2, PPP4R2, PRKAR2A, PTPLB, RAD54L2, RC3H2, REST, RIF1, RNF111, RNF168, ROCK2, STRN, TAOK1, TGFBRAP1, TOR1AIP2, TTBK2, UHMK1, ZDHHC20, ZNF699 |
ABCA6, ALDH1A3, ARHGAP23, ARHGAP31, BTBD19, C10orf72, C14orf49, C1S, COL15A1, COL18A1, CYGB, DCHS1, ERG, FBLN2, FLRT2, FMNL3, GLI1, GLI2, GPR124, HSPG2, KANK2, KIAA1755, KIRREL, LAMA2, LAMB1, LHFP, LRP1, LRRC32, LTBP2, MAP7D3, NOTCH3, NRP1, PCSK5, PDGFRA, PDGFRB, PROS1, RHOJ, RUNX1T1, SLIT2, SPARCL1, STARD8, SYNPO, TIE1, TMEM200C, TMEM204, TNS1, TSPAN11, ZCCHC24, ZNF366 |
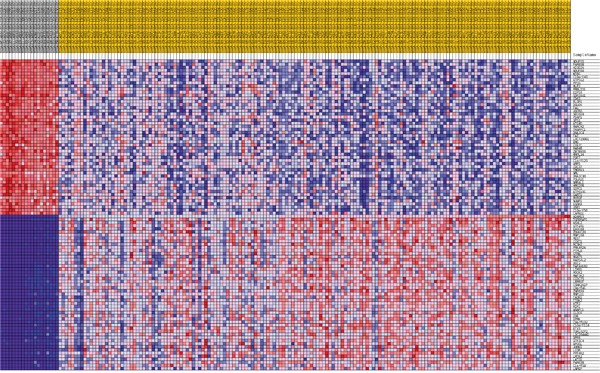
Figure 8: Heatmap of 50 marker genes for ADAM10 lumA phenotypes.
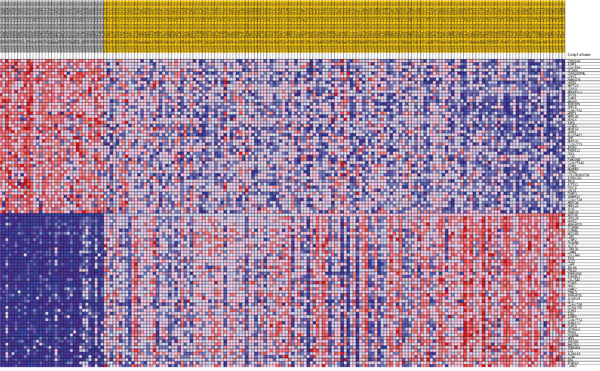
Figure 9: Heatmap of 50 marker genes for NOTCH1 lumA phenotypes.
LumA and TN BC gene expression profiles comparison (cluster and class analysis)
The Express Cluster Analysis of Notch target genes identified unique expression profiles which differentiated lumA and TN BC. The clusters indicated differentially or equally-expressed genes among various good or bad prognosis phenotypes for lumA and TN subtypes. Heatmaps revealed changes in the expression of genes in lumA/TN HES1/LFNG/PSEN1/ADAM10/NOTCH1/NOTCH3 good/poor prognosis groups (Supplementary File 8). Most notably, COL18A1, DSP, ITGB1, MMP11, TAGLN and THBS2, among others, were commonly upregulated in the lumA and TN NOTCH1 poor prognosis phenotype (Figure 10), whereas COL6A3, SPARC, COL1A1, COL1A2, COL3A1 and FN1 were upregulated in the lumA/TN NOTCH3 bad prognosis phenotype (Figure 11). Class comparisons, showing the gene expression profiles of HES1 vs LFNG vs PSEN1 and NOTCH1 vs NOTCH3 DFS prognosis groups are presented as Venn diagrams. ADAM10 was excluded due to its outlier expression profile in lumA and TN.
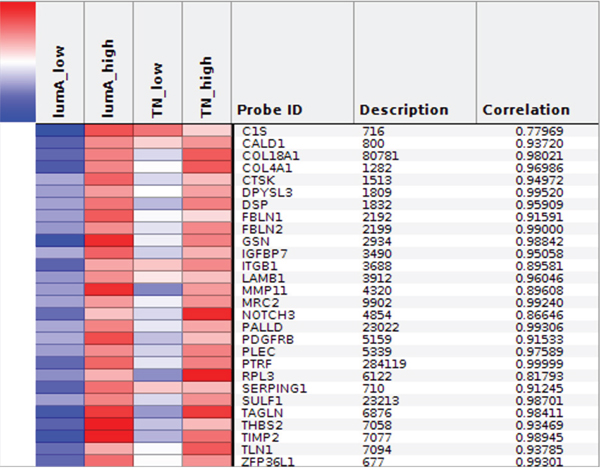
Figure 10: Heatmap representing common profiles in NOTCH1 lumA/TN unfavorable phenotypes.
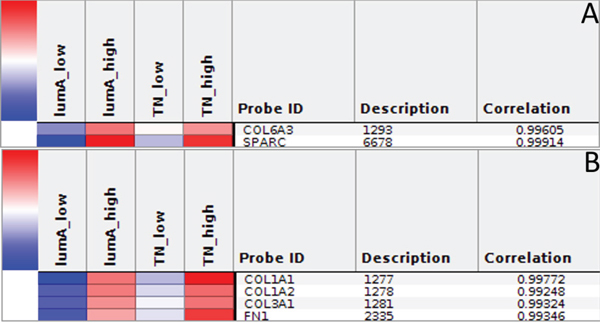
Figure 11: A. and B. Heatmap representing common profiles in NOTCH3 lumA/TN unfavorable phenotypes.
No common upregulated genes were identified for the HES1/LFNG/PSEN1 favorable prognosis, but nine common downregulated genes were found (BCAP31, CALM1, FTL1, GNB2, NPC2, PRDX5, RAC1, SSR4, UQCRC1) (Figure 12). Furthermore, only one downregulated common gene, F11R, was found in the HES1/LFNG/PSEN1 unfavorable prognosis (Figure 12). The comparison of NOTCH1/NOTCH3 revealed nine common upregulated genes (AZIN1, CDC42, GOLGA4, H3F3A, KIF5B, PCMTD1, TM9SF3, TMED2, URB5) and 83 downregulated common genes, including COLA1A1, COL1A2, DST, FN1, RUNX1, TGFB1 and SPARC (Figure 13). Four downregulated genes (BCAP31, HSPA5, PRDX1, SERP1) and three upregulated genes (MMP11, TAGLN, THB2) were found for the NOTCH1/NOTCH3 unfavorable prognosis (Figure 13).
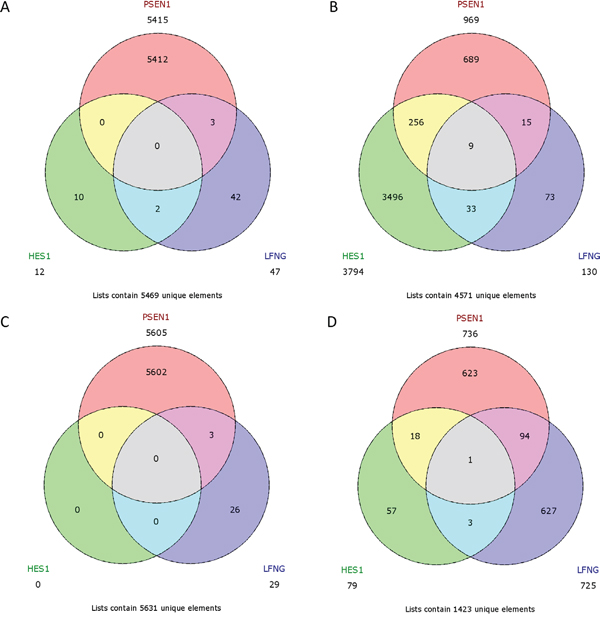
Figure 12: Venn diagrams representing class comparison of HES1 vs PSEN1 vs LFNG in favorable prognosis for A. upregulated genes, B. downregulated genes; and unfavorable prognosis for C. upregulated genes, D. downregulated genes.
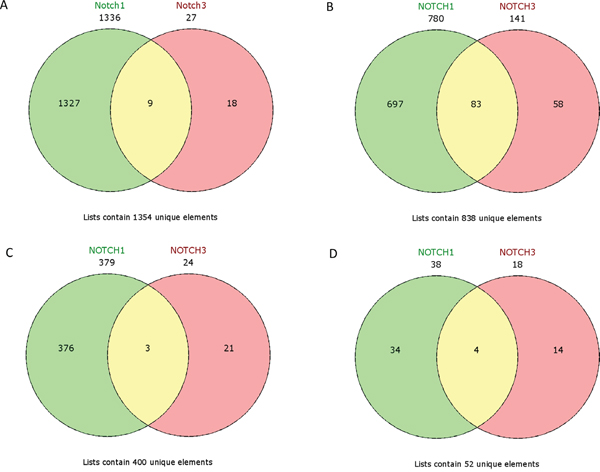
Figure 13: Venn diagrams representing class comparison of NOTCH1 vs NOTCH3 in favorable prognosis for A. upregulated genes, B. downregulated genes; and unfavorable prognosis for C. upregulated genes, D. downregulated genes.
Additionally, we performed cross - validation of our findings based on independent BC cohorts, however regarding many differences that occur within the data, the results cannot be compared. Uni - and multivariate Cox analyses showed that Notch signatures does not have independent prognostic value (see Supplementary Results).
DISCUSSION
Our study evaluates the prognostic effect of the expression of Notch pathway members on DFS in lumA and TN BC. RNA-seq expression data obtained from tumor tissues was compared with the TCGA database, and the findings allowed patients to be assigned favorable / unfavorable prognosis based on aberrant Notch signaling. Although 19 genes involved in Notch pathway were initially examined, only 13 of them were found to be significantly associated with disease recurrence prognosis (Table 1).
NOTCH1 is the best studied Notch receptor with regard to breast cancer. NOTCH1 mutations have been reported in a high proportion of tumors, and are known to impair mammary stem cell self-renewal and promote cell transformation [23]. Furthermore, NOTCH1 has been identified as a mediator of the RAS oncogenic pathway; this is often deregulated during the early stages of breast cancers and participates in the JAG1/NOTCH1/CCND1 axis critical for maintaining proliferation of TN BC cells [24, 25]. Importantly, while high levels of NOTCH1 protein correlate with poorer patient prognosis [12], its mRNA level was not significantly associated with overall survival in BC [26].
Hu et al found NOTCH3 to have transforming potential in vivo, as its activation led to tumor development [27]. In addition, NOTCH3 activation has been detected in various breast cancer cell lines [28]. On the contrary, NOTCH3 inhibition correlated with decreased osteoblast- and TGF-β-1- stimulated colony formation [29]. As expected, favorable DFS prognosis was observed to be associated with lowered expression of both NOTCH1 and NOTCH3 in lumA and TN BC (Figures 1 and 2).
To mediate Notch downstream signaling, the receptors must be processed by proteases. Recent studies indicate that ADAM10 is involved in the cleavage of a number of proteins such as the NOTCH receptor, its ligand DLL1 and other proteins influencing the metastatic potential of tumor cells through EMT (N-cadherin, E-cadherin, B-catenin). In particular, depending on its intracellular localization, B-catenin may play a dual role in epithelial cells: being a plasma membrane component and linking E-cadherin to the actin cytoskeleton, it is essential for adherens junction activity; on the other hand, it is also a major effector of the Wnt pathway and localizes to the nucleus after the loss or downregulation of E-cadherin expression, thus enhancing tumor aggressiveness and metastatic potential. Maretzky et al. have shown that ADAM10 modulates B-catenin singling via regulation of cell surface exposition of E-cadherin, therefore affecting the expression of B-catenin downstream targets [30–32]. ADAM10 is also involved in EGFR and ERBB2 receptor shedding, thus demonstrating its critical role in breast cancer [33]. To date ADAM10 overexpression has been identified in several malignancies [34–36]. In a study of its clinical potential in breast tumors, Feldinger et al. found high ADAM10 expression to be associated with poorer trastuzumab response and worse relapse-free survival in HER2+ BC [37]. Nevertheless, it is not clear whether ADAM10 expression has a prognostic role in lumA and TN BC. Our results indicate that lowered expression of ADAM10 is favorable for DFS in lumA whereas high expression is favorable in TN BC (Figures 1 and 2). Importantly, the finding that the CTNNB1 oncogenic signature gene set is upregulated in lumA ADAM10 unfavorable prognosis groups indirectly indicates the presence of cross-talk between ADAM10 and B-catenin (Table 4).
LFNG is a β3N-acetylglucosaminyl-tranferase, which regulates ligand-mediated activation of the Notch pathway: it enhances Notch activation through Delta-like ligands (DLL1, DLL4) and inhibits its activity through Serrate/Jagged ligands (JAG1, JAG2) [38]. Raouf et al. suggest that the expression of DLL1 in myoepithelial cells activates Notch in the LFNG-expressing mammary stem cells (MaSCs) and bipotent progenitor cells present in the human breast. High JAG1 expression has been found in the epithelial compartment; the lowered LFNG level thus increases Jagged-activated Notch signaling and induces the proliferation of luminal progenitors, which has been associated with TN tumors [39, 40].
HES1 is transcription repressor and downstream effector of Notch signaling. HES1 has been proposed as an indicator of Notch signaling activity in many cancers [41]. However, its molecular activity depends on the context [42]. It has been shown that in ER+ BC, estrogen promotes the activation of Notch signaling through JAG1 and represses HES1 expression, leading to increased cell proliferation [43]. Moreover, some studies have indicated that HES1 is able to inhibit Notch signaling via repression of its ligands (JAG1, DLL1), implying possible negative feedback regulation of the Notch pathway [44, 45].
During Notch activation, several proteolytic processing steps occur. Presenilin 1 (PSEN1) is member of the γ-secretase complex involved in the proteolysis of the Notch intermediate peptide, termed Notch extracellular truncation (NEXT) [9]. The significance of PSEN1 in pathology has been widely presented in Alzheimer's disease and other neurodegenerative disorders, as it generates amyloid β [46]. However, its role and prognostic value in breast cancer remains unclear. Nevertheless, Rizzo et al. report that estrogen inhibits Notch signaling through inhibition of Notch receptor cleavage by the γ-secretase complex. In addition, loss of estrogen caused by estrogen deprivation or antiestrogen treatment in neoplastic cells results in enhanced proliferation, survival and invasion as an effect of NOTCH1 reactivation; in contrast to ER- cells, normal ER+ breast cells are non-proliferative [47].
Until now, the prognostic values of LFNG, HES1 and PSEN1, and the relationship between their mRNA level with BC DFS have not been evaluated; however, the present study has two key novel findings: firstly, that an elevated level of LFNG, HES1 and PSEN1 has a favorable effect in lumA BC, as predicted, while lowered LFNG, PSEN1 and HES1 expression correlated with better prognosis in TN BC (Figure 2). Additionally, Notch ligand expression (JAG1, JAG2, DLL4) was not found to have any significant effect on DFS in TN BC. Together with lowered NOTCH1 and NOTCH3, those results indicate inferior activation of the Notch pathway in the favorable prognosis group in TN BC. Moreover, although both BC subtypes are classified as HER2-, they differ in estrogen/progesterone receptor status, tumor biology and clinical course of disease. Such differences in the favorable expression of HES1, LFNG and PSEN1 in lumA and TN may be attributable to variation in the compensative influence of remaining Notch members, or the activation or inhibition of additional pathways.
Sørlie et al. outlined five intrinsic subtypes of BC that differ in clinical outcomes and tumor biology [4]. In particular, lumA cancer cells mimic the luminal epithelial components of the breast (ER+ PR+ HER2-) and are characterized by favorable overall prognosis; however, the risk of recurrence is correlated with metastasis to lymph nodes by the time of diagnosis. In contrast, TN cancer cells mimic basal epithelial cells and normal breast myoepithelium (ER- PR- HER2-), and patients face a poor prognosis [48].
In our study we have appliedGSEA to compare DFS groups in patients with lumA and TN BC. Various sets of genes associated with TF binding motifs were found to be upregulated according to disease recurrence prognosis (Table 2).
The E2F family members are important regulators of the cell cycle [49]. They have been demonstrated to be involved in the regulation of apoptosis and proliferation in human cancers [50]. Hollern et al. reported that loss of E2Fs enhanced ductal transformation and tumor onset in vivo, and that E2Fs mediate the expression of genes critical to angiogenesis, tissue and cell remodeling, and interactions between tumor cells and vascular endothelium to facilitate lung metastasis [51]. Our results indicate that E2F target gene sets were upregulated in the HES1 and PSEN1 lumA bad prognosis and TN good prognosis groups, as well as in the NOTCH1 bad prognosis group in both subtypes (Figures 3-7). As activation of the Notch pathway via NOTCH1 is known to be unfavorable in both subtypes, upregulated targets of E2Fs may be associated with an enhanced recurrence rate. In contrast, other genes in the same gene set were upregulated in lumA bad and TN good prognosis groups. These results demonstrate the biological differences underlying lumA and TN subtypes affecting cell cycle regulation, proliferation and apoptosis through E2Fs; however, these associations should be further investigated.
E2F1 is a transcription activator belonging to the E2F family. The E2F1 and SP1 gene target sets were found to be upregulated in the ADAM10, NOTCH1 and NOTCH3 lumA unfavorable phenotype (Figures 5 and 6); however, SP1 transcription factor is known to be a global regulator of cellular differentiation. The associations of E2F1, SP1 and estrogen receptor in breast cancer have been described previously [52, 53]. It was found that higher expression of E2F1 in ER+ BC (i.e. lumA) enhances tamoxifen resistance through SP1-ERα interactions promoting recruitment to the proximal promoter of E2F1 in vitro [53]. In contrast, overexpression of E2F1 and its target genes was found to positively influence E2F1-mediated cell death in ER- breast cancer cells in vitro [52]. Our results indicate that the enhanced expression of E2F1 and SP1 target genes plays a role in the unfavorable lumA phenotype. Furthermore, we observed upregulation of different genes within the same SP1 gene set in ADAM10 lumA good prognosis group, but at a considerably lower level (Figure 6), hence revealing significant differences in cellular biological mechanisms between favorable and unfavorable phenotypes.
GATA3 is a transcription factor belonging to the GATA family, which is essential for cell-fate specification, i.e. luminal epithelial cell differentiation [54]. Moreover, GATA3 expression is favorable during carcinogenesis as it impedes the EMT and inhibits the metastasis of cancer cells [55]. Conversely, a lack of GATA3 leads to drug-resistance and a mesenchymal-like phenotype [56]. Our results show upregulation of GATA3 target genes in ADAM10, NOTCH1 and NOTCH3 lumA bad prognosis groups (Figure 7), but no significant upregulation in the TN subtype. GATA3 expression has been shown as impeding EMT; however, its upregulated targets may be somehow associated with a worse recurrence prognosis. Most importantly, our GSEA results reveal upregulation in gene sets associated more closely with cells undergoing EMT or with an executed mesenchymal phenotype among bad prognosis groups (Table 3). Our findings demonstrate the presence of unfavorable events typically associated with the transition between epithelial to mesenchymal phenotypes in bad prognosis groups of NOTCH1, NOTCH3 and ADAM10 in both subtypes.
Therefore, we assumed that worse prognosis stems from the potential of cells to switch to a less favorable mesenchymal phenotype; our findings revealed an upregulation of gene sets regarding canonical pathways, biological processes and molecular functions indicating EMT. Among the gene sets upregulated in the NOTCH1, NOTCH3 and ADAM10 unfavorable prognosis groups, a number of molecular markers of the mesenchymal phenotype were found to be not upregulated in good prognosis groups: VIM, MMP2, CDH2, ITGA5, FN1 and SPARC (Table 3). CGPs demonstrated differences in resistance or sensitivity to various treatment regimens according to prognosis group. In accordance with previous results, a common treatment response profile was found for the ADAM10, NOTCH1 and NOTCH3 unfavorable prognosis groups (Table 4). In addition, our initial assumptions were confirmed by the “metastasis through EMT” gene set being upregulated.
The study also evaluated the influence of the ADAM10, NOTCH1, NOTCH3, HES1, LFNG and PSEN1 genes on breast cancer recurrence. Cluster analysis was used to evaluate the common and unique expression profiles of genes transcriptionally activated by Notch TFs, such as HES1 and HEY1 (Supplementary File 8). Specifically, integrin, metalloprotease, collagen and desmoplakin genes involved in EMT were found to be activated; their expression indicated a mesenchymal phenotype in bad prognosis groups, that transition was in progress, or the presence of single changes associated with primary potential to undergo EMT (Figures 8 and 9, Table 5).
A class comparison was performed to compare genes associated with the studied phenotypes, with the results presented as Venn diagrams. ADAM10 group was excluded due to its outlier expression profile. The HES1/LFNG/PSEN1 favorable prognosis groups possessed no common upregulated genes but nine common downregulated genes (Figure 12), while the unfavorable prognosis groups only had one downregulated gene in common (F11R): a clear biological difference between lumA and TN tumors, as well as between Notch members. The NOTCH1/NOTCH3 unfavorable groups were found to have three common upregulated genes (MMP11, TAGLN, THB2) (Figure 13).
In summary, although the biology of BC has been well established, there is a lack of knowledge concerning the regulation of specific signaling pathways, as well as useful prognostic biomarkers, especially for DFS prognosis. The mechanisms of recurrence and roles of Notch in tumourigenesis of the breast are still unclear. Our findings indicate that the expression profiles of Notch pathway members can be used to differentiate the DFS in lumA and TN BC subtypes, and so may serve as novel prognostic biomarkers. Moreover, the study highlights significant new differences in the biology of the two tumors, and indicates that differences in the signals activating the Notch pathway result in the occurrence of common aberrant mechanisms, such as triggering EMT. It seems that aberrant expression and regulation of Notch receptors has the most significant influence on the course of disease. Notably, our results indicate that while there are subgroups of patients who will probably never experience disease relapse, other subgroups exist within the lumA subtype which have a higher risk of recurrence due to potential transition into mesenchymal cell type. Finally, it was found that MMP11, TAGLN and THB2, three genes involved in acquiring mesenchymal phenotype and which are regulated by the Notch pathway, can be used as potential therapeutic targets.
MATERIALS AND METHODS
The RNA-seq profiling (level 3 RNASeqV2, RSEM normalized) and clinical data of 1098 BC patients was obtained from The Cancer Genome Atlas (TCGA) data portal (http://cancergenome.nih.gov/, data status of Jan 28, 2016). The methods of biospecimen procurement, RNA isolation and RNA sequencing were previously described by The Cancer Genome Atlas Research Network [57].
The TCGA RNA-seq data was cross-referenced with the clinical information of the patients. Patients with missing clinical/expression values were excluded from further analyses. A total of 1081 samples were included in the study. The clinical characteristics of cohort patients are presented in Table 6.
Table 6: Clinical characteristics of lumA and TN BC cohort patients
Characteristic |
lumA |
TN |
||
|---|---|---|---|---|
Total |
% |
Total |
% |
|
Age at diagnosis |
|
|
|
|
median age (range) |
58 (28 – 90) |
53.5 (29 – 90) |
||
Race |
|
|
|
|
White |
270 |
73.6 |
68 |
59.6 |
Asian |
21 |
5.7 |
8 |
7 |
Black or African American |
29 |
7.9 |
31 |
27.2 |
NA’s |
47 |
12.8 |
7 |
6.1 |
Menopause status 1 |
|
|
|
|
premenopausal |
88 |
24 |
30 |
26.3 |
perimenopausal |
16 |
4.4 |
5 |
4.4 |
postmenopausal |
235 |
64 |
69 |
60.5 |
indeterminate |
1 |
0.3 |
2 |
1.8 |
NA’s |
27 |
7.4 |
8 |
7 |
Stage |
|
|
|
|
I |
72 |
19.6 |
20 |
17.5 |
II |
202 |
55 |
70 |
61.4 |
III |
84 |
22.9 |
19 |
16.7 |
IV |
3 |
0.8 |
2 |
1.8 |
x |
5 |
1.4 |
- |
- |
NA’s |
1 |
0.3 |
3 |
2.6 |
Histology |
|
|
|
|
infiltrating ductal carcinoma |
243 |
66.2 |
97 |
85.1 |
infiltrating lobular carcinoma |
88 |
24 |
3 |
2.6 |
metaplastic carcinoma |
1 |
0.3 |
5 |
4.4 |
mucinous carcinoma |
12 |
3.3 |
- |
- |
medullary carcinoma |
- |
- |
2 |
1.8 |
mixed histology |
9 |
2.5 |
1 |
0.9 |
other |
14 |
3.8 |
5 |
4.4 |
NA’s |
- |
- |
1 |
0.9 |
Therapy type |
|
|
|
|
chemotherapy |
149 |
40.6 |
81 |
71.1 |
hormone therapy |
119 |
32.4 |
- |
- |
immunotherapy |
2 |
0.5 |
- |
- |
other |
1 |
0.3 |
2 |
1.8 |
NA’s |
96 |
26.2 |
31 |
27.2 |
Primary lymph node presentation |
|
|
|
|
positive |
222 |
60.5 |
73 |
64 |
negative |
14 |
3.8 |
3 |
2.6 |
NA’s |
131 |
35.7 |
38 |
33.3 |
The clinical characteristics shown here are in whole based upon data generated by the TCGA Research Network: http://cancergenome.nih.gov/.
1 “Premenopausal” status defined as <6 months since last menstrual period (LMP) and no prior bilateral ovariectomy and not on estrogen replacement; “perimenopausal” status defined as 6-12 months since LMP; “postmenopausal” status defined as prior bilateral ovariectomy or >12 months since LMP with not prior hysterectomy; “indeterminate” status defined as neither pre- or postmenopausal.
To identify lumA and TN BC subtypes, the data was subsampled according to the following clinical parameters: “patient.breast_carcinoma_estrogen_receptor_status” for ER distribution, “patient.breast_carcinoma_progesterone_receptor_status” for PR distribution and “patient.lab_proc_her2_neu_immunohistochemistry_receptor_status” for HER2/neu distribution. Finally, patients with ER+PR+HER2- characteristics were classified as the lumA subgroup (367 patients) and ER-PR-HER2- (114 patients) as the TN subgroup.
Among all breast cancer patients, groups of lumA and TN BC data were identified to determine whether differential expression of 19 Notch signaling pathway members is associated with cancer recurrence. The analyzed genes and their functions in the Notch pathway are listed in Table 7. The analysis was based on optimal cutoff point determination, which enabled patients to be categorized according to favorable or unfavorable prognosis based on the expression of Notch members. The analysis was performed separately for each cancer subtype using the Cutoff Finder web application (http://molpath.charite.de/cutoff/). The clinical characteristics defining DFS were “patient.days_to_last_followup” for survival time and “patient.follow_ups.follow_up.person_neoplasm_cancer_status” for outcome and event.
Table 7: Notch pathway members and their functions used in the study
Gene |
||
|---|---|---|
Symbol |
Name |
Function |
ADAM10 |
Disintegrin and metalloproteinase domain-containing protein 10 |
Notch activator |
ADAM17 |
Disintegrin and metalloproteinase domain-containing protein 17 |
|
APH1B |
γ-secretase subunit APH-1B |
enzyme modulator |
DLK1 |
Protein delta homolog 1 |
non-canonical Notch ligand |
DLL4 |
Delta-like protein 4 |
canonical Notch ligand |
HES1 |
Transcription factor HES-1 |
transcription factor |
HES4 |
Transcription factor HES-4 |
|
HES5 |
Transcription factor HES-5 |
|
HEY1 |
Hairy/enhancer-of-split related with YRPW motif protein 1 |
|
JAG1 |
Protein jagged-1 |
mediator of Notch signalling |
JAG2 |
Protein jagged-2 |
|
LFNG |
β-1,3-N-acetylglucosaminyltransferase lunatic fringe |
Notch regulator |
NOTCH1 |
Neurogenic locus notch homolog protein 1 |
receptor |
NOTCH2 |
Neurogenic locus notch homolog protein 2 |
|
NOTCH3 |
Neurogenic locus notch homolog protein 3 |
|
NOTCH4 |
Neurogenic locus notch homolog protein 4 |
|
NUMB |
Protein numb homolog |
Notch antagonist |
PSEN1 |
Presenilin-1 |
γ-secretase complex member |
PSEN2 |
Presenilin-2 |
|
The descriptions of particular genes have been obtained from NCBI Gene Database: https://www.ncbi.nlm.nih.gov/gene/.
The significance of correlation with survival variable was chosen as the method for cutoff point optimization, briefly defined as the point with the most significant split. Additionally, hazard ratios (HRs) including 95% confidence intervals (CI) were calculated [58]. Differences in DFS between the Favorable and unfavorable groups, defined by the computed cutoff point for Notch member expression, were depicted using Kaplan-Meier curves with calculated p-values (log-rank test, p<0.05).
GSEA was performed to determine the biological significance in terms of KEGG canonical pathways, CGP, TF binding motifs and gene ontology (GO): biological processes (BP), cellular components (CC), and molecular functions (MF) [59]. Enrichment analysis was performed for 20502 genes. Phenotype labels, defined as good or bad prognosis according to the computed cutoff point for each Notch pathway member, were determined for both lumA and TN BC. Additionally, to elicit the most relevant associations of differential Notch signaling, groups of patients with the extreme values of particular Notch member expression were chosen (first and fourth quartile regarding the expression level). Enrichment was subjected to GSEA by applying tTest with a weighted scoring scheme and permutation type regarding phenotype, using the significance threshold of FDR<0.25.
ExpressCluster software (http://cbdm.hms.harvard.edu/) was used to find common and unique expression profiles of genes activated by Notch transcription factors (HES, HEY families). A total of 9346 HES1 and HEY1 targets were extracted from MSigDB on the basis of presence of binding motifs for both TFs. Clustering was performed by applying the K-means algorithm, mean centered signal transformation and Euclidean distance metric. Profiles indicating contrasts between lumA and TN BC or genes associated with favorable/unfavorable prognosis were considered as significant.
Further associations between common and contrasting genes were visualized using the VennDiagram Generator web application (http://www.bioinformatics.lu/venn.php).
Additionally, we performed cross - validation of our findings based on independent BC cohorts obtained from USCS Xena as well as uni - and multivariate Cox analyses to assess if any of clinical characteristics including Notch signaling may have independent prognostic value. Further details may be found in Supplementary Materials.
CONFLICTS OF INTEREST
The authors declare no conflicts of interest.
FUNDING
This work was funded by the Medical University of Lodz (grant no. 503/0-078-02/503-01-003).
REFERENCES
1. Perou CM, Sorlie T, Eisen MB, van de Rijn M, Jeffrey SS, Rees CA, Pollack JR, Ross DT, Johnsen H, Akslen LA, Fluge O, Pergamenschikov A, Williams C, et al. Molecular portraits of human breast tumours. Nature. 2000; 406: 747-52.
2. Hu Z, Fan C, Oh DS, Marron JS, He X, Qaqish BF, Livasy C, Carey LA, Reynolds E, Dressler L, Nobel A, Parker J, Ewend MG, et al. The molecular portraits of breast tumors are conserved across microarray platforms. BMC Genomics. 2006; 7: 96.
3. Sorlie T, Tibshirani R, Parker J, Hastie T, Marron JS, Nobel A, Deng S, Johnsen H, Pesich R, Geisler S, Demeter J, Perou CM, Lonning PE, et al. Repeated observation of breast tumor subtypes in independent gene expression data sets. Proc Natl Acad Sci U S A. 2003; 100: 8418-23.
4. Sorlie T, Perou CM, Tibshirani R, Aas T, Geisler S, Johnsen H, Hastie T, Eisen MB, van de Rijn M, Jeffrey SS, Thorsen T, Quist H, Matese JC, et al. Gene expression patterns of breast carcinomas distinguish tumor subclasses with clinical implications. Proc Natl Acad Sci U S A. 2001; 98: 10869-74.
5. Nielsen TO, Hsu FD, Jensen K, Cheang M, Karaca G, Hu Z, Hernandez-Boussard T, Livasy C, Cowan D, Dressler L, Akslen LA, Ragaz J, Gown AM, et al. Immunohistochemical and clinical characterization of the basal-like subtype of invasive breast carcinoma. Clin Cancer Res. 2004; 10: 5367-74.
6. Badve S, Dabbs DJ, Schnitt SJ, Baehner FL, Decker T, Eusebi V, Fox SB, Ichihara S, Jacquemier J, Lakhani SR, Palacios J, Rakha EA, Richardson AL, et al. Basal-like and triple-negative breast cancers: a critical review with an emphasis on the implications for pathologists and oncologists. Mod Pathol. 2011; 24: 157-67.
7. Artavanis-Tsakonas S, Rand MD, Lake RJ. Notch signaling: cell fate control and signal integration in development. Science. 1999; 284: 770-6.
8. Guruharsha KG, Kankel MW, Artavanis-Tsakonas S. The Notch signalling system: recent insights into the complexity of a conserved pathway. Nat Rev Genet. 2012; 13: 654-66.
9. Andersson ER, Sandberg R, Lendahl U. Notch signaling: simplicity in design, versatility in function. Development. 2011; 138: 3593-612.
10. Previs RA, Coleman RL, Harris AL, Sood AK. Molecular pathways: translational and therapeutic implications of the Notch signaling pathway in cancer. Clin Cancer Res. 2015; 21: 955-61.
11. Touplikioti P, Chondronasiou D, Ziouti F, Koubanaki M, Haitoglou K, Kouvatseas G, Papazisis KT. Expression of Notch receptors in primary breast cancer and correlation with pathological features. Clinical & Experimental Pharmacology. 2012; 2012.
12. Parr C, Watkins G, Jiang WG. The possible correlation of Notch-1 and Notch-2 with clinical outcome and tumour clinicopathological parameters in human breast cancer. Int J Mol Med. 2004; 14: 779-86.
13. O'Neill CF, Urs S, Cinelli C, Lincoln A, Nadeau RJ, Leon R, Toher J, Mouta-Bellum C, Friesel RE, Liaw L. Notch2 signaling induces apoptosis and inhibits human MDA-MB-231 xenograft growth. Am J Pathol. 2007; 171: 1023-36.
14. Reedijk M, Odorcic S, Chang L, Zhang H, Miller N, McCready DR, Lockwood G, Egan SE. High-level coexpression of JAG1 and NOTCH1 is observed in human breast cancer and is associated with poor overall survival. Cancer Res. 2005; 65: 8530-7.
15. Pece S, Serresi M, Santolini E, Capra M, Hulleman E, Galimberti V, Zurrida S, Maisonneuve P, Viale G, Di Fiore PP. Loss of negative regulation by Numb over Notch is relevant to human breast carcinogenesis. J Cell Biol. 2004; 167: 215-21.
16. Kalluri R, Neilson EG. Epithelial-mesenchymal transition and its implications for fibrosis. J Clin Invest. 2003; 112: 1776-84.
17. Thiery JP, Acloque H, Huang RY, Nieto MA. Epithelial-mesenchymal transitions in development and disease. Cell. 2009; 139: 871-90.
18. Nistico P, Bissell MJ, Radisky DC. Epithelial-mesenchymal transition: general principles and pathological relevance with special emphasis on the role of matrix metalloproteinases. Cold Spring Harb Perspect Biol. 2012; 4.
19. Peinado H, Portillo F, Cano A. Transcriptional regulation of cadherins during development and carcinogenesis. Int J Dev Biol. 2004; 48: 365-75.
20. Wang T, Xuan X, Pian L, Gao P, Hu H, Zheng Y, Zang W, Zhao G. Notch-1-mediated esophageal carcinoma EC-9706 cell invasion and metastasis by inducing epithelial-mesenchymal transition through Snail. Tumour Biol. 2014; 35: 1193-201.
21. Gopalakrishnan N, Sivasithamparam ND, Devaraj H. Synergistic association of Notch and NFkappaB signaling and role of Notch signaling in modulating epithelial to mesenchymal transition in colorectal adenocarcinoma. Biochimie. 2014; 107 Pt B: 310-8.
22. Zhou J, Jain S, Azad AK, Xu X, Yu HC, Xu Z, Godbout R, Fu Y. Notch and TGFbeta form a positive regulatory loop and regulate EMT in epithelial ovarian cancer cells. Cell Signal. 2016; 28: 838-49.
23. Girard L, Hanna Z, Beaulieu N, Hoemann CD, Simard C, Kozak CA, Jolicoeur P. Frequent provirus insertional mutagenesis of Notch1 in thymomas of MMTVD/myc transgenic mice suggests a collaboration of c-myc and Notch1 for oncogenesis. Genes Dev. 1996; 10: 1930-44.
24. Weijzen S, Rizzo P, Braid M, Vaishnav R, Jonkheer SM, Zlobin A, Osborne BA, Gottipati S, Aster JC, Hahn WC, Rudolf M, Siziopikou K, Kast WM, et al. Activation of Notch-1 signaling maintains the neoplastic phenotype in human Ras-transformed cells. Nat Med. 2002; 8: 979-86.
25. Cohen B, Shimizu M, Izrailit J, Ng NF, Buchman Y, Pan JG, Dering J, Reedijk M. Cyclin D1 is a direct target of JAG1-mediated Notch signaling in breast cancer. Breast Cancer Res Treat. 2010; 123: 113-24.
26. Xu J, Song F, Jin T, Qin J, Wu J, Wang M, Wang Y, Liu J. Prognostic values of Notch receptors in breast cancer. Tumour Biol. 2016; 37: 1871-7.
27. Hu C, Dievart A, Lupien M, Calvo E, Tremblay G, Jolicoeur P. Overexpression of activated murine Notch1 and Notch3 in transgenic mice blocks mammary gland development and induces mammary tumors. Am J Pathol. 2006; 168: 973-90.
28. Yamaguchi N, Oyama T, Ito E, Satoh H, Azuma S, Hayashi M, Shimizu K, Honma R, Yanagisawa Y, Nishikawa A, Kawamura M, Imai J, Ohwada S, et al. NOTCH3 signaling pathway plays crucial roles in the proliferation of ErbB2-negative human breast cancer cells. Cancer Res. 2008; 68: 1881-8.
29. Zhang Z, Wang H, Ikeda S, Fahey F, Bielenberg D, Smits P, Hauschka PV. Notch3 in human breast cancer cell lines regulates osteoblast-cancer cell interactions and osteolytic bone metastasis. Am J Pathol. 2010; 177: 1459-69.
30. Reiss K, Maretzky T, Ludwig A, Tousseyn T, de Strooper B, Hartmann D, Saftig P. ADAM10 cleavage of N-cadherin and regulation of cell-cell adhesion and beta-catenin nuclear signalling. EMBO J. 2005; 24: 742-52.
31. Maretzky T, Reiss K, Ludwig A, Buchholz J, Scholz F, Proksch E, de Strooper B, Hartmann D, Saftig P. ADAM10 mediates E-cadherin shedding and regulates epithelial cell-cell adhesion, migration, and beta-catenin translocation. Proc Natl Acad Sci U S A. 2005; 102: 9182-7.
32. Moss ML, Stoeck A, Yan W, Dempsey PJ. ADAM10 as a target for anti-cancer therapy. Curr Pharm Biotechnol. 2008; 9: 2-8.
33. Sahin U, Weskamp G, Kelly K, Zhou HM, Higashiyama S, Peschon J, Hartmann D, Saftig P, Blobel CP. Distinct roles for ADAM10 and ADAM17 in ectodomain shedding of six EGFR ligands. J Cell Biol. 2004; 164: 769-79.
34. Wang YY, Ye ZY, Li L, Zhao ZS, Shao QS, Tao HQ. ADAM 10 is associated with gastric cancer progression and prognosis of patients. J Surg Oncol. 2011; 103: 116-23.
35. McCulloch DR, Akl P, Samaratunga H, Herington AC, Odorico DM. Expression of the disintegrin metalloprotease, ADAM-10, in prostate cancer and its regulation by dihydrotestosterone, insulin-like growth factor I, and epidermal growth factor in the prostate cancer cell model LNCaP. Clin Cancer Res. 2004; 10: 314-23.
36. Bai S, Nasser MW, Wang B, Hsu SH, Datta J, Kutay H, Yadav A, Nuovo G, Kumar P, Ghoshal K. MicroRNA-122 inhibits tumorigenic properties of hepatocellular carcinoma cells and sensitizes these cells to sorafenib. J Biol Chem. 2009; 284: 32015-27.
37. Feldinger K, Generali D, Kramer-Marek G, Gijsen M, Ng TB, Wong JH, Strina C, Cappelletti M, Andreis D, Li JL, Bridges E, Turley H, Leek R, et al. ADAM10 mediates trastuzumab resistance and is correlated with survival in HER2 positive breast cancer. Oncotarget. 2014; 5: 6633-46. doi: 10.18632/oncotarget.1955.
38. Haines N, Irvine KD. Glycosylation regulates Notch signalling. Nat Rev Mol Cell Biol. 2003; 4: 786-97.
39. Raouf A, Zhao Y, To K, Stingl J, Delaney A, Barbara M, Iscove N, Jones S, McKinney S, Emerman J, Aparicio S, Marra M, Eaves C. Transcriptome analysis of the normal human mammary cell commitment and differentiation process. Cell Stem Cell. 2008; 3: 109-18.
40. Dong Y, Li A, Wang J, Weber JD, Michel LS. Synthetic lethality through combined Notch-epidermal growth factor receptor pathway inhibition in basal-like breast cancer. Cancer Res. 2010; 70: 5465-74.
41. Stylianou S, Clarke RB, Brennan K. Aberrant activation of notch signaling in human breast cancer. Cancer Res. 2006; 66: 1517-25.
42. Shimojo H, Ohtsuka T, Kageyama R. Oscillations in notch signaling regulate maintenance of neural progenitors. Neuron. 2008; 58: 52-64.
43. Strom A, Arai N, Leers J, Gustafsson JA. The Hairy and Enhancer of Split homologue-1 (HES-1) mediates the proliferative effect of 17beta-estradiol on breast cancer cell lines. Oncogene. 2000; 19: 5951-3.
44. Kobayashi T, Kageyama R. Hes1 regulates embryonic stem cell differentiation by suppressing Notch signaling. Genes Cells. 2010; 15: 689-98.
45. So JY, Wahler J, Das Gupta S, Salerno DM, Maehr H, Uskokovic M, Suh N. HES1-mediated inhibition of Notch1 signaling by a Gemini vitamin D analog leads to decreased CD44(+)/CD24(-/low) tumor-initiating subpopulation in basal-like breast cancer. J Steroid Biochem Mol Biol. 2015; 148: 111-21.
46. Duff K, Eckman C, Zehr C, Yu X, Prada CM, Perez-tur J, Hutton M, Buee L, Harigaya Y, Yager D, Morgan D, Gordon MN, Holcomb L, et al. Increased amyloid-beta42(43) in brains of mice expressing mutant presenilin 1. Nature. 1996; 383: 710-3.
47. Rizzo P, Miao H, D'Souza G, Osipo C, Song LL, Yun J, Zhao H, Mascarenhas J, Wyatt D, Antico G, Hao L, Yao K, Rajan P, et al. Cross-talk between notch and the estrogen receptor in breast cancer suggests novel therapeutic approaches. Cancer Res. 2008; 68: 5226-35.
48. Dai X, Li T, Bai Z, Yang Y, Liu X, Zhan J, Shi B. Breast cancer intrinsic subtype classification, clinical use and future trends. Am J Cancer Res. 2015; 5: 2929-43.
49. Attwooll C, Lazzerini Denchi E, Helin K. The E2F family: specific functions and overlapping interests. EMBO J. 2004; 23: 4709-16.
50. Hallstrom TC, Mori S, Nevins JR. An E2F1-dependent gene expression program that determines the balance between proliferation and cell death. Cancer Cell. 2008; 13: 11-22.
51. Hollern DP, Honeysett J, Cardiff RD, Andrechek ER. The E2F transcription factors regulate tumor development and metastasis in a mouse model of metastatic breast cancer. Mol Cell Biol. 2014; 34: 3229-43.
52. Montenegro MF, Collado-Gonzalez Mdel M, Fernandez-Perez MP, Hammouda MB, Tolordava L, Gamkrelidze M, Rodriguez-Lopez JN. Promoting E2F1-mediated apoptosis in oestrogen receptor-alpha-negative breast cancer cells. BMC Cancer. 2014; 14: 539.
53. Louie MC, McClellan A, Siewit C, Kawabata L. Estrogen receptor regulates E2F1 expression to mediate tamoxifen resistance. Mol Cancer Res. 2010; 8: 343-52.
54. Kouros-Mehr H, Slorach EM, Sternlicht MD, Werb Z. GATA-3 maintains the differentiation of the luminal cell fate in the mammary gland. Cell. 2006; 127: 1041-55.
55. Si W, Huang W, Zheng Y, Yang Y, Liu X, Shan L, Zhou X, Wang Y, Su D, Gao J, Yan R, Han X, Li W, et al. Dysfunction of the Reciprocal Feedback Loop between GATA3- and ZEB2-Nucleated Repression Programs Contributes to Breast Cancer Metastasis. Cancer Cell. 2015; 27: 822-36.
56. Asch-Kendrick R, Cimino-Mathews A. The role of GATA3 in breast carcinomas: a review. Hum Pathol. 2016; 48: 37-47.
57. Ciriello G, Gatza ML, Beck AH, Wilkerson MD, Rhie SK, Pastore A, Zhang H, McLellan M, Yau C, Kandoth C, Bowlby R, Shen H, Hayat S, et al. Comprehensive Molecular Portraits of Invasive Lobular Breast Cancer. Cell. 2015; 163: 506-19.
58. Budczies J, Klauschen F, Sinn BV, Gyorffy B, Schmitt WD, Darb-Esfahani S, Denkert C. Cutoff Finder: a comprehensive and straightforward Web application enabling rapid biomarker cutoff optimization. PLoS One. 2012; 7: e51862.
59. Subramanian A, Tamayo P, Mootha VK, Mukherjee S, Ebert BL, Gillette MA, Paulovich A, Pomeroy SL, Golub TR, Lander ES, Mesirov JP. Gene set enrichment analysis: a knowledge-based approach for interpreting genome-wide expression profiles. Proc Natl Acad Sci U S A. 2005; 102: 15545-50.