
INTRODUCTION
Breast cancer is the most common malignancy tumor among women, which accounts for 25% of all cancer cases in women all over the world, and it is the principal cause of female cancer-related death [1]. In the United States alone, a total of more than 2.8 million women suffered from breast cancer in 2015, and the morbidity of breast cancer is still increasing fast in recent years, so breast cancer has become a serious threat to the health and life of women worldwide [2]. The occurrence and development of breast cancer is a multistep, multistage complicated process involving multiple factors, among which genetic factors are considered to play a crucial role [3]. Consequently, identifying susceptible gene of breast cancer is of great importance, which can lead to better diagnosis, treatment and possible prevention of breast cancer.
MicroRNAs (miRNAs) are a class of non-coding single-stranded RNA molecules of about twenty-two nucleotides encoded by endogenous genes. By binding to the complementary sequence of the 3’ untranslated region of the specific target gene mRNA, microRNAs can degrade mRNA or inhibit its translation, and thus regulate the expression of target gene [4]. MiRNAs are highly conserved, tissue-specific and taking part in the regulation of many physiological and pathological process, such as cell differentiation, cell proliferation, cell apoptosis, fat metabolism, etc [5, 6]. MiRNAs have many important functions: among them, the function of microRNAs in cancer occurrence and progression attracts the most attention [7].
Studies have reported that single nucleotide polymorphisms (SNPs) or genetic mutations occurring in miRNAs could affect the efficiency of miRNA binding to the target sites of mRNA and alter the expression of related gene, which may involve acquisition of cancer susceptibility, so miRNAs play an important role in initiation and development of malignancies [8]. So far there are many studies about microRNA polymorphisms (miR-499 rs3746444, miR-196a rs11614913 and miR-146a rs2910164) and breast cancer susceptibility, but the results are controversial [9–26]. In addition, two meta-analyses on this issue published in 2013 and 2015 yielded inconsistent results: one reported that rs3746444 and rs2910164 were not associated with breast cancer risk [27], while another showed that these two microRNA polymorphisms could increase breast cancer susceptibility [28]. Therefore, we conducted this meta-analysis including some latest studies to make a more accurate and comprehensive assessment of these three polymorphisms and breast cancer risk.
RESULTS
Characteristics of included studies
The complete search process is presented in Figure 1. A total of 242 publications were preliminarily identified according to the search strategy described in the methods and materials section. After removing duplicate articles, 168 records remained. Then we read titles and abstracts of all the studies and excluded 145 articles that were obviously unrelated. After carefully reviewing the full texts of the remaining articles, an additional five articles were excluded, including two articles that had no sufficient data and three articles that contained re-reported data. Ultimately, thirty-eight eligible studies from eighteen remaining articles [9–26], including 17,417 cases and 18,988 cancer-free controls, were eventually included in our meta-analysis. The characteristics of the thirty-eight eligible studies are presented in Table 1. Among these included studies, twenty-five were performed in Asians [9, 11–16, 20–22], twelve in Caucasians [10, 17–18, 23–26], and one in mixed ethnicity [19]. All the cases in the included studies were in accordance with the pathological diagnostic criteria of breast cancer and all the papers were published between 2009 and 2016.
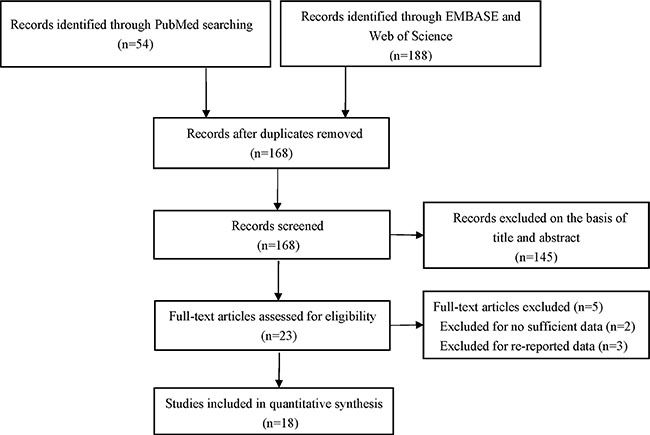
Figure 1: Flow diagram of the selection of the studies in this meta-analysis.
Table 1: Characteristics of studies included in the meta-analysis
First author |
Year |
Country |
Ethnicity |
Genotyping method |
Number (case/control) |
HWE (P value) |
|---|---|---|---|---|---|---|
rs3746444 |
||||||
Hu[9] |
2009 |
China |
Asian |
PCR-RFLP |
1009/1093 |
0.057 |
Catucci[10] |
2010 |
Italy |
Caucasian |
Taqman |
756/1242 |
0.250 |
Catucci[10] |
2010 |
Germany |
Caucasian |
Taqman |
823/925 |
0.893 |
Alshatwi[11] |
2012 |
Saudi |
Asian |
Taqman |
100/100 |
0.227 |
Bansal[12] |
2014 |
India |
Asian |
PCR-RFLP |
121/164 |
0.261 |
Omrani[13] |
2014 |
Iran |
Asian |
TARMS-PCR |
236/203 |
0.241 |
Qi[14] |
2015 |
China |
Asian |
Taqman |
321/290 |
0.053 |
He[15] |
2015 |
China |
Asian |
MassARRAY |
450/450 |
0.143 |
Dai[16] |
2016 |
China |
Asian |
MassARRAY |
560/583 |
0.131 |
rs11614913 |
||||||
Hu[9] |
2009 |
China |
Asian |
PCR-RFLP |
1009/1093 |
0.210 |
Hoffman[17] |
2009 |
USA |
Caucasian |
MassARRAY |
426/466 |
0.583 |
Catucci[10] |
2010 |
Italy |
Caucasian |
Taqman |
751/1243 |
0.315 |
Catucci[10] |
2010 |
Germany |
Caucasian |
Taqman |
1101/1496 |
0.711 |
Jedlinski[18] |
2011 |
Australia |
Caucasian |
PCR-RFLP |
187/171 |
0.830 |
Alshatwi[11] |
2012 |
Saudi |
Asian |
Taqman |
100/100 |
0.032 |
Linhares[19] |
2012 |
Brazil |
Mixed |
Taqman |
388/388 |
0.005 |
Zhang[20] |
2012 |
China |
Asian |
PCR-RFLP |
248/243 |
0.893 |
Ma[21] |
2013 |
China |
Asian |
MassARRAY |
190/187 |
0.037 |
Bansal[12] |
2014 |
India |
Asian |
PCR-RFLP |
121/165 |
0.042 |
Omrani[13] |
2014 |
Iran |
Asian |
TARMS-PCR |
236/203 |
0.000 |
Qi[14] |
2015 |
China |
Asian |
Taqman |
321/290 |
0.141 |
He[15] |
2015 |
China |
Asian |
MassARRAY |
450/450 |
0.990 |
Zhang[22] |
2015 |
China |
Asian |
MassARRAY |
379/187 |
0.037 |
Dai[16] |
2016 |
China |
Asian |
MassARRAY |
560/583 |
0.540 |
Morales[23] |
2016 |
Chile |
Caucasian |
Taqman |
440/807 |
0.121 |
rs2910164 |
||||||
Hu[13] |
2009 |
China |
Asian |
PCR-RFLP |
1009/1093 |
0.221 |
Catucci[10] |
2010 |
Germany |
Caucasian |
Taqman |
805/904 |
0.753 |
Catucci[10] |
2010 |
Italy |
Caucasian |
Taqman |
754/1243 |
0.019 |
Pastrello[24] |
2010 |
Italy |
Caucasian |
Sequencing |
88/155 |
0.332 |
Garcia[25] |
2011 |
France |
Caucasian |
Taqman |
1130/596 |
0.150 |
Alshatwi[11] |
2012 |
Saudi |
Asian |
Taqman |
100/100 |
0.051 |
Ma[21] |
2013 |
China |
Asian |
MassARRAY |
192/191 |
0.983 |
Bansal[12] |
2014 |
India |
Asian |
PCR-RFLP |
121/164 |
0.130 |
Omrani[13] |
2014 |
Iran |
Asian |
TARMS-PCR |
236/203 |
0.000 |
Qi[14] |
2015 |
China |
Asian |
Taqman |
321/290 |
0.013 |
He[15] |
2015 |
China |
Asian |
MassARRAY |
450/490 |
0.478 |
Zhang[22] |
2015 |
China |
Asian |
MassARRAY |
382/191 |
0.983 |
Upadhyaya[26] |
2015 |
Australia |
Caucasian |
HRM |
546/246 |
0.091 |
Abbreviations: HWE: Hardy-Weinberg equilibrium for controls. PCR-RFLP: polymerase chain reaction-restriction fragment length polymorphism. TARMS-PCR: tetra-primer amplification refractory mutation system-polymerase chain reaction. HRM: High ResolutionMelting.
Meta-analysis results
Distribution and allele frequency of these three microRNA polymorphisms in cases and controls are shown in Table 2, and the main results of this meta-analysis are presented in Table 3. For rs3746444, the nine eligible studies with 4,376 breast cancer patients and 5,050 cancer-free controls were finally included. As shown in Table 3, we observed an increased breast cancer risk associated with rs3746444 polymorphism in the four genetic models: allele contrast genetic model (OR = 1.17, 95% CI = 1.04–1.31, P = 0.008), homozygote genetic model (OR = 1.41, 95% CI = 1.19–1.67, P < 0.001), heterozygote genetic model (OR = 1.10, 95% CI = 1.01–1.21, P = 0.036), and dominant genetic model (OR = 1.16, 95% CI = 1.06–1.26, P = 0.001). The stratified analysis by ethnicity showed an increased BC risk in Asians (allele contrast genetic model: OR = 1.08, 95% CI = 1.03–1.14, P = 0.001; homozygote genetic model: OR = 1.11, 95% CI = 1.03–1.21, P = 0.009; heterozygote genetic model: OR = 1.11, 95% CI = 1.03–1.20, P = 0.008; dominant genetic model: OR = 1.17, 95% CI = 1.07–1.29, P = 0.001). However, no meaningful correlation was observed in Caucasians (Table 3) (Figure 2).
Table 2: Genotype distribution and allele frequency of these three microRNA polymorphisms (miR-499 rs3746444, miR-196a rs11614913 and miR-146a rs2910164) in cases and controls
First author |
||||||||||||
|---|---|---|---|---|---|---|---|---|---|---|---|---|
Genotype (N) |
Allele frequency (N) |
|||||||||||
Case |
Control |
Case |
Control |
|||||||||
Total |
AA |
AB |
BB |
Total |
AA |
AB |
BB |
A |
B |
A |
B |
|
miR-499 rs3746444 |
||||||||||||
Hu |
1009 |
707 |
258 |
44 |
1093 |
816 |
248 |
29 |
1672 |
346 |
1880 |
306 |
Catucci |
756 |
414 |
295 |
47 |
1242 |
704 |
452 |
86 |
1123 |
389 |
1860 |
624 |
Catucci |
823 |
536 |
250 |
37 |
925 |
601 |
290 |
34 |
1322 |
324 |
1492 |
358 |
Alshatwi |
100 |
30 |
62 |
8 |
100 |
45 |
40 |
15 |
78 |
122 |
70 |
130 |
Bansal |
121 |
80 |
30 |
11 |
164 |
106 |
43 |
15 |
190 |
52 |
255 |
73 |
Omrani |
236 |
131 |
44 |
61 |
203 |
130 |
48 |
25 |
306 |
166 |
308 |
98 |
Qi |
321 |
152 |
117 |
52 |
290 |
141 |
112 |
37 |
421 |
221 |
394 |
186 |
He |
450 |
184 |
177 |
89 |
450 |
203 |
188 |
59 |
545 |
355 |
594 |
306 |
Dai |
560 |
407 |
135 |
18 |
583 |
463 |
109 |
11 |
949 |
171 |
1035 |
131 |
miR-196a rs11614913 |
||||||||||||
Hu |
1009 |
287 |
483 |
239 |
1093 |
358 |
517 |
218 |
1057 |
961 |
1233 |
953 |
Hoffman |
426 |
181 |
209 |
36 |
466 |
166 |
229 |
71 |
571 |
281 |
561 |
371 |
Catucci |
751 |
334 |
330 |
87 |
1243 |
532 |
550 |
161 |
998 |
504 |
1614 |
872 |
Catucci |
1101 |
432 |
512 |
157 |
1496 |
584 |
696 |
216 |
1376 |
826 |
1864 |
1128 |
Jedlinski |
187 |
68 |
86 |
33 |
171 |
58 |
82 |
31 |
222 |
152 |
198 |
144 |
Alshatwi |
100 |
35 |
63 |
2 |
100 |
46 |
50 |
4 |
133 |
67 |
142 |
58 |
Linhares |
388 |
94 |
177 |
117 |
388 |
127 |
165 |
96 |
365 |
411 |
419 |
357 |
Zhang |
248 |
148 |
89 |
11 |
243 |
133 |
93 |
17 |
385 |
111 |
359 |
127 |
Ma |
190 |
54 |
92 |
44 |
187 |
59 |
79 |
49 |
200 |
180 |
197 |
177 |
Bansal |
121 |
68 |
41 |
12 |
165 |
85 |
59 |
21 |
177 |
65 |
229 |
101 |
Omrani |
236 |
218 |
18 |
0 |
203 |
178 |
25 |
0 |
454 |
18 |
381 |
25 |
Qi |
321 |
168 |
119 |
34 |
290 |
185 |
88 |
17 |
455 |
187 |
458 |
122 |
He |
450 |
81 |
233 |
136 |
450 |
93 |
223 |
134 |
395 |
505 |
409 |
491 |
Zhang |
379 |
108 |
181 |
90 |
187 |
59 |
79 |
49 |
397 |
361 |
197 |
177 |
Dai |
560 |
197 |
265 |
98 |
583 |
155 |
284 |
144 |
659 |
461 |
594 |
572 |
Morales |
440 |
192 |
191 |
57 |
807 |
342 |
351 |
114 |
575 |
305 |
1035 |
579 |
miR-146a rs2910164 |
||||||||||||
Hu |
1009 |
329 |
515 |
165 |
1093 |
362 |
551 |
180 |
1173 |
845 |
1275 |
911 |
Catucci |
805 |
451 |
304 |
50 |
904 |
536 |
318 |
50 |
1206 |
404 |
1390 |
418 |
Catucci |
754 |
409 |
286 |
59 |
1243 |
650 |
520 |
73 |
1104 |
404 |
1820 |
666 |
Pastrello |
88 |
53 |
30 |
5 |
155 |
90 |
59 |
6 |
136 |
40 |
239 |
71 |
Garcia |
1130 |
676 |
388 |
66 |
596 |
352 |
220 |
24 |
1740 |
520 |
924 |
268 |
Alshatwi |
100 |
48 |
50 |
2 |
100 |
51 |
46 |
3 |
146 |
54 |
148 |
52 |
Ma |
192 |
63 |
94 |
35 |
191 |
64 |
93 |
34 |
220 |
164 |
221 |
161 |
Bansal |
121 |
82 |
35 |
4 |
164 |
84 |
72 |
8 |
199 |
43 |
240 |
88 |
Omrani |
236 |
183 |
45 |
8 |
203 |
155 |
39 |
9 |
411 |
61 |
349 |
57 |
Qi |
321 |
146 |
132 |
43 |
290 |
126 |
144 |
20 |
424 |
218 |
396 |
184 |
He |
450 |
75 |
242 |
133 |
490 |
112 |
225 |
153 |
392 |
508 |
449 |
531 |
Zhang |
382 |
126 |
181 |
75 |
191 |
64 |
93 |
34 |
433 |
331 |
221 |
161 |
Upadhyaya |
546 |
325 |
193 |
28 |
246 |
112 |
99 |
35 |
843 |
249 |
323 |
169 |
A: the major allele; B: the minor allele.
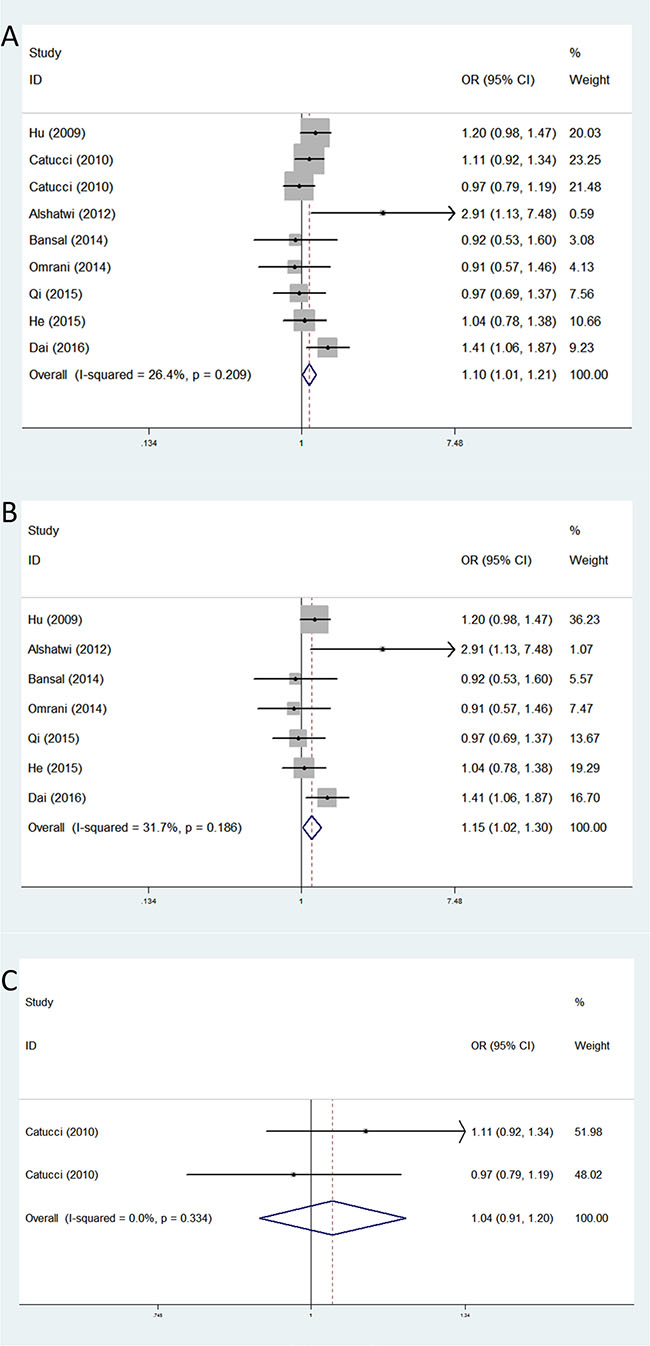
Figure 2: Forest plots of associations between rs3746444 and breast cancer risk among different ethnic groups in heterozygote genetic model. (A) the overall populations; (B) Asians; (C) Caucasians.
Table 3: Meta-analysis results
Comparisons |
OR |
95%CI |
P(OR) I2 |
Heterogeneity |
Effects model |
P(Begg) |
P(Egger) |
|
|---|---|---|---|---|---|---|---|---|
P |
||||||||
Allele contrast genetic model |
||||||||
rs3746444 |
1.17 |
1.04–1.31 |
0.008 |
58% |
0.014 |
R |
0.602 |
0.796 |
Asian |
1.24 |
1.08–1.42 |
0.002 |
48% |
0.071 |
R |
- |
- |
Caucasian |
1.03 |
0.92–1.15 |
0.628 |
0% |
0.924 |
F |
- |
- |
rs11614913 |
0.98 |
0.89–1.09 |
0.748 |
73% |
0.000 |
R |
0.753 |
0.718 |
Asian |
0.99 |
0.85–1.17 |
0.932 |
76% |
0.000 |
R |
- |
- |
Caucasian |
0.93 |
0.87–1.00 |
0.044 |
37% |
0.173 |
F |
- |
- |
rs2910164 |
0.97 |
0.87–1.07 |
0.510 |
64% |
0.001 |
R |
0.161 |
0.292 |
Asian |
1.02 |
0.94–1.10 |
0.702 |
16% |
0.303 |
F |
- |
- |
Caucasian |
0.92 |
0.74–1.14 |
0.453 |
84% |
0.000 |
R |
- |
- |
Homozygote genetic model |
||||||||
rs3746444 |
1.41 |
1.19–1.67 |
0.000 |
34% |
0.147 |
F |
1.000 |
0.768 |
Asian |
1.64 |
1.34–2.02 |
0.000 |
0% |
0.543 |
F |
- |
- |
Caucasian |
1.03 |
0.77–1.38 |
0.844 |
0% |
0.381 |
F |
- |
- |
rs11614913 |
0.95 |
0.77–1.16 |
0.600 |
71% |
0.000 |
R |
0.488 |
0.538 |
Asian |
0.98 |
0.71–1.34 |
0.877 |
73% |
0.000 |
R |
- |
- |
Caucasian |
0.85 |
0.73–0.99 |
0.037 |
52% |
0.080 |
R |
- |
- |
rs2910164 |
1.03 |
0.80–1.33 |
0.804 |
64% |
0.001 |
R |
0.246 |
0.554 |
Asian |
1.11 |
0.94–1.32 |
0.221 |
0% |
0.474 |
F |
- |
- |
Caucasian |
0.95 |
0.52–1.72 |
0.862 |
85% |
0.000 |
R |
- |
- |
Heterozygote genetic model |
||||||||
rs3746444 |
1.10 |
1.01–1.21 |
0.036 |
26% |
0.209 |
F |
1.000 |
0.610 |
Asian |
1.15 |
1.02–1.30 |
0.022 |
32% |
0.186 |
F |
- |
- |
Caucasian |
1.04 |
0.91–1.20 |
0.572 |
0% |
0.334 |
F |
- |
- |
rs11614913 |
1.03 |
0.92–1.15 |
0.577 |
47% |
0.019 |
R |
0.964 |
0.671 |
Asian |
1.07 |
0.89–1.28 |
0.481 |
57% |
0.014 |
R |
- |
- |
Caucasian |
0.95 |
0.86–1.06 |
0.348 |
0% |
0.887 |
F |
- |
- |
rs2910164 |
0.95 |
0.83–1.08 |
0.403 |
54% |
0.011 |
R |
0.951 |
0.598 |
Asian |
0.98 |
0.80–1.20 |
0.866 |
58% |
0.019 |
R |
- |
- |
Caucasian |
0.91 |
0.77–1.07 |
0.241 |
51% |
0.085 |
R |
- |
- |
Dominant genetic model |
||||||||
rs3746444 |
1.16 |
1.06–1.26 |
0.001 |
19% |
0.272 |
F |
0.466 |
0.332 |
Asian |
1.25 |
1.12–1.40 |
0.000 |
0% |
0.509 |
F |
- |
- |
Caucasian |
1.04 |
0.91–1.89 |
0.569 |
0% |
0.536 |
F |
- |
- |
rs11614913 |
1.01 |
0.89–1.15 |
0.837 |
66% |
0.000 |
R |
0.893 |
0.885 |
Asian |
1.08 |
0.89–1.32 |
0.442 |
72% |
0.000 |
R |
- |
- |
Caucasian |
0.93 |
0.84–1.02 |
0.136 |
0% |
0.533 |
F |
- |
- |
rs2910164 |
0.95 |
0.83–1.08 |
0.453 |
59% |
0.003 |
R |
0.855 |
0.478 |
Asian |
1.00 |
0.83–1.19 |
0.960 |
50% |
0.053 |
R |
- |
- |
Caucasian |
0.90 |
0.73–1.11 |
0.317 |
73% |
0.005 |
R |
- |
- |
Recessive genetic model |
||||||||
rs3746444 |
1.29 |
0.97–1.71 |
0.083 |
66% |
0.003 |
R |
0.754 |
0.883 |
Asian |
1.38 |
0.97–1.96 |
0.070 |
67% |
0.006 |
R |
- |
- |
Caucasian |
1.01 |
0.75–1.34 |
0.971 |
11% |
0.289 |
F |
- |
- |
rs11614913 |
0.93 |
0.80–1.08 |
0.324 |
58% |
0.002 |
R |
0.138 |
0.286 |
Asian |
0.98 |
0.79–1.21 |
0.843 |
62% |
0.005 |
R |
- |
- |
Caucasian |
0.88 |
0.76–1.01 |
0.062 |
45% |
0.120 |
F |
- |
- |
rs2910164 |
1.03 |
0.82–1.29 |
0.784 |
62% |
0.001 |
R |
0.669 |
0.879 |
Asian |
1.03 |
0.89–1.19 |
0.686 |
14% |
0.319 |
F |
- |
- |
Caucasian |
1.00 |
0.57–1.73 |
0.986 |
83% |
0.000 |
R |
- |
- |
F: fixed effects model; R: random effects model.
For rs11614913, the association of this SNP with breast cancer risk was investigated in sixteen studies involving 6,907 cases and 8,072 control subjects. We failed to find a significant association between this polymorphism and BC risk in any of the five genetic models in the overall populations. However, in the subgroup analysis by ethnicity, we found rs11614913 was associated with a decreased risk of breast cancer among Caucasians in allele contrast genetic model (OR = 0.93, 95% CI = 0.87–1.00, P = 0.044) (Table 3) (Figure 3).
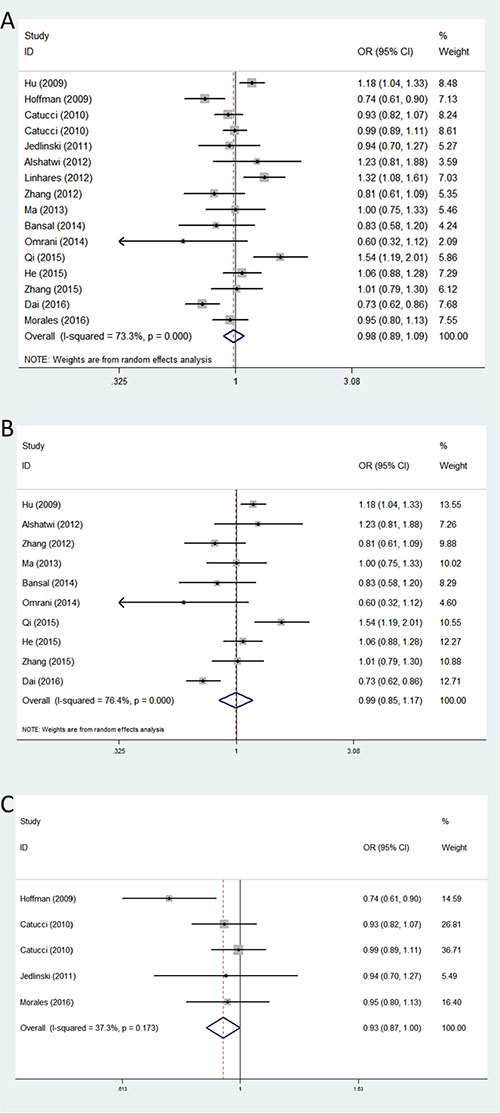
Figure 3: Forest plots of associations between rs11614913 and breast cancer risk among different ethnic groups in allele contrast genetic model. (A) the overall populations; (B) Asians; (C) Caucasians.
For rs2910164, thirteen studies with 6,134 cases and 5,866 controls were used to assess the association between this genetic polymorphism and breast cancer susceptibility. No obvious association was found between the rs2910164 polymorphism and breast cancer risk in any of the five genetic models. Similarly, further stratified analysis by ethnicity showed no significant correlation between rs11614913 and breast cancer susceptibility in all the ethnic groups (Table 3) (Figure 4).
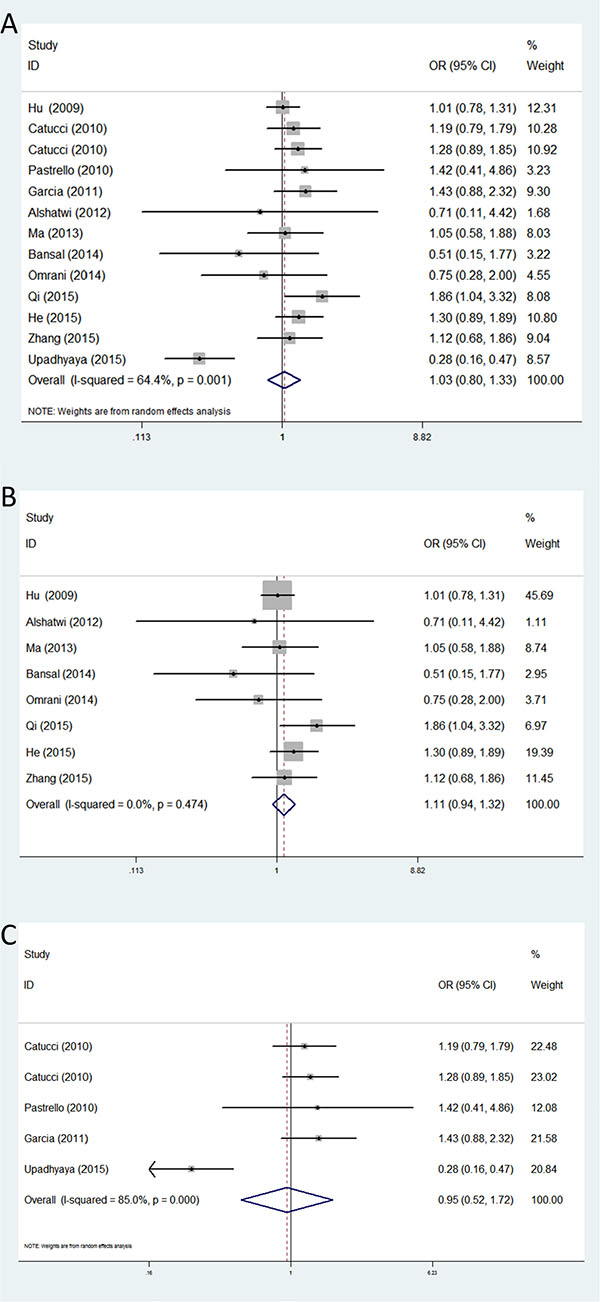
Figure 4: Forest plots of associations between rs2910164 and breast cancer risk among different ethnic groups in homozygote genetic model. (A) the overall populations; (B) Asians; (C) Caucasians.
Sensitivity analysis
In all the included studies, nine studies were not consistent with the Hardy-Weinberg equilibrium (HWE) in controls (P < 0.05) (Table 1). Nevertheless, after conducting the sensitivity analyses, the pooled ORs were no statistically significant change when deleting any of the studies, demonstrating that our results are stable and reliable (Figure 5).
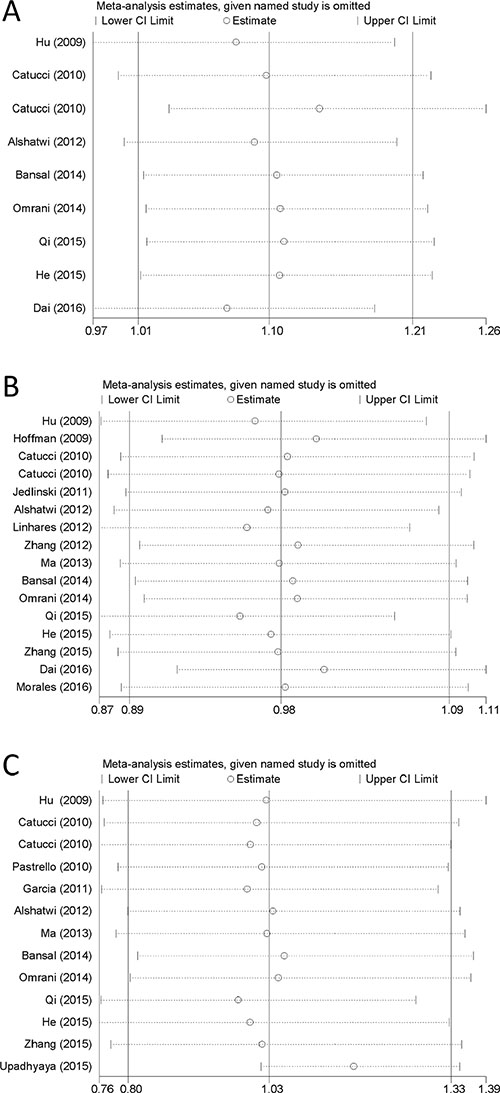
Figure 5: Sensitivity analyses of the three microRNA polymorphisms in specific genetic models. (A) rs3746444 in heterozygote genetic model; (B) rs11614913 in allele contrast genetic model; (C) rs2910164 in homozygote genetic model.
Heterogeneity analysis
We used Q statistic to determine the heterogeneity among studies in this meta-analysis. If significant heterogeneity existed (P value of Q test was < 0.1), we would select random-effects model to perform related statistical analysis; if not, we would choose fixed-effects model to carry out our research.
Publication bias
Begg’s test, Egger’s test and funnel plot were all used to assess the publication bias of the included studies. All P values of Begg’s test and Egger’s test were greater than 0.05 (P > 0.05), demonstrating that there is no significant publication bias in the overall population (Table 3). Funnel plot also proved that publication bias did not exist with no obvious asymmetry that could be observed (Figure 6). Hence, no publication bias was found in this meta-analysis. Egger’s publication bias plots are shown in Figure 7.
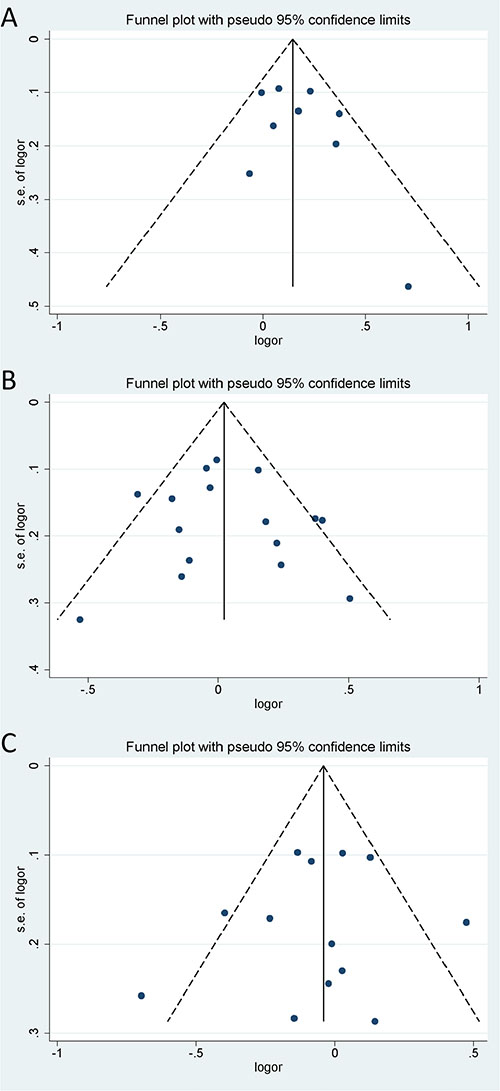
Figure 6: Funnel plots of the three microRNA polymorphisms in specific genetic models. (A) rs3746444 in dominant genetic model; (B) rs11614913 in heterozygote genetic model; (C) rs2910164 in heterozygote genetic model.
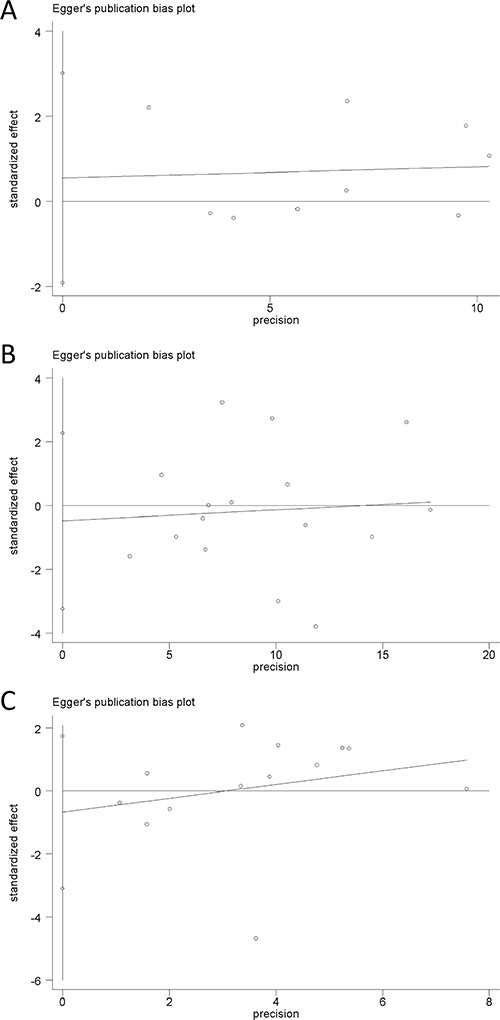
Figure 7: Egger’s publication bias plots of the three microRNA polymorphisms in specific genetic models. (A) rs3746444 in heterozygote genetic model; (B) rs11614913 in allele contrast genetic model; (C) rs2910164 in homozygote genetic model.
DISCUSSION
With the development of science and the improvement of medical technology, the diagnosis and treatment of breast cancer has made great progress in the past years. However, its pathogenesis has not been completely elucidated yet. Breast cancer is a highly heterogeneous disease. Its occurrence and development involves oncogene activation, tumor suppressor gene inactivation and many other related factors. In recent years, many microRNA polymorphisms have been identified as risk factors for breast cancer [29, 30].
Currently, three well-known SNPs in microRNA (rs3746444, rs11614913 and rs2910164) have been widely investigated and found to be associated with the risk of several types of cancer [31–33]. Nevertheless, the relationship between these three miRNA polymorphisms and BC risk can’t be determined because of inconsistent results published articles reported. Consequently, in order to obtain a more precise evaluation of the relationship, we perform this meta-analysis.
The microRNA-499 rs3746444 polymorphism is located in chromosome 20q11.22, which is an A to G single-nucleotide mutation that occurs in the stem structure of miR-499 precursor [34]. Studies have shown that rs3746444 can regulate the expression of SOX genes [35]. The abnormal expression of SOX genes can activate Wnt/β-catenin signaling pathway, which is associated with breast tumorigenesis and progression, so rs3746444 may play an important role in the occurrence and development of breast cancer by altering SOX genes’ expression level. Several studies [9, 13, 15–16] reported that rs3746444 polymorphism had an increased association with breast cancer risk, while others [10, 27, 36] showed no significant association between rs3746444 and BC susceptibility. Our result indicated that SNP rs3746444 was associated with BC risk in the four genetic models except recessive genetic model. In the subgroup analysis by ethnicity, we found that rs3746444 was associated with an increased risk of BC in Asians; nevertheless, no significant association was observed in Caucasians. The result was in correspondence with that of two previously published meta-analyses [37, 38], which further demonstrates that our result is credible.
Genetic variant in miR-196a2 (rs11614913) involving a C to T nucleotide substitution can alter its expression and function, which is associated with cancer susceptibility. Studies have reported that miR-196a can repress HOX gene expression through directing its mRNA cleavage [39]. Recent studies have found that HOXBP is overexpressed in breast cancer and it can promote invasion and metastasis of breast cancer [40]. Besides, the study by Seki et al. demonstrated that HOXBP was a significant prognostic factor in BC [41]. However, published studies showed inconsistent results on the association between rs11614913 and BC risk. Dai et al. [16] reported that rs11614913 polymorphism was a protective factor of BC. On the contrary, rs1614913 was found to be associated with an increased risk of BC in other studies [9, 14]. In our study, no correlation was detected between this polymorphism and breast susceptibility in the overall populations. However, in the subgroup analysis by ethnicity, we observed that rs11614913 was associated with a decreased risk of breast cancer among Caucasians in allele contrast genetic model. Our finding was partly consistent with the results of three previously published meta-analyses: in the meta-analysis by Chen et al. [42], twelve studies were included and the result showed that rs11614913 was a protective factor of BC in Asians; in other two meta-analyses [27–28], ten studies and eight studies were included, respectively, demonstrating that the rs11614913 polymorphism could decrease the BC risk in the overall populations. Compared with them, our study included eighteen eligible studies so our result was more reliable with the larger sample size. But consider the obvious heterogeneity among the included studies, we should cautiously treat our result although sensitivity analysis demonstrated that our result was stable.
For rs2910164, we observed that there was no association between rs2910164 and breast cancer risk in the general populations. When stratified by ethnicity, similar results could be seen in both Asians and Caucasians. Nevertheless, in a previous meta-analysis by Dai et al. [28], the authors found that the rs2910164 polymorphism had a significant association with BC risk in Caucasians using the homozygote comparison model and the dominant model. This contradiction may be due to different sample sizes and racial groups of the two studies: compared with his study, our study includes five new case-control studies, which will expand the sample size and thus get a more precise evaluation of association between rs2910164 and BC risk.
Some limitations of this meta-analysis must be pointed out. First, several important individual information was not provided, thus we couldn’t perform a more accurate analysis stratified by other risk factors of breast cancer such as age, gender, lifestyle and environmental factor. Meanwhile, a few studies selected specific type of breast cancer as the subjects of case group: the study by Ma et al. focused on triple negative breast cancer [21]; study by Catucci et al. only involved familial BC [10]. Second, some studies didn’t conform to Hardy-Weinberg equilibrium (HWE) in controls, which might influence the reliability of the results. Third, the variety of genotyping methods used in the included studies might have an impact on the results of our study. Last, obvious between-study heterogeneity existed in the included studies, and its sources were not clear. Moreover, not sufficient studies also made it difficult to make a more accurate assessment of these three polymorphisms and breast cancer susceptibility.
In summary, this meta-analysis indicates that miR-499 rs3746444 is associated with an increased BC risk in Asians and in the overall populations, while miR-196a rs11614913 has a decreased association with breast cancer risk among Caucasians. Besides, miR-146a rs2910164 has no relationship with breast cancer susceptibility. More multicenter studies with larger sample sizes are needed to further confirm the possible roles of these three microRNA polymorphisms in breast cancer.
MATERIALS AND METHODS
Literature and search strategy
We searched PubMed, EMBASE and Web of Science databases for papers published before September 18, 2016. There were no language restrictions in our searching process. The searching strategy was as follow: (breast cancer OR breast carcinoma) AND (polymorphism OR variant OR genotype OR SNP) AND (miR-499 OR rs3746444 OR miR-196a OR rs11614913 OR miR-146a OR rs2910164). Besides, the references of the retrieved studies were also reviewed to find additional eligible publications.
Inclusion criteria
All included studies must meet the following criteria: (1) evaluation of these three microRNA polymorphisms (miR-499 rs3746444, miR-196a rs11614913 and miR-146a rs2910164) and BC risk; (2) case-control studies; (3) sufficient genotyping data that could be used to calculate odds ratios (ORs) and 95% confidence intervals (CIs); (4) all the breast cancer subjects in case groups must be pathologically confirmed. The exclusion criteria were: (1) not case-control studies; (2) case reports, editorials, comments or review articles; (3) duplicate studies; (4) no detailed genotyping data.
Data extraction
Two investigators independently extracted the data from the included studies, and discrepancies were resolved through discussion with a third researcher. The following information was extracted: the first author, year of publication, country of origin, ethnicity, genotyping method, number of cases and controls, and P value for Hardy-Weinberg equilibrium (HWE).
Statistical analysis
The association of these three functional microRNA polymorphisms with BC susceptibility was measured by pooled odds ratios (ORs) and 95% confidence intervals (CIs) in five genetic models, including a allele contrast genetic model, a homozygote genetic model, a heterozygote genetic model, a dominant genetic model, and a recessive genetic model. Heterogeneity among studies was evaluated by I2 test and Q test. For I2 test, the criteria for heterogeneity were as follows: I2 < 25%, no heterogeneity; 25%-75%, moderate heterogeneity; I2 > 75%, high heterogeneity. If the P value of Q test was < 0.1, the random-effects model was used; otherwise, the fixed-effects model was applied. Sensitivity analysis was performed by sequentially deleting each study at a time to assess the influence of each study on the pooled ORs. We used Begg’s test, Egger’s test and funnel plot to assess publication bias. P value for Hardy-Weinberg equilibrium (HWE) was calculated by chi-square test in the control group of each study. Subgroup analysis was performed according to ethnicity. All statistical analyses were performed using STATA version 10.0 software (StataCorp LP, College Station, TX, USA). All P values were two sided, and P < 0.05 was considered statistically significant.
CONFLICTS OF INTEREST
The authors declare that no conflicts of interest exists.
GRANT SUPPORT
This work was supported by the National Natural Science Foundation, China (No. 81274136), and the Program for New Century Excellent Talents in Universities of China (No. NCET-110439).
REFERENCES
1. Torre LA, Bray F, Siegel RL, Ferlay J, Lortet-Tieulent J, Jemal A. Global cancer statistics, 2012. CA Cancer J Clin. 2015; 65:87–108.
2. McGuire A, Brown JA, Malone C, McLaughlin R, Kerin MJ. Effects of age on the detection and management of breast cancer. Cancers (Basel). 2015; 7:908–929.
3. Mehrgou A, Akouchekian M. The importance of BRCA1 and BRCA2 genes mutations in breast cancer development. Med J Islam Repub Iran. 2016; 30:369.
4. Towler BP, Jones CI, Newbury SF. Mechanisms of regulation of mature miRNAs. Biochem Soc Trans. 2015; 43:1208–1214.
5. Ma X, Shen D, Li H, Zhang Y, Lv X, Huang Q, Gao Y, Li X, Gu L, Xiu S, Bao X, Duan J, Zhang X. MicroRNA-185 inhibits cell proliferation and induces cell apoptosis by targeting VEGFA directly in von Hippel-Lindau-inactivated clear cell renal cell carcinoma. Urol Oncol. 2015; 33:161–169.
6. Yongchun Z, Linwei T, Xicai W, Lianhua Y, Guangqiang Z, Ming Y, Guanjian L, Yujie L, Yunchao H. MicroRNA-195 inhibits non-small cell lung cancer cell proliferation, migration and invasion by targeting MYB. Cancer lett. 2014; 347:65–74.
7. Song FJ, Chen KX. Single-nucleotide polymorphisms among microRNA: big effects on cancer. Chin J Cancer. 2011; 30:381–391.
8. Manikandan M, Munirajan AK. Single nucleotide polymorphisms in microRNA binding sites of oncogenes: implications in cancer and pharmacogenomics. OMICS. 2014; 18:142–154.
9. Hu Z, Liang J, Wang Z, Tian T, Zhou X, Chen J, Miao R, Wang Y, Wang X, Shen H. Common genetic variants in pre-microRNAs were associated with increased risk of breast cancer in Chinese women. Hum Mutat. 2009; 30:79–84.
10. Catucci I, Yang R, Verderio P, Pizzamiglio S, Heesen L, Hemminki K, Sutter C, Wappenschmidt B, Dick M, Arnold N, Bugert P, Niederacher D, Meindl A, et al. Evaluation of SNPs in miR-146a, miR196a2 and miR-499 as low-penetrance alleles in German and Italian familial breast cancer cases. Hum Mutat. 2010; 31:E1052-E1057.
11. Alshatwi AA, Shafi G, Hasan TN, Syed NA, Al-Hazzani AA, Alsaif MA, Alsaif AA. Differential expression profile and genetic variants of microRNAs sequences in breast cancer patients. Plos One. 2012; 7:e30049.
12. Bansal C, Sharma KL, Misra S, Srivastava AN, Mittal B, Singh US. Common genetic variants in pre-microRNAs and risk of breast cancer in the North Indian population. Ecancermedicalscience. 2014; 8:473.
13. Omrani M, Hashemi M, Eskandari-Nasab E, Hasani SS, Mashhadi MA, Arbabi F, Taheri M. hsa-mir-499 rs3746444 gene polymorphism is associated with susceptibility to breast cancer in an Iranian population. Biomark Med. 2014; 8:259–267.
14. Qi P, Wang L, Zhou B, Yao WJ, Xu S, Zhou Y, Xie ZB. Associations of miRNA polymorphisms and expression levels with breast cancer risk in the Chinese population. Genet Mol Res. 2015; 14:6289–6296.
15. He B, Pan Y, Xu Y, Deng Q, Sun H, Gao T, Wang S. Associations of polymorphisms in microRNAs with female breast cancer risk in Chinese population. Tumour Biol. 2015; 36:4575–4582.
16. Dai ZM, Kang HF, Zhang WG, Li HB, Zhang SQ, Ma XB, Lin S, Wang M, Feng YJ, Liu K, Liu XH, Xu P, Dai ZJ. The Associations of Single Nucleotide Polymorphisms in miR196a2, miR-499, and miR-608 With Breast Cancer Susceptibility: A STROBE-Compliant Observational Study. Medicine (Baltimore). 2016; 95:e2826.
17. Hoffman AE, Zheng T, Yi C, Leaderer D, Weidhaas J, Slack F, Zhang Y, Paranjape T, Zhu Y. microRNA miR-196a-2 and breast cancer: a genetic and epigenetic association study and functional analysis. Cancer Res. 2009; 69:5970–5977.
18. Jedlinski DJ, Gabrovska PN, Weinstein SR, Smith RA, Griffiths LR. Single nucleotide polymorphism in hsa-mir-196a-2 and breast cancer risk: a case control study. Twin Res Hum Genet. 2011; 14:417–421.
19. Linhares JJ, Azevedo MJ, Siufi AA, de Carvalho CV, Wolgien MC, Noronha EC, Bonetti TC, Da SI. Evaluation of single nucleotide polymorphisms in microRNAs (hsa-miR-196a2 rs11614913 C/T) from Brazilian women with breast cancer. Bmc Med Genet. 2012; 13:119.
20. Zhang M, Jin M, Yu Y, Zhang S, Wu Y, Liu H, Liu H, Chen B, Li Q, Ma X, Chen K. Associations of miRNA polymorphisms and female physiological characteristics with breast cancer risk in Chinese population. Eur J Cancer Care (Engl). 2012; 21:274–280.
21. Ma F, Zhang P, Lin D, Yu D, Yuan P, Wang J, Fan Y, Xu B. There is no association between microRNA gene polymorphisms and risk of triple negative breast cancer in a Chinese Han population. Plos One. 2013; 8:e60195.
22. Zhang P, Ma F, Xu B. [Polymorphisms of microRNA genes and their association with breast cancer risk]. 2015; 37:501–507.
23. Morales S, Gulppi F, Gonzalez-Hormazabal P, Fernandez-Ramires R, Bravo T, Reyes JM, Gomez F, Waugh E, Jara L. Association of single nucleotide polymorphisms in Pre-miR-27a, Pre-miR-196a2, Pre-miR-423, miR-608 and Pre-miR-618 with breast cancer susceptibility in a South American population. Bmc Genet. 2016; 17:109.
24. Pastrello C, Polesel J, Della PL, Viel A, Maestro R. Association between hsa-mir-146a genotype and tumor age-of-onset in BRCA1/BRCA2-negative familial breast and ovarian cancer patients. Carcinogenesis. 2010; 31:2124–2126.
25. Garcia AI, Cox DG, Barjhoux L, Verny-Pierre C, Barnes D, Antoniou AC, Stoppa-Lyonnet D, Sinilnikova OM, Mazoyer S. The rs2910164:G>C SNP in the MIR146A gene is not associated with breast cancer risk in BRCA1 and BRCA2 mutation carriers. Hum Mutat. 2011; 32:1004–1007.
26. Upadhyaya A, Smith RA, Chacon-Cortes D, Revechon G, Bellis C, Lea RA, Haupt LM, Chambers SK, Youl PH, Griffiths LR. Association of the microRNA-Single Nucleotide Polymorphism rs2910164 in miR146a with sporadic breast cancer susceptibility: A case control study. Gene. 2016; 576:256–260.
27. Wang PY, Gao ZH, Jiang ZH, Li XX, Jiang BF, Xie SY. The associations of single nucleotide polymorphisms in miR-146a, miR-196a and miR-499 with breast cancer susceptibility. Plos One. 2013; 8:e70656.
28. Dai ZJ, Shao YP, Wang XJ, Xu D, Kang HF, Ren HT, Min WL, Lin S, Wang M, Song ZJ. Five common functional polymorphisms in microRNAs (rs2910164, rs2292832, rs11614913, rs3746444, rs895819) and the susceptibility to breast cancer: evidence from 8361 cancer cases and 8504 controls. Curr Pharm Des. 2015; 21:1455–1463.
29. Chen P, Sun R, Pu Y, Bai P, Yuan F, Liang Y, Zhou B, Wang Y, Sun Y, Zhu J, Zhang L, Gao L. Pri-Mir-34b/C, Tp-53 Polymorphisms are Associated With The Susceptibility of Papillary Thyroid Carcinoma: A Case-Control Study. Medicine (Baltimore). 2015; 94:e1536.
30. Zhang N, Huo Q, Wang X, Chen X, Long L, Jiang L, Ma T, Yang Q. A genetic variant in pre-miR-27a is associated with a reduced breast cancer risk in younger Chinese population. GENE. 2013; 529:125–130.
31. Zhang X, He R, Ren F, Tang R, Chen G. Association of miR-146a rs2910164 polymorphism with squamous cell carcinoma risk: a meta-analysis. J Buon. 2015; 20:829–841.
32. Xie WQ, Tan SY, Wang XF. MiR-146a rs2910164 polymorphism increases risk of gastric cancer: a meta-analysis. World J Gastroenterol. 2014; 20:15440–15447.
33. Peng Q, Li S, Lao X, Chen Z, Li R, Deng Y, Qin X. The association of common functional polymorphisms in mir-146a and mir-196a2 and hepatocellular carcinoma risk: evidence from a meta-analysis. Medicine (Baltimore). 2014; 93:e252.
34. Ryan BM, Robles AI, Harris CC. Genetic variation in microRNA networks: the implications for cancer research. Nat Rev Cancer. 2010; 10:389–402.
35. Li X, Wang J, Jia Z, Cui Q, Zhang C, Wang W, Chen P, Ma K, Zhou C. MiR-499 regulates cell proliferation and apoptosis during late-stage cardiac differentiation via Sox6 and cyclin D1. Plos One. 2013; 8:e74504.
36. Jiang SG, Chen L, Tang JH, Zhao JH, Zhong SL. Lack of association between Hsa-Mir-499 rs3746444 polymorphism and cancer risk: meta-analysis findings. Asian Pac J Cancer Prev. 2015; 16:339–344.
37. Wang F, Sun G, Zou Y, Li Y, Hao L, Pan F. Association of microRNA-499 rs3746444 polymorphism with cancer risk: evidence from 7188 cases and 8548 controls. Plos One. 2012; 7:e45042.
38. Wang Y, Yang B, Ren X. Hsa-miR-499 polymorphism (rs3746444) and cancer risk: a meta-analysis of 17 case-control studies. Gene. 2012; 509:267–272.
39. Yekta S, Shih IH, Bartel DP. MicroRNA-directed cleavage of HOXB8 mRNA. Science. 2004; 304:594–596.
40. Hayashida T, Takahashi F, Chiba N, Brachtel E, Takahashi M, Godin-Heymann N, Gross KW, Vivanco M, Wijendran V, Shioda T, Sgroi D, Donahoe PK, Maheswaran S. HOXB9, a gene overexpressed in breast cancer, promotes tumorigenicity and lung metastasis. Proc Natl Acad Sci USA. 2010; 107:1100–1105.
41. Seki H, Hayashida T, Jinno H, Hirose S, Sakata M, Takahashi M, Maheswaran S, Mukai M, Kitagawa Y. HOXB9 expression promoting tumor cell proliferation and angiogenesis is associated with clinical outcomes in breast cancer patients. ANN SURG ONCOL. 2012; 19:1831–1840.
42. Chen QH, Wang QB, Zhang B. Ethnicity modifies the association between functional microRNA polymorphisms and breast cancer risk: a HuGE meta-analysis. Tumour Biol. 2014; 35:529–543.