
INTRODUCTION
Gastric cancer (GC) is a heterogeneous disease, with two major histological subtypes, “intestinal” (IGC) and “diffuse” (DGC) [1], that vary in terms of both clinic-pathological profiles and molecular pathogenesis [2]. While IGC follows a stepwise neoplastic progression arising from a premalignant transformation of the normal gastric mucosa, DGC manifests without a defined premalignant stage and is associated with a very aggressive behavior and a poor prognosis [2]. Different genetic and epigenetic lesions underlie the carcinogenic processes involved [2] and subtype-specific molecular signatures have been identified by whole-genome sequencing and gene expression and methylation profiling [3, 4, 5]. Beyond these subtype-specific features, comprehensive molecular approaches also highlighted that adherens junctions and focal adhesions are driver pathways in gastric carcinogenesis, with alterations in genes associated with these pathways occurring in most GC cases [3, 4, 5]. One adhesion-related gene family largely implicated in gastric carcinogenesis is the cadherin family, with the best-known member being CDH1.
CDH1 encodes E-cadherin, a calcium-dependent transmembrane adhesion protein. The downregulation of E-cadherin is a crucial step for epithelial to mesenchymal transition (EMT), whereas the restoration of its expression occurs when the cell phenotype reverts from mesenchymal to epithelial (MET) state. A number of transcription factors and specific activators act along either EMT or MET pathways, tightly regulating E-cadherin expression [6]. Beyond epithelial cell adhesion, the protein has also been implicated in cell survival, proliferation and migration, and its loss/aberrant expression has a key role in tumor invasion and metastasis [7, 8].
Inactivating mutations along the CDH1 locus leading to loss of protein expression are a common feature of DGCs, while alternative mechanisms modulating E-cadherin expression characterize the intestinal type [9, 10]. A number of studies have shown that Helicobacter pylori (H. pylori), which is a primary risk factor for IGC, partially mediates the transformation of the normal gastric mucosa by targeting CDH1 transcription and protein expression levels [8, 11, 12]. Small regulatory RNAs (micro-RNAs) have also been associated with a decrease of E-cadherin expression in IGC; in particular, the loss of miR-101 results in the up-regulation of EZH2, an inhibitor of E-cadherin, thus reducing its expression and promoting tumor progression [13]. In addition to genetic determinants and miRNAs, an intron-mediated mechanism of CDH1 regulation has also been identified [13, 14, 15]. Indeed, intron 2, harboring an exceptionally high number of repetitive elements involved in exonization, can act as a cis-modulator of E-cadherin gene and protein expression [6, 14, 16]. In certain cell lines, intron 2 has been shown to give rise to a number of non-canonical transcripts, one of which, CDH1a, harbors properties that enable its translation into a protein isoform differing from the canonical E-cadherin in its N-terminal domain [15]. Such a protein proved to be detectable in transfected cells overexpressing the CDH1a transcript; moreover, functional assays associated CDH1a overexpression with increased angiogenesis and invasion in the presence of the canonical transcript [15].
These findings make CDH1 gene transcripts likely players in gastric carcinogenesis of the intestinal type, where some level of E-cadherin expression is often retained. On this basis, we applied digital PCR (dPCR) technique to determine the presence and differential expression of CDH1 gene transcripts in IGC and normal tissue samples. This represents the first evaluation of the interplay between canonical and non-canonical transcripts of CDH1 gene in patients affected with GC of the intestinal type.
RESULTS
We performed CDH1 gene expression analysis on fresh-frozen tissue samples from 32 patients with gastric cancer of the intestinal type. Available clinical data are reported in Table 1.
Table 1: Clinic-pathological parameters of IGC patients
Parameter |
Total |
|
|---|---|---|
n(32) |
% |
|
Sex |
||
F |
14 |
43.8 |
M |
18 |
56.2 |
Agea |
||
≤65 |
9 |
28.1 |
66–75 |
10 |
31.3 |
>75 |
13 |
40.6 |
Tb |
||
1 |
2 |
6.3 |
2 |
17 |
53.1 |
3 |
12 |
37.5 |
4 |
1 |
3.1 |
Nb |
||
0 |
12 |
37.5 |
1 |
10 |
31.3 |
2 |
6 |
18.7 |
3 |
4 |
12.5 |
Mb |
||
0 |
21 |
65.6 |
1 |
2 |
6.3 |
N/Ac |
9 |
28.1 |
Grade |
||
1 |
1 |
3.1 |
2 |
9 |
28.1 |
3 |
21 |
65.7 |
N/A |
1 |
3.1 |
Tumor site |
||
Distal third (L) |
7 |
21.9 |
Middle third (M) |
24 |
75 |
Proximal third (U) |
1 |
3.1 |
Tumor size (cm) |
||
2–5 |
15 |
46.9 |
5–10 |
15 |
46.9 |
>10 |
1 |
3.1 |
N/A |
1 |
3.1 |
Helicobacter Pylori |
||
Positive |
15 |
46.9 |
Negative |
15 |
46.9 |
N/A |
2 |
6.2 |
Adjuvant chemotherapy |
||
Yes |
10 |
31.3 |
No |
16 |
50 |
N/A |
6 |
18.7 |
aThe mean age at diagnosis was 72.8.
bTumor staging was done based on the tumor (T), lymph node (N) and metastasis (M) system.
cN/A: not available.
Gene expression was investigated by quantifying with digital PCR (dPCR) the canonical transcript (hereafter called CDH1) and one non-canonical transcript arising from intron 2 (hereafter called CDH1a); this last has properties enabling its translation into a protein isoform differing from the canonical E-cadherin in its N-terminal domain [15]. Figure 1 shows the 5′ end of both CDH1 and CDH1a transcripts, the appropriate primers to obtain these transcripts from total RNA (cDNA), and the specific probes we utilized to quantify them by means of QuantstudioTM 3D dPCR approach.
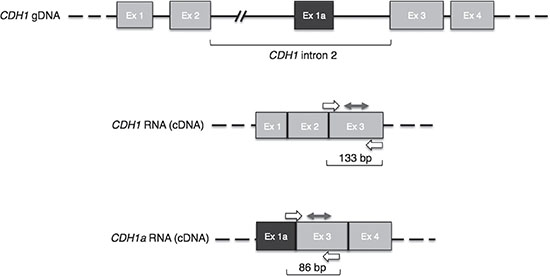
Figure 1: CDH1 gene and related transcripts. In light grey are canonical exons. In dark grey is the CDH1a non-canonical exon. Primers and probes designed to detect the specific transcripts are depicted by single and double arrows, respectively; the sizes of resulting amplicons are indicated underneath each transcript. Ex: exon.
By multiplex dPCR, we compared the expression levels of CDH1 in tumor and corresponding normal tissue samples from 21 IGC patients. Figure 2A shows an example of dPCR output scatter plots obtained for paired samples from the same subject. The analysis of the distribution of CDH1 expression levels in normal and cancer tissue samples, following normalization to the GAPDH reference gene, revealed a significantly lower level of CDH1 in tumors compared to normal samples (P = 0.001) (Figure 2B). In particular, reduced CDH1 expression by at least 1.5 times was found in 16 out of 21 cases (76%).
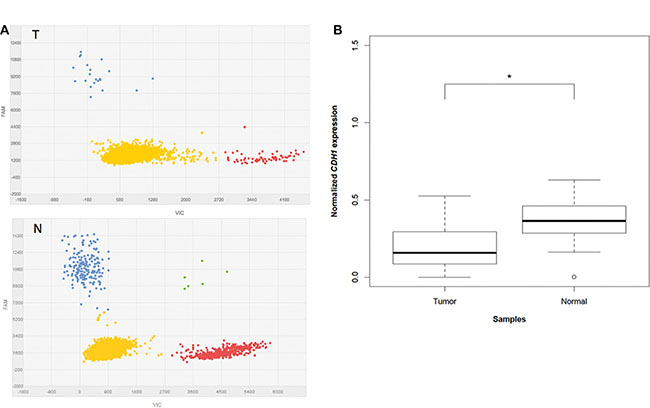
Figure 2: CDH1 expression analysis in multiplex dPCR. (A) Typical dPCR output scatter plots of tumor (T) and normal (N) samples showing the distribution of the data points based on the dyes used (VIC and FAM). Yellow refers to “No Amplification”, red to VIC amplified GAPDH, blue to FAM amplified CDH1, and green to co-amplified CDH1 and GAPDH. (B) Box plots of normalized CDH1 expression levels in 21 tumors compared to the paired normal tissue. “*” refers to a statistically significant difference with a P-value = 0.001 as calculated by Student’s t-test.
By singleplex dPCR, we then determined the differential expression of CDH1a in the 21-paired samples, as well as in 11 additional tumor samples for which the corresponding normal tissue was not available. We could detect CDH1a at a very low level in 15 out of 32 (47%) tumors. Under the same experimental conditions, CDH1a transcript proved to be undetectable in normal tissue samples, including those corresponding to CDH1a-positive tumors. In these tumors, the amount of CDH1a was too low to provide for accurate numerical dPCR quantitation; accordingly, we grouped cases as simply being CDH1a positive or negative. Figure 3 shows an example of dPCR output scatter plots obtained for paired samples from the same subject, with CDH1a being barely detectable in tumor and undetectable in normal cDNA.
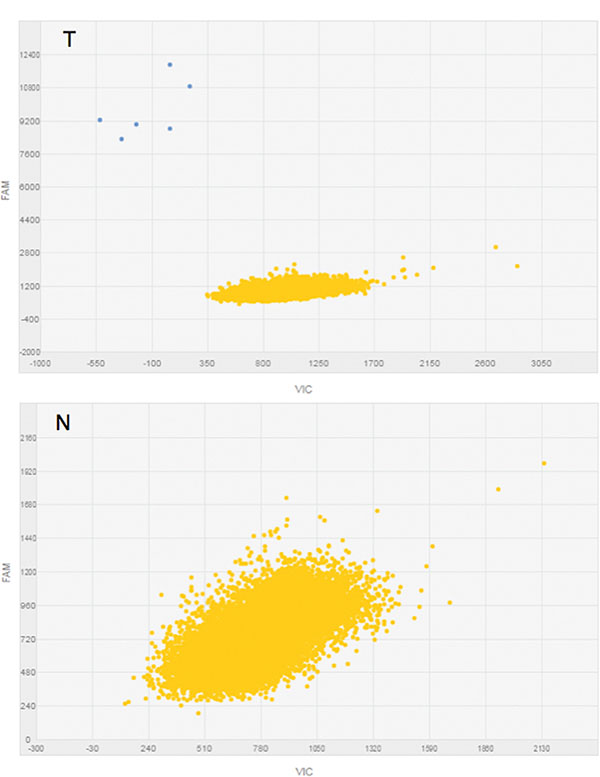
Figure 3: CDH1a expression analysis in singleplex dPCR. Typical dPCR output scatter plots of tumor (T) and normal (N) samples showing the distribution of data points based on the dye used (FAM). Yellow refers to “No Amplification” and blue to FAM amplified CDH1a (see also Appendix S1).
In order to determine whether the expression of the CDH1a non-canonical transcript was affecting that of CDH1, we compared CDH1 expression levels in the presence and absence of CDH1a in the 32 IGC tumors. A non-statistically significant trend was observed of having more CDH1 in tumors lacking CDH1a (P = 0.455) (Figure 4). Moreover, among the 13 tumors showing a decrease in CDH1 expression levels compared to normal gastric mucosa, 12 (92%) were found to express CDH1a, suggesting an association between reduced CDH1 expression and presence of CDH1a in tumors.
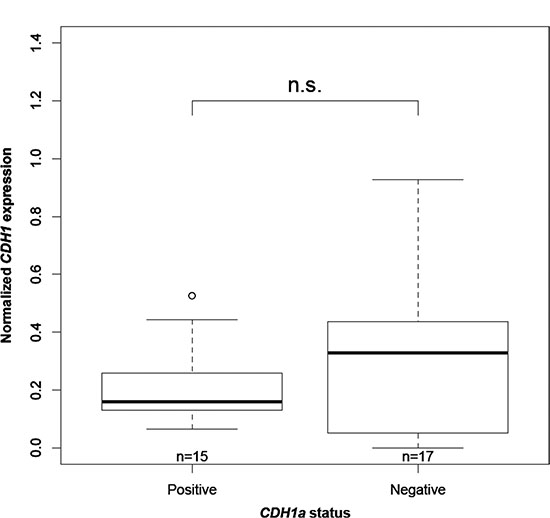
Figure 4: Association between CDH1 expression and CDH1a status. “n” is the number of IGC tumors in each category. “n.s” refers to a statistically non-significant difference with a P-value = 0.455 as calculated by Wilcoxon rank sum test.
Among the CDH1 inhibitors, a relevant role is played by EZH2, which is a known target of miR-101 [13]. The relative quantification of this miRNA in 20 pairs of normal and tumor tissue samples by RT-qPCR showed that miR-101 significantly decreased in tumors compared to the normal gastric mucosa (P = 1.565 × 10–05) (Figure 5). Such a decrease proved to be coupled with reduced CDH1 expression in 13 out of 20 tumors (65%). Moreover, among the 13 tumors harboring a concomitant decrease in both miR-101 and CDH1 transcripts, 9 (69%) also expressed CDH1a.
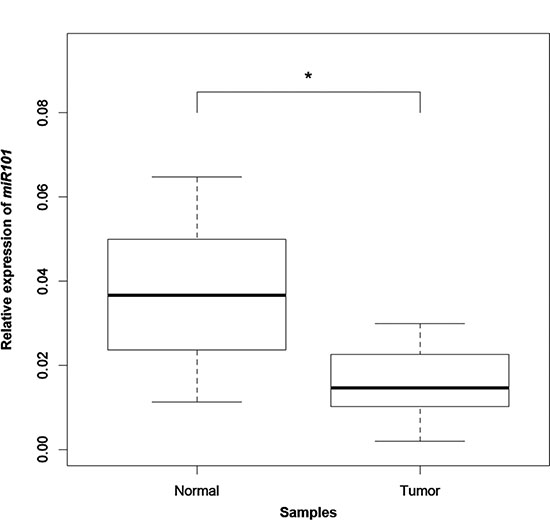
Figure 5: miR-101 expression analysis by qPCR. Box plots of the relative expression of miR-101 to the internal control gene RNU6B in 20 tumors compared to the paired normal tissue. “*” refers to a statistically significant difference with a P-value = 1.565 × 10−05 as calculated by Wilcoxon rank sum test.
It has previously been reported [15] that in GC transfected cells the overexpression of CDH1a increases the expression levels of the interferon-inducible IFITM1 and IFI27 genes. We applied RT-qPCR method to evaluate IFITM1 and IFI27 expression in 15 CDH1a-positive and 15 negative tumors: no significant difference in the expression of either IFITM1 (P = 0.486) or IFI27 (P = 0.683) was found in tissue samples.
Finally, we tested for possible associations between CDH1 expression levels and CDH1a presence/absence with patients’ clinical parameters including tumor stage, grade and size, as well as 5-years disease-free survival and presence of H. pylori. We found a trend of lower CDH1 gene expression in tumors with a higher grade (G3 vs. G2 + G1) and in those positive for H. pylori infection.
DISCUSSION
The importance of E-cadherin in the manifestation of gastric cancer is highlighted by findings supporting the dysregulation of this protein in both the intestinal and diffuse GC histotypes. Indeed, the majority of GCs show an immunohistochemical (IHC) aberrant pattern (mislocalization) of E-cadherin expression, while complete protein loss is highly predominant in GCs of the diffuse histotype [10, 13, 19]. On the whole, CDH1 gene alterations account for only about 30–40% of cases with aberrant or absent protein expression, respectively. Among genetic lesions, CDH1 inactivating mutations are a typical feature of DGC, while promoter hypermethylation and LOH have been found in both tumor histotypes, albeit at different frequencies [10]. Alternative mechanisms have been implicated in the negative regulation of E-cadherin expression, indicating the existence of factors acting at different levels that can subtly modulate E-cadherin expression in gastric cancer of the intestinal type [9, 13].
In this study we evaluated CDH1 gene expression in the intestinal type by quantifying CDH1 canonical and CDH1a non-canonical transcripts in RNA from normal and cancer tissue samples by means of digital PCR (dPCR). dPCR is a method for sensitive measurement and quantification of nucleic acids; it improves precision and reproducibility with respect to real-time quantitative PCR (qPCR) and provides an alternative approach for detection of gene expression in settings where the target RNA is limited or present in quantity that approaches the limits of qPCR sensitivity [17, 20].
Following dPCR quantification of the canonical transcript, we could demonstrate that CDH1 was significantly less expressed in cancer tissue compared to normal mucosa of the same patients (P = 0.001); this downregulation was especially evident (at least 1.5 times less) in 76% of IGC tumors. Previous evaluations obtained by qPCR method on intestinal GCs gave variable results with reports ranging from a clear decrease [11, 21] to a non-significant difference [22, 23] in CDH1 expression in cancer compared to the normal counterpart. Therefore, through the implementation of the more precise dPCR in our quantification, we were able to provide evidence on the downregulation of CDH1 expression.
By applying the same experimental approach, we determined for the first time the expression of CDH1a in IGC and could detect CDH1a in a fraction of tumors (47%), while no dPCR amplification signal could be observed in the tested normal tissue samples. This finding is in line with data reported by Pinheiro and coworkers [15] who, by Quantitative-SnapShot method, found CDH1a to be expressed in gastric cancer cell lines but not in commercially available RNA from the normal stomach. However, while most of their tested cell lines expressed high levels of CDH1a, this transcript proved to be barely detectable in the cancer samples we analyzed. A possible explanation is intratumor cell heterogeneity or “dilution” of the CDH1a dPCR amplification signal by the presence of normal cells. More likely, CDH1a is expressed at a very low level in tumors, while at a high level in cell lines due to positive selection during cell line stabilization.
It has been reported that in transfected GC cell lines, the induced overexpression of CDH1a leads to an increase of IFITM1 and IFI27 interferon-induced genes [15]. However, in our tissue samples derived from IGC patients, no association was detectable between CDH1a presence/absence and IFITM1 and IFI27 gene expression levels.
As part of the intricate mechanisms regulating CDH1, miRNAs play a role in gene expression dosage, both directly by interacting with the CDH1 transcript, and indirectly by acting on genes that are part of the regulatory network. In intestinal-type gastric cancer, miR-101 has been shown to target the CDH1 inhibitor EZH2. In particular, miR-101 was reported to be downregulated in around 60% of tumors, with a concomitant overexpression of EZH2 and loss/aberrant expression of E-cadherin protein in 40% of cases [13]. By performing miR-101 RT-qPCR analysis in our paired tumor and normal tissue samples, we could find a significant decrease of expression in tumors compared to the normal counterparts (P = 1.565 × 10−05). The miR-101 decrease occurred in 85% of tumors and was accompanied by a concomitant decrease of CDH1 expression in 65% of cases, thus indicating that miR-101 might contribute to CDH1 downregulation. Moreover, 69% of tumors harboring a decrease in both miR-101 and CDH1 transcripts expressed CDH1a, suggesting a possible link among the three factors.
Besides miRNAs, the presence of CDH1a in tumors with lower levels of CDH1 could be attributed to other mechanisms, including a shift of transcription factors and/or other components of the transcription initiation machinery in favor of one transcript over the other in cancer cells [24]. These types of events, together with disturbance of alternative splicing programs have frequently been linked to the carcinogenic process [25].
In addition, intron 2, from which CDH1a arises, is a well-demonstrated cis regulatory element of CDH1 gene expression, containing multiple transcription initiation sites and evolutionary conserved elements, as well as enhancers and repeated sequences [6, 14, 15, 16]. In particular, surrounding exon 1a different regulatory sequences have been identified, including CpG islands, DNaseI hypersensitive sites and CTCF (CCCTC-binding factor) insulator elements [15]. A dysfunction of any of these elements can result in CDH1 gene transcripts’ imbalance.
Finally, we attempted to associate the expression levels of CDH1 and the presence/absence of CDH1a with the IGC patients’ clinical parameters. We observed a trend of expressing less CDH1 in higher-grade tumors and in those positive for H. pylori infection. While some studies implicated H. pylori infection with the epigenetic silencing of CDH1 promoter [26, 27], others reported alternative mechanisms reducing E-cadherin protein levels through the induction of human E-cadherin-cleaving enzymes [28]. Very recently, it has been shown that H. pylori itself secretes a protease (HtrA: high-temperature requirement A) which targets E-cadherin by directly cleaving its extracellular domain, thus opening cell-to-cell junctions [12, 29]. This E-cadherin ectodomain shedding also results in high serum levels of soluble peptides in IGC patients [12, 30].
On the whole, a series of well-known genetic and epigenetic mechanisms can underlie E-cadherin loss or impairment in gastric carcinogenesis. In addition, abnormal isoforms and transcripts’ imbalance resulting from cryptic abnormalities along the CDH1 locus, may subtly contribute to the carcinogenic process.
MATERIALS AND METHODS
Samples
This retrospective study was conducted on 53 fresh-frozen specimens including 21 paired normal/cancer tissue samples and 11 additional tumor tissues. Samples were obtained from 32 patients diagnosed with gastric cancer of the intestinal histotype (Lauren’s classification), recruited between 2007 and 2012 at the IRST-IRCCS (Istituto Scientifico Romagnolo per lo Studio e la Cura dei Tumori Srl Istituto di Ricovero e Cura a Carattere Scientifico) of Meldola (FC-Italy). Available clinical data are reported in Table 1. Twenty-two out of 32 patients underwent surgery before 2012; 9 of these patients were disease-free after 5-years of follow up.
Tissue samples were macrodissected from blocks of tumor (containing at least 70% tumor cells) and normal gastric mucosa that had been cryopreserved immediately after surgical resection. The presence of H. pylori was further assessed by the examination of hematoxylin and eosin stained formalin-fixed paraffin-embedded tissue sections of each patient.
This study was approved by the Local Ethics Committee (Comitato Etico Area Vasta Romagna e IRST) and informed consent was obtained from all patients (protocol number: IRSTB062).
RNA extraction
Total RNA was extracted by the TRIzol®Reagent (Invitrogen, Darmstadt, Germany) treated with DNase (Qiagen, Hilden, Germany), and purified with the RNeasy MinElute Cleanup Kit (Qiagen) according to the standard protocol provided by the manufacturers. Purified RNA was eluted with RNase free water (Qiagen) and concentration and quality were assessed by Spectrophotometer Nanodrop-ND-1000 (Celbio, Milan, Italy). RNA integrity was verified by using the Experion™ RNA StdSens Analysis Kit (Bio-Rad Laboratories, Hercules, CA, USA) following manufacturer’s instructions (Supplementary Figure S1).
Reverse transcription (RT)
RT of 1 μg RNA was carried out using the iScript™ cDNA Synthesis Kit (Bio-Rad Laboratories) according to manufacturer’s instructions. Thermal cycling conditions were as follows: 25°C for 5 min, 42°C for 30 min, 85°C for 5 min. The resulting cDNA was either immediately analyzed by dPCR or qPCR or stored at −20°C.
Digital PCR (dPCR)
dPCR was used to determine the expression of CDH1 and CDH1a with GAPDH as an internal control (Appendix S1). All dPCR experiments were carried out using the chip-based QuantStudioTM 3D Digital PCR system (Applied Biosystems, Foster City, CA, USA), in accordance with the “Minimum Information for Publication of Quantitative Real-Time dPCR Experiments” (dMIQE) guidelines (Supplementary Table S1) [17]. CDH1 and GAPDH reactions were run in multiplex using 10–20 ng cDNA, while CDH1a reactions were run in singleplex using 300 ng cDNA (Appendix S1, Supplementary Figure S2). In each case, reaction mixes containing either cDNA or water (no-template controls) were first prepared by adding 2X QuantStudio 3D™ Digital PCR Master Mix v2 (Applied Biosystems) and 20X gene specific assay (Supplementary Table S2) in a total volume of 15.5 μl. Fifteen μl of each sample were then loaded into a blade that is firmly clasped onto the arm of the chip loader and evenly distributed into the chip’s 20 000 nano-sized reaction wells. Each chip was then coated with Immersion Fluid and sealed with a QuantStudio™ 3D Digital PCR Chip Lid v2. Up to 24 chips were run simultaneously using GeneAmp PCR System 9700 (Applied Biosystems) by applying the following conditions: hold at 96°C for 10 min; 45 cycles of 60°C for 2 min and 98°C for 30 sec; hold at 60°C for 2 min. At the end of the reaction, chips were processed using the QuantStudio™ 3D Digital PCR system (Applied Biosystems) and analyzed with QuantStudio™ 3D Analysis Suite™ software (version 3.0.3). Only chips with at least 13 000 analyzable data points were accepted (Supplementary Figure S3). The data were exported as a comma-separated values (CSV) file and included the number of copies per μl of each target in the tested sample.
Two-step reverse transcription quantitative PCR (RT-qPCR)
To quantify IFI27 and IFITM1 levels, RT-qPCR experiments were performed in triplicate on 20 ng of tumor cDNA obtained from the previously described RT. qPCR reactions were carried out using PrimeTime® Std qPCR assays for the target genes IFI27 and IFITM1 (Integrated DNA Technologies, Leuven, Belgium) and the endogenous controls, RPLP0 and HPRT1 (Integrated DNA Technologies, Coralville, IA, USA), together with the TaqMan® Universal Master Mix II, no UNG (Applied Biosystems).
With respect to the quantification of miR-101 transcript, 10 ng total RNA from normal and tumor tissue samples were first reverse transcribed using RT-specific primers and components of the TaqMan® MicroRNA Reverse Transcription Kit (Applied Biosystems), according to the manufacturer’s instructions. Subsequently, qPCR reactions were performed in triplicate for the mature miR-101 transcript and for an endogenous control, RNU6B, with TaqMan® Universal Master Mix II, no UNG (Applied Biosystems), using the TaqMan™MicroRNA Assays (Applied Biosystems) has-miR-101 and RNU6B, respectively.
All aforementioned qPCR reactions were run on a 7500 Real-Time PCR (Applied Biosystems) by applying the following thermal cycling protocol: hold at 95°C for 10 min; 40 cycles of 95°C for 30 sec and 60°C for 60 sec; and quantified using the comparative 2–ΔCt method [18].
Statistical analysis
To compare mRNA expression either a two-tailed Student’s t-test or a two-sided Wilcoxon rank-sum test was used depending on the data distribution. With respect to associations between clinic-pathological parameters and mRNA expression, two-sided Wilcoxon rank-sum test and Fisher’s exact tests were used. All analysis was done with R statistical software version 2.14.1. P-values ≤ 0.05 were considered as statistically significant for each comparison.
ACKNOWLEDGMENTS
R.A.K. was recipient of a PhD fellowship from Dunia Beam-Erasmus Mundus Action 2; M.M. was recipient of a Giovanni Magni postdoctoral fellowship from the Adriano Buzzati-Traverso Foundation.
CONFLICTS OF INTEREST
The authors declare no conflicts of interest.
FUNDING
This work was funded by “Fondo Ricerca Giovani” of the University of Pavia.
Authors’ contributions
LS and PM: Sample collection and histological characterization. VM, MM: RNA preparation, RT-qPCR experiments and statistical analysis. RAK, CM and SS: dPCR set up and experiments; article draft. DO, DC and GNR: Study design, interpretation of data and critical revision, funding.
REFERENCES
1. Laurén P. The two histological main types of gastric carcinoma: diffuse and so called intestinal-type carcinoma. An attempt at a histo-clinical classification. Acta Pathol Microbiol Scand. 1965; 64:31–49.
2. McLean MH, El-Omar EM. Genetics of gastric cancer. Nat Rev Gastroenterol Hepatol. 2014; 11:664–674. doi: 10.1038/nrgastro.2014.143.
3. Wang K, Kan J, Yuen ST, Shi ST, Chu KM, Law S, Chan TL, Kan Z, Chan AS, Tsui WY, Lee SP, Ho SL, Chan AK, et al. Exome sequencing identifies frequent mutation of ARID1A in molecular subtypes of gastric cancer. Nat Genet. 2011; 43:1219–1223. doi: 10.1038/ng.982.
4. Zang ZJ, Cutcutache I, Poon SL, Zhang SL, McPherson JR, Tao J, Rajasegaran V, Heng HL, Deng N, Gan A, Lim KH, Ong CK, Huang D, et al. Exome sequencing of gastric adenocarcinoma identifies recurrent somatic mutations in cell adhesion and chromatin remodeling genes. Nat Genet. 2012; 44:570–574. doi: 10.1038/ng.2246.
5. Wang K, Yuen ST, Xu J, Lee SP, Yan HH, Shi ST, Siu HC, Deng S, Chu KM, Law S, Chan KH, Chan AS, Tsui WY, et al. Whole-genome sequencing and comprehensive molecular profiling identify new driver mutations in gastric cancer. Nat Genet. 2014; 46:573–582. doi: 10.1038/ng.2983.
6. Alotaibi H, Basilicata MF, Shehwana H, Kosowan T, Schreck I, Braeutigam C, Konu O, Brabletz T, Stemmler MP. Enhancer cooperativity as a novel mechanism underlying the transcriptional regulation of E-cadherin during mesenchymal to epithelial transition. Biochim Biophys Acta. 2015; 1849:731–742. doi: 10.1016/j.bbagrm.2015.01.005.
7. van Roy F, Berx G. The cell-cell adhesion molecule E-cadherin. Cell Mol Life Sci. 2008; 65:3756–3788. doi: 10.1007/s00018-008-8281-1.
8. Paredes J, Figueiredo J, Albergaria A, Oliveira P, Carvalho J, Ribeiro AS, Caldeira J, Costa AM, Simões-Correia J, Oliveira MJ, Pinheiro H, Pinho SS, Mateus R, et al. Epithelial E- and P-cadherins: role and clinical significance in cancer. Biochim Biophys Acta. 2012; 1826:297–311. doi: 10.1016/j.bbcan.2012.05.002.
9. Carneiro P, Fernandes MS, Figueiredo J, Caldeira J, Carvalho J, Pinheiro H, Leite M, Melo S, Oliveira P, Simões-Correia J, Oliveira MJ, Carneiro F, Figueiredo C, et al. E-cadherin dysfunction in gastric cancer—cellular consequences, clinical applications and open questions. FEBS Lett. 2012; 586:2981–2989. doi: 10.1016/j.febslet.2012.07.045.
10. Corso G, Carvalho J, Marrelli D, Vindigni C, Carvalho B, Seruca R, Roviello F, Oliveira C. Somatic mutations and deletions of the E-cadherin gene predict poor survival of patients with gastric cancer. J Clin Oncol. 2013; 31:868–875. doi: 10.1200/JCO.2012.44.4612.
11. Ferraz MA, Zabaglia LM, Pereira WN, Orcini WA, de Labio RW, Caleman Neto A, Wisnieski F, Calcagno DQ, Santos LC, Assumpção PP, Burbano RR, Artigiani R, Smith Mde A, et al. Downregulated Expression of E-cadherin and TP53 in Patients with Gastric Diseases: the Involvement of H. pylori Infection and Its Virulence Markers. J Gastrointest Cancer. 2016; 47:20–26. doi: 10.1007/s12029-015-9782-4.
12. Schmidt TP, Perna AM, Fugmann T, Böhm M, Jan Hiss, Haller S, Götz C, Tegtmeyer N, Hoy B, Rau TT, Neri D, Backert S, Schneider G, et al. Identification of E-cadherin signature motifs functioning as cleavage sites for Helicobacter pylori HtrA. Sci Rep. 2016; 6:23264. doi: 10.1038/srep23264.
13. Carvalho J, van Grieken NC, Pereira PM, Sousa S, Tijssen M, Buffart TE, Diosdado B, Grabsch H, Santos MA, Meijer G, Seruca R, Carvalho B, Oliveira C. Lack of microRNA-101 causes E-cadherin functional deregulation through EZH2 up-regulation in intestinal gastric cancer. J Pathol. 2012; 228:31–44. doi: 10.1002/path.4032.
14. Stemmler MP, Hecht A, Kemler R. E-cadherin intron 2 contains cis-regulatory elements essential for gene expression. Development. 2005; 132:965–976. doi: 10.1242/dev.01662.
15. Pinheiro H, Carvalho J, Oliveira P, Ferreira D, Pinto MT, Osório H, Licastro D, Bordeira-Carriço R, Jordan P, Lazarevic D, Sanges R, Stupka E, Huntsman D, et al. Transcription initiation arising from E-cadherin/CDH1 intron2: a novel protein isoform that increases gastric cancer cell invasion and angiogenesis. Hum Mol Genet. 2012; 21:4253–4269. doi: 10.1093/hmg/dds248.
16. Oliveira P, Sanges R, Huntsman D, Stupka E, Oliveira C. Characterization of the intronic portion of cadherin superfamily members, common cancer orchestrators. Eur J Hum Genet. 2012; 20:878–883. doi: 10.1038/ejhg.2012.11.
17. Huggett JF, Foy CA, Benes V, Emslie K, Garson JA, Haynes R, Hellemans J, Kubista M, Mueller RD, Nolan T, Pfaffl MW, Shipley GL, Vandesompele J, et al. The digital MIQE guidelines: Minimum Information for Publication of Quantitative Digital PCR Experiments. Clin Chem. 2013; 59:892–902. doi: 10.1373/clinchem.2013.206375.
18. Schmittgen TD, Livak KJ. Analyzing real-time PCR data by the comparative C(T) method. Nat Protoc. 2008; 3:1101–1108.
19. Stănculescu D, Mărgăritescu C, Stepan A, Mitruţ AO. E-cadherin in gastric carcinomas related to histological prognostic parameters. Rom J Morphol Embryol. 2011; 52:1107–1112.
20. Takahashi K, Yan IK, Kim C, Kim J, Patel T. Analysis of extracellular RNA by digital PCR. Front Oncol. 2014; 4: 129. doi: 10.3389/fonc.2014.00129.
21. Rosivatz E, Becker I, Specht K, Fricke E, Luber B, Busch R, Höfler H, Becker KF. Differential expression of the epithelial-mesenchymal transition regulators snail, SIP1, and twist in gastric cancer. Am J Pathol. 2002; 161:1881–1891. doi: 10.1016/S0002-9440(10)64464-1.
22. Yang M, Kim HS, Cho MY. Different methylation profiles between intestinal and diffuse sporadic gastric carcinogenesis. Clin Res Hepatol Gastroenterol. 2014; 38:613–620. doi: 10.1016/j.clinre.2014.03.017.
23. Ibarrola-Villava M, Llorca-Cardeñosa MJ, Tarazona N, Mongort C, Fleitas T, Perez-Fidalgo JA, Roselló S, Navarro S, Ribas G, Cervantes A. Deregulation of ARID1A, CDH1, cMET and PIK3CA and target-related microRNA expression in gastric cancer. Oncotarget. 2015; 6:26935–26945. doi: 10.18632/oncotarget.4775.
24. Pal S, Gupta R, Davuluri RV. Alternative transcription and alternative splicing in cancer. Pharmacol Ther. 2012; 136:283–294. doi: 10.1016/j.pharmthera.2012.08.005.
25. Biamonti G, Catillo M, Pignataro D, Montecucco A, Ghigna C. The alternative splicing side of cancer. Semin Cell Dev Biol. 2014; 32:30–36. doi: 10.1016/j.semcdb.2014.03.016.
26. Chan AO, Lam SK, Wong BC, Wong WM, Yuen MF, Yeung YH, Hui WM, Rashid A, Kwong YL. Promoter methylation of E-cadherin gene in gastric mucosa associated with Helicobacter pylori infection and in gastric cancer. Gut. 2003; 52:502–506.
27. Huang FY, Chan AO, Rashid A, Wong DK, Cho CH, Yuen MF. Helicobacter pylori induces promoter methylation of E-cadherin via interleukin-1β activation of nitric oxide production in gastric cancer cells. Cancer. 2012; 118:4969–4980. doi: 10.1002/cncr.27519.
28. Grabowska MM, Day ML. Soluble E-cadherin: more than a symptom of disease. Front Biosci (Landmark Ed). 2012; 17:1948–1964.
29. Hoy B, Löwer M, Weydig C, Carra G, Tegtmeyer N, Geppert T, Schröder P, Sewald N, Backert S, Schneider G, Wessler S. Helicobacter pylori HtrA is a new secreted virulence factor that cleaves E-cadherin to disrupt intercellular adhesion. EMBO Rep. 2010; 11:798–804. doi: 10.1038/embor.2010.114.
30. Juhasz M, Ebert MP, Schulz HU, Röcken C, Molnar B, Tulassay Z, Malfertheiner P. Dual role of serum soluble E-cadherin as a biological marker of metastatic development in gastric cancer. Scand J Gastroenterol. 2003; 38:850–55.