
INTRODUCTION
Colorectal cancer (CRC) is a relatively common cancer that has a high mortality [1]. Prolonged periods of chronic colitis significantly increase the risk of CRC and early metastasis [2–3]. CRC occurs in the intestinal tract, which is often described as the “neglected endocrine organ” where more than 1014 microbes live. Interestingly, the number of microbes in gut is ten times higher than the number of human cells [4–5]. Dysbiosis of the gut microbiota has been associated with gastrointestinal diseases such as inflammatory bowel disease (IBD), type 2 diabetes, obesity, CRC, and other metabolic diseases [6–7].
Using quantitative PCR, Sobhani et al. demonstrated that the ratio of Bacteroides to Prevotella was significantly increased in CRC patients [8]. The abundance of probiotics such as Bifidobacterium, Lactobacillus, and Ruminococcus were reduced in CRC patients [9]. Arthur et al. found that polyketide synthase genotoxic islands in the commensal Escherichia coli NC101 had a larger carcinogenic effect in the presence of intestinal inflammation [10]. Bacteria not only induce carcinogenesis, but can also produce metabolites that influence CRC progression [11]. Some metabolites including acetate, propionate, and butyrate may inhibit CRC while deoxycholic acid and lithocholic acid were shown to directly promote carcinogenesis [12]. Short chain fatty acids, particularly butyrate, can suppress inflammation and prevent CRC through several signaling pathways [13].
Many animal CRC models have been established to investigate the association between gut microbes and CRC initiation and progression. The models are based on both genetic engineering (e.g. ApcMin/+, Muc2−/−, and IL-10−/− mice [14–16]) and chemical stimulation (e.g. 1, 2-dimethylhydrazine [1, 2-DMH]-treated mice and azoxymethane and dextran sulphate sodium (AOM/DSS)-induced mice [17–18]). The AOM/DSS-induced mouse model of CAC (CACM) is the most accepted CAC animal model [19–20].
Isoliquiritigenin (ISL) is a flavonoid extracted from liquorice that has anti-inflammatory and antioxidant properties [21–22]. At specific doses, ISL could reduce mouse morbidity during influenza virus infection by suppressing the inflammatory response and inhibiting viral replication [23]. ISL could also act as an anti-cancer agent by inhibiting DNA topoisomerase during glioma cell growth [24]. Previous studies have demonstrated that ISL blocks M2 macrophage polarization in the colitis-associated tumorigenesis by down regulating PGE2 and IL-6 [25]. However, the effect of ISL on gut microbiota dynamics during CAC development has not been investigated.
In this study, we used the CACM to evaluate whether ISL treatment could protect against CAC development. The anti-cancer effects of ISL were evaluated by histopathological analysis and quantification of the abundance of inflammation-associated factors/cytokines. Dynamic changes in gut bacteria were elucidated using quantitative PCR (qPCR), terminal restriction fragment length polymorphism (T-RFLP) analysis, and high-throughput sequencing of the 16S rRNA gene.
RESULTS
ISL prevents CAC development in BALB/c mice
The inflammation-based murine model of tumorigenesis in SPF BALB/c mice can be replicated using intraperitoneal injection of azoxymethane (AOM) and water-administered 2% dextran sodium sulfate (DSS) (Figure 1). The body weights of healthy control mice treated with 150 mg/kg ISL (ISL + CK mice) were similar to those of healthy control mice (CK mice) (Figure 1A). AOM/DSS induced CAC treatment (CACM) caused a significant loss of body weight, which was rescued by ISL treatment (AOM/DSS + 150 mg/kg ISL, CIH; AOM/DSS + 75 mg/kg ISL, CIM; AOM/DSS + 30 mg/kg ISL, CIL). We developed a disease activity index (DAI) curve to evaluate disease progression, which was based on weight, hematochezia, and stool malformation [26]. There were three peaks corresponding to the three cycles of DSS administration (in drinking water) when hematochezia and stool malformation were observed (Figure 1B). All mice in the CACM treatment group developed rectal prolapse (Figure 1C). We next evaluated the histopathological characteristics of tumor tissue samples from each group of mice (Figure 1D–1E). The multiplicity (number of tumors per mouse) in the CACM, CIL, CIM, and CIH treatment groups was 18 ± 0.35, 16 ± 0.47, 12.5 ± 0.35, and 7.5 ± 0.7, respectively. ISL decreased the incidence of cancer by 25%, 50%, and 50% at doses of 30 mg/kg, 75 mg/kg, and 150 mg/kg, respectively. Similar results were obtained at the 18th week (Supplementary Figure S1).
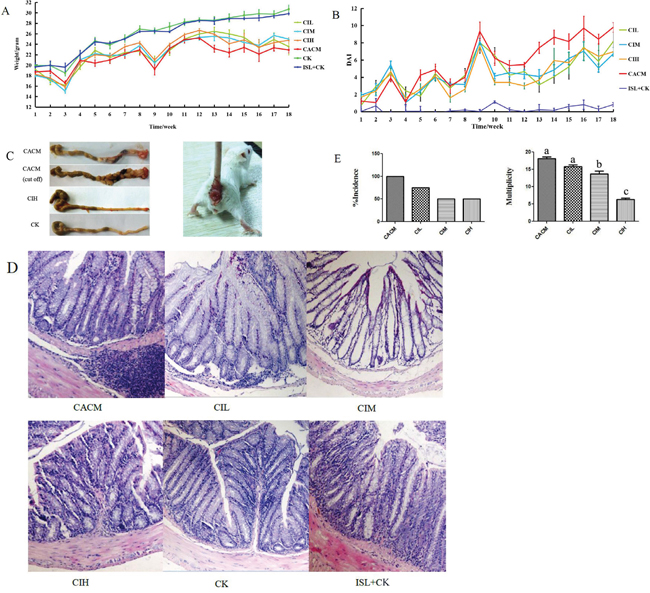
Figure 1: ISL protects mouse gastrointestinal tracts from AOM/DSS-induced CAC. A. Changes in body weight. B. DAI based on weight loss, hematochezia, and diarrhea. C. Left, Macroscopic view of colon tumors at the 12th week. Right, Rectal prolapse at the 12th week in the CACM. D. Representative images of hematoxylin and eosin (HE) staining (original magnification, 100×) of mouse colon tissue at the 12th week. E. Left, tumor incidence (percentage of tumor-bearing mice); Right, Tumor multiplicity (number of tumors per mouse). The results are presented as the mean ± standard error of the mean (SEM); n = 4 for each treatment.
By the 12th week, colorectal tumors formed in AOM/DSS-treated mice (CACM). To evaluate the association between the anti-cancer effects of ISL and pro-inflammatory factors/cytokines in AOM/DSS-treated mice, we quantified the levels of these factors/cytokines in mouse colon epithelial tissue samples. In the CACM, the levels of many cytokines including IL-6, IL-10, TNF-α, IL-1β, and the inflammatory factor COX-2 were increased. However, following ISL treatment, the levels decreased (Figure 2). Similar results were observed at the 18th week (Supplementary Figure S2).
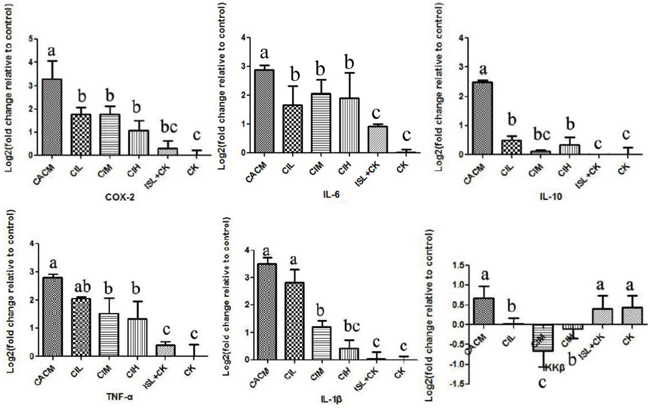
Figure 2: ISL inhibition of cytokine upregulation in CACM at the 12th week. Significant differences (P < 0.05) between treatments are indicated by the letters a, b, or c. The results are presented as the mean ± SEM; n = 4 for each treatment.
Dynamic changes in the microbiota based on T-RFLP analysis
Using correspondence analysis (CA), we determined that the gut bacterial community structure changed significantly during CAC development (Supplementary Figure S3). During the 1st week, the community structures were similar among all the mice (Supplementary Figure S3A). However, hematochezia and diarrhea were observed in samples from AOM/DSS-treated mice (CACM, CIL, CIM, and CIH mice) starting at the 3rd week. The CACM samples were outliers compared to the other samples, which suggested that the gut bacterial community structure in the CACM differed from that in all other mice (Supplementary Figure S3B-S3D). Samples from CIL, CIM, and CIH mice were located between those of the CACM (no ISL treatment) and CK mice, which suggested that ISL protected the gut bacterial community structure from disease-associated changes. At the 12th and 18th week, the samples collected from CIH, ISL + CK, and CK mice were located on the same side of the 2-D biaxial and were outliers compared to all other treatment groups (Supplementary Figure S3E-S3F). These results suggested that the community structure was stable after the completion of the CACM at the 12th week. The CK and CK + ISL samples clustered together throughout the experiment (Supplementary Figure S3), which indicated that ISL alone did not cause a significant shift in the gut microbiota.
Analysis of the abundance of bacteriodes spp. and total bacteria by real-time qPCR
We next examined the abundance of Bacteriodes spp. and total bacteria in mouse fecal samples. Universal primers (341F/518R) for the bacterial 16S rRNA gene and Bacteriodes spp.-specific primers (Bfr-F/Bfr-R) were used to amplify fecal microbial DNA (Supplementary Table S1). We found that ISL significantly increased the abundance of Bacteriodes spp. (1.36% in CACM vs. 2.8% in CIH mice) at the 12th week, P = 0.02) (Supplementary Table S2). Interestingly, compared to the CACM (no ISL treatment), a higher abundance of total bacteria was observed after low- and medium-dose ISL treatment (CIL and CIM mice). No significant difference was detected after treatment with highdose ISL (CIH mice).
Analysis of the diversity and richness of the microbiome using 16S rRNA sequencing
To characterize the microbiome associated with CRC, high-throughput sequencing of the bacterial 16S rRNA gene was performed in fecal samples from mice in the CK, CACM (no ISL treatment), and CIH treatment groups at the 3rd, 6th, and 12th weeks. Community diversity was estimated using the PD_whole_tree, Chao1, and Shannon index, and richness was evaluated based on the number of operational taxonomic units (OTUs). The Shannon index and richness were higher in the CACM than in the CK mice (Table 1). However, the Shannon index was lower in CIH mice. No significant differences were observed between the CIH and CK or between the CIH and CACM treatment groups (Table 1). ISL increased the richness of the gut microbiota in the CIH compared to the CACM and CK treatment groups. No significant differences in the PD_whole_tree or Chao1 metrics were observed between treatment groups.
Table 1: Bacterial diversity analyzed by high-throughput sequencing
Treatment |
Richness |
PD_whole_tree |
Chao1 |
Shannon-Index |
|---|---|---|---|---|
CACM |
43343 b |
34.15 a |
958.53 a |
6.37 a |
CIH |
51677 a |
37.45 a |
1034.16 a |
6.13 ab |
CK |
41259 c |
31.08 a |
966.05 a |
5.77 b |
Note: Significant differences (P < 0.05) between groups are marked with the letters a, b, or c. The results are presented as the mean ± SEM; n = 4 for each treatment.
Comparison of the gut bacterial community composition during CAC development
A phylogenetic tree was generated to examine changes in the gut bacterial community composition in response to each treatment. The greatest variations in the gut microbiota were observed at the 12 th week in the CACM (Figure 3). Notably, minimal inter-mouse variation was observed at all time points in the CK and CIH mice. The reproducibility of the samples in the CACM group was influenced by severe diarrhea and bleeding. The gut bacterial community composition changed with age in the CACM and CIH treatment groups, but remained relatively stable in the CK group. Compared to the microbiota at the 6th week, the bacterial community structure markedly shifted at the 12th week in the CACM and CIH mice.
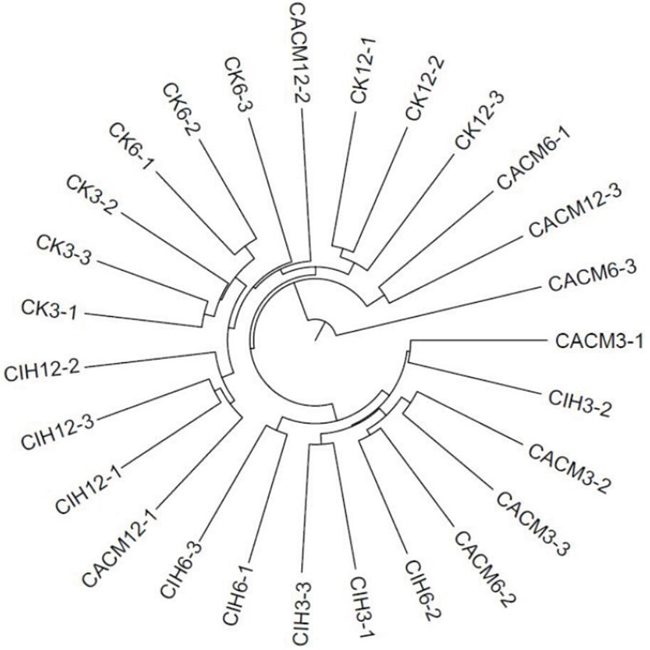
Figure 3: Phylogenetic tree. The numbers correspond to the specimens and treatment week (e.g. CK3-1 denotes the first sample for the CK mice at the 3rd week.
Linear discriminant analysis (LDA) coupled with effect size measurements was performed to detect core microbes in the mouse gastrointestinal tracts. The core microbes in the CK, CACM, and CIH treatment groups differed at the 12th week (Figure 4). Turicibacter, Turibacteraceae, Turicibacterales, Eubacteriaceae, and Anaerofustis were the core microbes observed in the CACM, while Bacteroidia, S24-7, Bacteroidales, unclassified_S24_7_f, Corynebacterium, unclassified_Rilkenellaceae_f, AF12, Butyricicoccus, unclassified_Erysipelotrichaceae_f, Dehalobacteriaceae, and Dehalobacterium were the core microbes in CK treatment group (Figure 4A–4B). Turicibacter, Turibacteraceae, and Turicibacterales were also the core microbes in the CACM treatment group, whereas Butyricicoccus,Dehalobacteriaceae, Dehalobacterium, Clostridium, Ruminococcus, and Bacteroidates were the core microbes in the CIH treatment group (Figure 4C). ISL significantly increased microbial richness (Table 1) relative to the CACM treatment group, and resulted in a significant shift in the core microbes (Figure 4D).
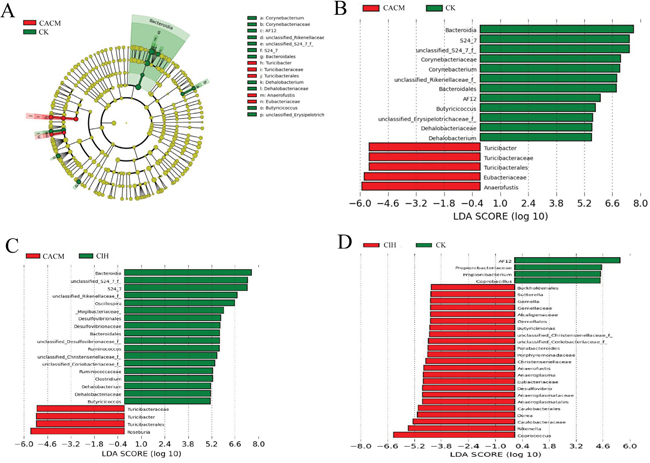
Figure 4: Differences in the community structures of gut microbes among the CACM, CIH, and CK mice. A. Taxonomic representation of statistically and biologically consistent differences between CACM and CK mice. Significant differences are represented by different colors (red and green represent the core microbes in the CACM and CK treatment groups, respectively; and yellow represents microbes that were shared between the CACM and CK treatment groups. B-D. Histogram of the LDA scores for differentially abundant genera between the two treatment groups.
To confirm the association between gut microbes and the effects of ISL treatment, we analyzed the abundance of various bacteria in fecal samples from each treatment group. At the phyla level, Bacteroidetes and Firmicutes were dominant in all of the mice (Figure 5). The levels of Bacteroidetes and Firmicutes changed dramatically in response to AOM and DSS. A significant decrease in the abundance of Bacteroidetes was detected at the 12th week (65.76% in the CK group vs. 29.31% in the CACM group, P = 0.017). In contrast, a significant increase in the abundance of Firmicutes was oberseved (29.25% in the CK group vs. 61.69% in the CACM group, P = 0.02) ISL treatment did not affect the phyla distribution between CIH and CK mice (Figure 5). During CAC development, the ratio of Firmicutes and Bacteroidetes (F/B) in the CACM group was significantly higher than the ratio in the CK and CIH groups (Supplementary Figure S4).
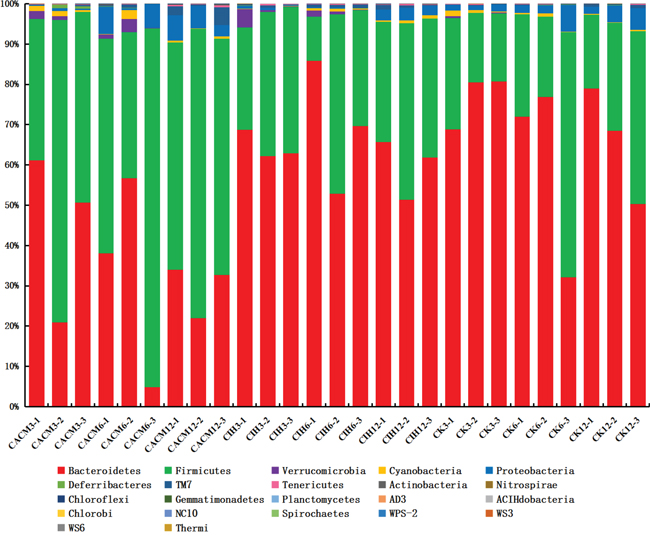
Figure 5: Relative abundance of the main phyla in the intestinal microbiota.
At the family level, the abundance of S24-7 and Rikenellaceae decreased, while the abundance of Helicobacteraceae and Lachnospiraceae increased in the CACM compared to CK groups. ISL promoted recovery of the gut microbial community composition at the family level in the CIH group (Figure 6A). There was no significant difference between the gut microbiota in the CIH and CK groups with the exception of the Lachnospiraceae family (31.92% vs. 38.55%, P = 0.037).
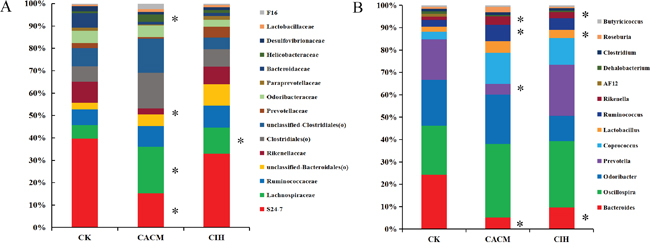
Figure 6: Relative abundance according to family A. and genus B. for bacteria that exceeded 1% of the total in the three treatment groups. *, P < 0.05 compared to CK mice.
At the genus level, 15 genera exceeded 1% of the total bacteria (Figure 6B). Consistent with the qPCR results, the abundance of Bacteroides decreased in the CACM group (1.14% in the CACM group vs. 6.18% in the CK group, P = 0.039). Compared to the gut microbes in the CK group, the abundance of Prevotella decreased (3.26% in the CK group vs. 0.66% in the CACM group, P = 0.05), while the abundance ofCoprococcus increased (0.86% in the CK group vs. 3.05% in the CACM group, P = 0.023). ISL treatment increased the abundance of Prevotella in the CIH group (0.66% in the CACM vs. 4.68% in the CIH group) at the 12th week. No significant difference in the abundanceof Prevotella was observed between the CIH and CK groups. Low abundance genera (< 1%) such as Akkermansia, Anaeroplasma and Butyricimonas were only detected in the CACM and CIH groups. In contrast, AF12 was only detected in the CK group. The abundance of three genera (Lachnospiraceae(f),unclassified-S24-7(f) and Escherichia) were significantly increased in the CACM group compared to the CK and CIH groups. Significant changes among the genera at the 12th week are shown in Table 2. A heatmap based on genera abundance is shown in Supplementary Figure S5.
Table 2: Genera that differed significantly between CACM and CK mice, or CIH and CK mice
Phylum |
Genus |
Relative abundance (%) |
Range (%) |
P-value |
Direction of change |
||
|---|---|---|---|---|---|---|---|
CACM |
CK |
CACM |
CK |
||||
Bacteroidetes |
AF12 |
0 |
0.32 |
0 |
0.21 - 0.41 |
0.0053 |
↓ |
Bacteroidetes |
Bacteriodes |
1.14 |
6.18 |
0.23 - 2.48 |
3.66 - 10.7 |
0.039 |
↓ |
Bacteroidetes |
unclassified-S24-7(f) |
14.5 |
38.55 |
9.57 - 23.6 |
26.31 - 52.65 |
0.05 |
↓ |
Bacteroidetes |
Prevotella |
0.66 |
3.26 |
0.011 - 1.85 |
2.10 - 3.07 |
0.05 |
↓ |
Verrucomicrobia |
Akkermansia |
9.00E-03 |
0 |
7.2e-3 - 9.91e-3 |
0 |
0.00059 |
↑ |
Proteobacteria |
Escherichia |
0.15 |
5.00E-03 |
0.108 - 0.18 |
2.5e-3 - 8.3e-3 |
0.0031 |
↑ |
Bacteroidetes |
Butyricimonas |
9.30E-02 |
0 |
1.4e-2 - 6.8e-2 |
0 |
0.02 |
↑ |
Firmicutes |
Lachnospiraceae (f) |
30.4 |
11.26 |
25.51 - 37.92 |
8.61 - 15.20 |
0.012 |
↑ |
Firmicutes |
Coprococcus |
3.05 |
0.86 |
2.42 - 4.08 |
0.52 - 1.49 |
0.023 |
↑ |
Firmicutes |
Anaerotruncus |
3.30E-02 |
0.0086 |
2.6e-2 - 4.1e-2 |
2.5e-3 - 8.3e-3 |
0.027 |
↑ |
CIH |
CK |
CIH |
CK |
||||
|---|---|---|---|---|---|---|---|
Bacteroidetes |
AF12 |
0 |
0.32 |
0 |
0.21-0.41 |
0.0053 |
↓ |
Actinobacteria |
Propionibacterium |
5.20E-04 |
2.20E-03 |
0 - 1.6e-3 |
2.1e-3 - 2.45e-3 |
0.033 |
↓ |
Bacteroidetes |
Bacteriodes |
1.4 |
6.18 |
0.39 - 2.42 |
3.66 - 10.7 |
0.042 |
↓ |
Bacteroidetes |
Butyricimonas |
9.20E-03 |
0 |
7.1e-3 - 0.011 |
0 |
0.0016 |
↑ |
Proteobacteria |
Sutterella |
3.60E-02 |
0.016 |
3.2e-2 - 4.0e-2 |
1.5e-2 - 1.8e-2 |
0.0017 |
↑ |
Tenericutes |
Anaeroplasma |
2.70E-02 |
0 |
0.018 - 1.6e-2 |
0 |
0.0063 |
↑ |
Firmicutes |
Coprococcus |
3.16 |
0.86 |
2.68 - 3.72 |
0.52 - 1.50 |
0.0064 |
↑ |
Firmicutes |
Anaerofustis |
1.40E-02 |
0.00082 |
9.0e-3 - 1.8e-2 |
0 - 2.5e-3 |
0.0085 |
↑ |
Firmicutes |
unclassified-Christensenellaceae(f) |
9.70E-03 |
0.0015 |
5.3e-3 - 1.3e-2 |
0 - 4.4e-3 |
0.036 |
↑ |
Bacteroidetes |
Parabacteroides |
3.70E-02 |
0.0074 |
1.9e-2 - 5.2e-2 |
4.4e-3 - 1.0e-2 |
0.039 |
↑ |
Firmicutes |
Gemella |
2.00E-02 |
0.00069 |
7.1e-3 -2.5e-2 |
0 - 2.1e-3 |
0.04 |
↑ |
Coprococcus, Butyricimonas, Roseburia, Clostridium, Ruminococcus, and Butyricicoccus were the butyrate-producing bacteria identified in this study. The total abundance of butyrate-producing bacteria was 16.22% in the CACM group, 13.9% in the CIH group, and 6.03% in the CK group. Butyricimonas was only detected in the AOM/DSS-induced CAC mice (0.07% in the CACM group and 0.0082% in the CIH group). The abundance of Roseburia was slightly higher in the CACM (0.68%) compared to CIH (0.13%) and CK (0.2%) groups. The abundance of Coprococcus was higher in the CACM (3.05%) and CIH groups (3.16%) compared to the CK group (0.86%). Finally, the abundance of Butyricicoccus, Clostridium, and Ruminococcus was higher in the CIH group than in the CACM and CK groups. Changes in butyrate-producing bacteria at the 12th week are shown in Supplementary Table S3.
DISCUSSION
Previous studies have indicated that bacteria are involved in the pathogenesis of colon cancer. For example, Newman et al. found that Citrobacter rodentium promoted colon cancer in ApcMin/+ mice, and Apidianakis et al. demonstrated a synergistic relationship between intestinal bacteria and genetic predisposition to intestinal dysplasia [14, 27]. Imbalances in microbiota can promote colon tumorigenesis through many pathways. The enterotoxigenic Bacteroides fragilis causes colitis, colonic hyperplasia, and tumor formation through activation of Stat3- and TH17-dependent pathways [28]. Additionally, vancomycin-sensitive bacteria induced colon inflammation and DNA damage by attracting neutrophils to damaged colon tissue, which promoted tumor formation [29]. In the present study, imbalances in the microbiota were observed in the CACM. Treatment with ISL alleviated the imbalances, reduced inflammation, and inhibited CAC development.
Following ISL treatment, the abundance of Helicobacteraceae decreased while the abundance of Lachnospiraceae and Rikenellaceae increased. These changes were consistent with previous studies both in animal models and in patients. The abundance of Helicobacteraceae increased in IBD patients [30], while the abundance of Rikenellaceae decreased in Muc2−/− mice that spontaneously developed CAC [31]. Zackular et al. found reduced Lachnospiraceae in CRC patients. Some OTUs belonging to Lachnospiraceae may help to maintain healthy gastrointestinal tracts and could be tools to assess gut health [32]. Therefore, the increases in Lachnospiraceae and Rikenellaceae abundance could modify the gut environment and enhance the antitumor efficacy of ISL.
Previous studies have demonstrated a reduction in the abundance of Turicibacter in the gastrointestinal tracts of mice with colitis (DSS-induced and IL-22-deficient mice) [33–34]. However, we observed an increase in Turicibacter in the CACM. The increase in Turicibacter could have been induced by AOM treatment. In contrast, the abundance of Turicibacter was reduced in the CIH mice, which had a lower incidence of colon tumorigenesis. Thus, Turicibacter could be a tool to detect health status of the gut.
Consistent with previous studies [35–36], we confirmed that the abundance of Bacteroidetes decreased while the abundance of Firmicutes increased during CAC development. ISL treatment prevented disease-induced changes in the gut microbial community structure. The discrepancy in Bacteroidetes resulted in significant differences between the CACM and the CK mice. Zackular et al. found that the abundance of Prevotella (Bacteroidetes) decreased during CAC development [37]. We also observed a decrease in Prevotella in the CACM compared to CK group. After treatment of CACM with ISL, the abundance of Prevotella increased to a normal level. No significant differences were observed compared to the CK group (4.28% in the CIH group vs. 3.26% in the CK group, P = 0.74), which suggested that ISL could increase the abundance of Prevotella in the CACM.
Increasing evidence suggests that gut microbial metabolites are crucial for the maintenance of health [38]. Imbalances in butyrate-producing bacteria have been commonly observed in CAC patients [39–41]. Previous studies reported that butyrate had potent activity against CRC. It reduced oxidative damage to DNA, induced apoptosis in cells with DNA damage, and inhibited tumor cell growth [42]. The increase of butyrate-producing bacteria in CIH mice suggested that ISL had the ability to increase some butyrate-producing bacteria in the gut (e.g. Butyricicoccus, Clostridium, and Ruminococcus). Butyricicoccus enhanced intestinal epithelial barrier function and protected the gastrointestinal tracts of CAC patients [43–45]. Clostridium and Ruminococcus were the core microbes detected in the CIH treatment group, which suggests that they may play a key role in maintaining normal microbial balance.
Akkermansia was detected in fecal samples from CACM and CIH mice, but not the CK mice. Previous studies have indicated that the abundance of Akkermansia was positively correlated with colonic tumor multiplicity and size [37, 46], and that the abundance of Akkermansia in the gut was significantly increased in CRC patients [39, 47] Akkermansia municiphila is a component of the healthy gut microbiome and a potential probiotic, but it was positively correlated with the ratio of colon cancer [48]. We suspect it may be correlated with the abnormal gut environment induced by colitis and CRC. The abundance of Escherichia and Enterococcus, which are both opportunistic pathogens, was increased in CAC patients [49–50]. Consistent with these data, we found that the abundance of Enterococcus was also increased in CACM compared to CK mice (0.011% vs. 6.9E-4%), and was below the detection limit in CIH mice. The substantial reduction in the abundance of Enterococcus in CIH mice could be related to the anti-cancer effects of ISL. ISL may inhibit CAC development by reducing the abundance of some opportunistic pathogens.
ISL treatment is an effective means of controlling infection induced by certain types of bacteria and viruses. For example, Feldman et al. demonstrated that ISL has antibacterial activity against three major periodontopathogens: Porphyromonas gingivalis, Fusobacterium nucleatum, and Prevotella intermedia [51]. Moreover, the combination of ISL and oxacillin significantly lowered the systemic microbial burden of methicillin-resistant Staphylococcus aureus in the blood, liver, kidney, lung and spleen compared to ISL or oxacillin alone, as well as untreated controls [52]. However, the mechanisms underlying these effects are unclear. Some studies have reported that ISL suppresses inflammation through inhibition of nuclear factor-κB activation [53–57]. However, further studies are needed to fully test this hypothesis.
In conclusion, we have confirmed that ISL has anti-CAC effects. The composition of the gut microbiota in the CACM was restored upon ISL-treatment. The abundance of opportunistic pathogens were reduced (Escherichia and Enterococcus), while the abundance of Prevotella, Butyricicoccus, Clostridium, and Ruminococcus was elevated in the modified microbiota. These bacteria may cooperate with ISL to inhibit CAC development. Our study provides new evidence that traditional Chinese medicines may prevent CRC, in part through regulating the gut microbiota.
MATERIALS AND METHODS
Animals and reagents
Six-week-old male BALB/c mice (18–20g) were purchased from Vital River Laboratory Animal Technology Co. Ltd. (Beijing, China). All animals were housed in plastic cages (with eight mice/cage) under controlled conditions (humidity [55 ± 5%], light [12 h light/dark cycle], and temperature [23 ± 2°C]). AOM was purchased from Sigma-Aldrich (St. Louis, MO, USA) and DSS was purchased from MP Biomedicals (molecular weight: 36–50 kDa, MP Biomedicals, Santa Ana, CA, USA). ISL was purchased from Melone Pharmaceutical (molecular weight: 256.25, Dalian, China). Different doses of ISL (30, 75, and 150 mg/kg) were dissolved in 0.5% sodium carboxymethyl cellulose (CMCC-Na) solution. AOM was dissolved in normal saline to a final concentration of 0.5 mg/mL.
Experimental procedures
Forty-eight six-week-old male BALB/c mice were divided into six groups: blank control treatment (CK, n = 8), ISL control treatment (ISL + CK, n = 8), AOM/DSS-induced CACM only (n = 8), and three groups of CACM mice treated with different dosages of ISL (CIL [30 mg/kg], CIM [75 mg/kg], and CIH [150 mg/kg) (n = 8 in each treatment). CK and ISL + CK mice were given sterile drinking water and fed a standard rodent chow diet for 12 or 18 weeks. The procedure for generating the CACM is shown in Figure 7. The mice were injected intraperitoneally with a single dose of AOM (10 mg/kg) on the first day. One week after AOM injection, three experimental courses of DSS were administered. For each course, the mice (CACM) were given drinking water containing 2% DSS for one week followed by sterile drinking water for two weeks. For ISL treatment, different doses of ISL (30, 75, and 150 mg/kg) were administered intragastrically six times per week starting on the first day of the study. ISL + CK mice were gavaged with 150 mg/kg ISL six times per week without AOM/DSS treatment. Animal weights were evaluated and recorded at the end of each week.
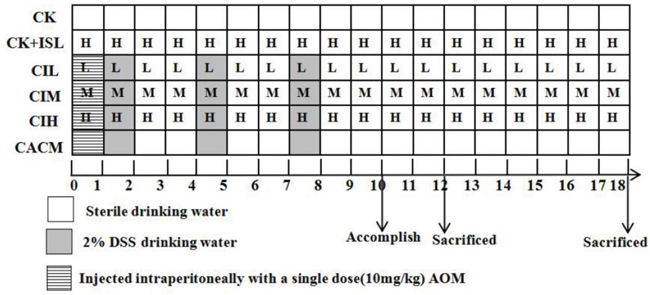
Figure 7: Experimental protocol. Different doses of ISL are represented by the letters in the squares, (H, M, and L correspond to ISL doses of 150 mg/kg, 75 mg/kg, and 30 mg/kg, respectively). Mice in each treatment group were sacrificed at the 12th and 18th week based on the model.
Feces collection and bacterial DNA extraction
Fecal samples were collected at the end of each week and stored at -80°C. Bacterial DNA was extracted with the QIAamp DNA Stool Mini Kit (Qiagen, Hilden, Germany) according to the manufacturer’s instructions. The quality and quantity of the DNA was evaluated by 1% (w/v) agarose gel electrophoresis in 0.5 mg/mL ethidium bromide and Nano Drop 2000 ultraviolet spectrophotometry.
T-RFLP analysis
To evaluate the gut microbiota, feces were collected from all mice at the 1st, 3rd, 6th, 12th, and 18th week and T-RFLP analysis performed. Bacterial DNA was amplified with bacterial 16S rRNA gene-specific primers: 8F (5’-FAM-AGAGTTTGATCATGGCTCAG-3’) and 1492R (5’-GGTTACCTTGTTACGACTT-3’) [58], which included a FAM label at the 5’end of the 8F primer. The PCR products were purified with an agarose gel recovery kit (DP214, Tiangen, China) according to the manufacturer’s instructions. Restriction digests were performed with MspI (Hpa, Hap II) (Takara, Dalian, China) according to the manufacturer’s instructions. PCR products (20 μL) were incubated for 4 hr at 37°C followed by 80°C for 20 min. The fragments (T-RFs) were desalinated by ethanol precipitation and then mixed with an internal size standard (LIZ500) at 95°C for 5 min. The fragments were sequenced with a DNA Sequencer in the range of 50–1000 bp (ABI PRISM 3700, USA) and the results analyzed using the Peak Scanner (v1.0) and Gene Marker 2.20 software.
High-throughput sequencing of 16S rRNA
Based on the results of the T-RFLP analysis, 16S rRNA high-throughput sequencing was performed on fecal samples from CK, CACM, and CIH mice collected at the 3rd, 6th, and 12th weeks. Genomic DNA was extracted from fecal samples using the QIAamp DNA Stool Mini Kit (Qiagen) according to the manufacturer’s instructions and evaluated by 1% agarose gel electrophoresis. Genomic DNA was then amplified in 50 μL triplicate reactions with bacterial 16S rRNA gene (V3-V5 region)-specific primers: 338F (5’-ACTCCTACGGGAGGCAGC-3’) and 806R (5’-GG ACTACHVGGGTWTCTAAT-3’) [59]. The reverse primer contained a sample barcode, and both primers were connected with an Illumina sequencing adapter. PCR products were purified and the concentrations adjusted for sequencing on an Illumina Miseq PE300 system (OEbiotech Co., Ltd., Shanghai, China).
Histopathological analysis
After the mice were sacrificed, colon specimens were dissociated and washed with cold PBS, cut off approximately 3 mm piece and fixed in 10% formaldehyde. The remaining colon tissue was used to isolate enterocytes. The fixed tissues were embedded in paraffin, sectioned, and stained for histopathological analysis [58].
Reverse transcription qPCR
Mouse colonic epithelial cells were collected using published protocols [60–63]. Total mRNA was extracted using the Trizol reagent and colonic epithelial cytokines evaluated by reverse transcription qPCR (RT-qPCR). The results were analyzed using the ΔΔCt method [64]. Fecal DNA was amplified with bacterial 16S rRNA-specific primers and the relative quantities of total bacteria and Bacteroides spp. analyzed. Target gene copy number was determined by comparison to a standard curve. PCR reactions were performed using the StepOne System (ABI). The primer sequences and qPCR amplification protocol are shown in Supplementary Table S4.
Bioinformatics and statistical analysis
For T-RFLP analysis, the abundance of T-RFs (< 1%) with lengths < 30 bp were filtered. T-RFs that differed by ± 1 bp were combined into a single T-RF. CA of the bacterial community structures was performed using the Canoco for Windows 4.5 software.
For high-throughput sequencing, raw reads were processed with the Trimmomatic software. First, pair reads were merged according to their overlap. The sequences were then filtered according to the barcode and primer sequences (the barcodes could not be mispaired and the highest number of mispaired primer sequences was two. The optimized sequences were clustered into OTUs with 97% similarity using Usearch (version 7.1 http://drive5.com/uparse/). The OTUs were used to estimated community diversity and richness. The alpha diversity analysis was performed with mothur (version v. 1.30.1 http://mothur.org/). The Shannon index, PD_whole_tree, and Chao1 were used to estimate community diversity, while richness was calculated based on the number of OTUs. A heatmap based on Bray-Curtis was made with the R vegan kit (R package 2.7.1).
Statistical analyses
Microbial taxonomy features were analyzed using Mann-Whitney tests (SPSS 19.0, Chicago, IL, USA). Significant differences in the diversity index, richness, cytokine abundance, and tumor multiplicity were identified using repeated measures ANOVA with Tukey’s honestly significant difference (HSD) post hoc test in SPSS 19.0. Statistical tests were two-sided and a P < 0.05 was considered significant.
ACKNOWLEDGMENTS
We thank all participants from the Department of Pathology for their contributions to this study. This study was supported by the Natural Science Foundation of China (grant No. 81201765), Scientific Research and Cultivating Fund of Xinxiang Medical University (grant No. 2013ZD102), Key Scientific Research Projects for Higher Education of Henan Province (grant No. 17A310022; 15A320063; 12B310020), and the Graduate Student Support of Scientific Research Innovation Projects of Xinxiang Medical University (grant No. YJSCX20421Y).
CONFLICTS OF INTEREST
The authors declare that there are no conflicts of interest.
Author contributions
Genshen Zhong, Minna Wu, and Yaqi Wu conceived of and designed the experiments. Yaqi Wu, Minna Wu, Baoguo Deng, Jinsong Li, Haiying Cao, Yan Qu, Xinlai Qian, and Genshen Zhong performed the experiments. Yaqi Wu and Minna Wu analyzed the data. Minna Wu, Yaqi Wu, and Genshen Zhong wrote the manuscript.
REFERENCES
1. Sears CL, and Garrett WS. Microbes, microbiota, and colon cancer. Cell host & microbe. 2014; 15: 317-328.
2. Mangerich A, Knutson CG, Parry NM, Muthupalani S, Ye W, Prestwich E, Cui L, McFaline JL, Mobley M, Ge Z, Taghizadeh K, Wishnok JS, Wogan GN, et al. Infection-induced colitis in mice causes dynamic and tissue-specific changes in stress response and DNA damage leading to colon cancer. Proc Natl Acad Sci USA. 2012; 109: E1820-1829.
3. Terziæ J, Grivennikov S, Karin E, and Karin M. Inflammation and colon cancer. Gastroenterology, 2010; 138: 2101-2114.
4. Qin J, Li R, Raes J, Arumugam M, Burgdorf KS, Manichanh C, Nielsen T, Pons N, Levenez F, Yamada T, Mende DR, Li J, Xu J, et al. A human gut microbial gene catalogue established by metagenomic sequencing. Nature. 2010; 464: 59-65.
5. Clarke G, Stilling RM, Kennedy PJ, Stanton C, Cryan JF, and Dinan TG. Minireview: Gut microbiota: the neglected endocrine organ. Mol Endocrinol. 2014; 28: 1221-1238.
6. Kostic AD, Xavier RJ, and Gevers D. The microbiome in inflammatory bowel disease: current status and the future ahead. Gastroenterology. 2014; 146: 1489-1499.
7. Fei N, and Zhao L. An opportunistic pathogen isolated from the gut of an obese human causes obesity in germfree mice. ISME J. 2013; 7: 880-884.
8. Sobhani I, Tap J, Roudot-Thoraval F, Roperch JP, Letulle S, Langella P, Corthier G, Tran Van Nhieu J, and Furet JP. Microbial dysbiosis in colorectal cancer (CRC) patients. PloS one. 2011; 6: e16393.
9. Borges-Canha M, Portela-Cidade JP, Dinis-Ribeiro M, Leite-Moreira AF, and Pimentel-Nunes P. Role of colonic microbiota in colorectal carcinogenesis: A systematic review. Rev Esp Enferm Dig. 2015; 107. doi: 10.17235/reed.2015.3830/2015.
10. Arthur JC, Perez-Chanona E, Mühlbauer M, Tomkovich S, Uronis JM, Fan TJ, Campbell BJ, Abujamel T, Dogan B, Rogers AB, Rhodes JM, Stintzi A, Simpson KW, et al. Intestinal inflammation targets cancer-inducing activity of the microbiota. Science. 2012; 338: 120-123.
11. Ohtani N. Microbiome and cancer. Seminars in immunopathology. 2015; 37: 65-72.
12. Louis P, Hold GL, and Flint HJ. The gut microbiota, bacterial metabolites and colorectal cancer. Nat Rev Microbiol. 2014; 12: 661-672.
13. Vipperla K, and O’Keefe SJ. The microbiota and its metabolites in colonic mucosal health and cancer risk. Nutr Clin Pract. 2012; 27: 624-635.
14. Newman JV, Kosaka T, Sheppard BJ, Fox JG, Schauer DB. Bacterial infection promotes colon tumorigenesis in ApcMin/+mice. J Infect Dis. 2001; 184: 227-230.
15. Dennis KL, Wang Y, Blatner NR, Wang S, Saadalla A, Trudeau E, Roers A, Weaver CT, Lee JJ, Gilbert JA, Chang EB, and Khazaie K. Adenomatous polyps are driven by microbe-instigated focal inflammation and are controlled by IL-10-producing T Cells. Cancer research. 2013; 73: 5905-5913.
16. Sovran B, Loonen LM, Lu P, Hugenholtz F, Belzer C, Stolte EH, Boekschoten MV, van Baarlen P, Kleerebezem M, de Vos P, Dekker J, Renes IB, and Wells JM. IL-22-STAT3 pathway plays a key role in the maintenance of ileal homeostasis in mice lacking secreted mucus barrier. Inflamm Bowel Dis. 2015; 21: 531-542.
17. Zhu Q, Jin Z, Wu W, Gao R, Guo B, Gao Z, Yang Y, and Qin H. Analysis of the intestinal lumen microbiota in an animal model of colorectal cancer. PloS one. 2014; 9: e90849.
18. Liang X, Li H, Tian G, and Li S. Dynamic microbe and molecule networks in a mouse model of colitis-associated colorectal cancer. Sci Rep. 2014; 4: 4985-4996.
19. Katoh H, Wang D, Daikoku T, Sun H, Dey SK, Dubois RN. CXCR2-expressing myeloid-derived suppressor cells are essential to promote colitis-associated tumorigenesis. Cancer Cell. 2013; 24: 631-644.
20. Cougnoux A, Dalmasso G, Martinez R, Buc E, Delmas J, Gibold L, Sauvanet P, Darcha C, Déchelotte P, Bonnet M, Pezet D, Wodrich H, Darfeuille-Michaud A, et al. Bacterial genotoxin colibactin promotes colon tumour growth by inducing a senescence-associated secretory phenotype. Gut. 2014; 63: 1932-1942.
21. Yadav VR, Prasad S, Sung B, and Aggarwal BB. The role of chalcones in suppression of NF-êB-mediated inflammation and cancer. Int Immunopharmacol. 2011; 11: 295-309.
22. Yamamoto S, Aizu E, Jiang H, Nakadate T, Kiyoto I, Wang JC, and Kato R. The potent anti-tumor-promoting agent Isoliquiritigenin. Carcinogenesis. 1991; 12: 317-323.
23. Traboulsi H, Cloutier A, Boyapelly K, Bonin MA, Marsault É, Cantin AM, and Richter MV. The flavonoid Isoliquiritigenin reduces lung inflammation and mouse morbidity during influenza virus Infection. Antimicrob Agents Chemother. 2015; 59: 6317-6327.
24. Zhao S, Chang H, Ma P, Gao G, Jin C, Zhao X, Zhou W, and Jin B. Inhibitory effect of DNA topoisomerase inhibitor Isoliquiritigenin on the growth of glioma cells. Int J Clin Exp Pathol. 2015; 8:12577-12582.
25. Zhao H, Zhang X, Chen X, Li Y, Ke Z, Tang T, Chai H, Guo AM, Chen H, Yang J. Isoliquiritigenin, a flavonoid from licorice, blocks M2 macrophage polarization in colitis-associated tumorigenesis through downregulating PGE2 and IL-6. Toxicol Appl Pharmacol. 2014; 279: 311-321.
26. Dharmani P, Leung P, and Chadee K. Tumor necrosis factor-alpha and Muc2 mucin play major roles in disease onset and progression in dextran sodium sulphate-induced colitis. PloS one. 2011; 6: e25058.
27. Apidianakis Y, Pitsouli C, Perrimon N, Rahme L. Synergy between bacterial infection and genetic predisposition in intestinal dysplasia. Proc Natl Acad Sci U S A. 2009; 106: 20883-20888.
28. Wu S, Rhee KJ, Albesiano E, Rabizadeh S, Wu X, Yen HR, Huso DL, Brancati FL, Wick E, McAllister F, Housseau F, Pardoll DM, Sears CL. A human colonic commensal promotes colon tumorigenesis via activation of T helper type 17 T cell responses. Nat Med. 2009; 15: 1016-1022.
29. Tanaka Y, Ito S, Isobe K. Vancomycin-sensitive bacteria trigger development of colitis-associated colon cancer by attracting neutrophils. Sci Rep. 2016; 6: 23920. doi: 10.1038.
30. Castiglioni V, Vailati Facchini R, Mattiello S, Luini M, Gualdi V, Scanziani E, and Recordati C. Enterohepatic Helicobacter spp. in colonic biopsies of dogs: molecular, histopathological and immunohistochemical investigations. Vet Microbiol. 2012; 159: 107-114.
31. Alkadhi S, Kunde D, Cheluvappa R, Randall-Demllo S, and Eri R. The murine appendiceal microbiome is altered in spontaneous colitis and its pathological progression. Gut Pathog. 2014; 6: 25-33.
32. Zackular JP, Rogers MA, Ruffin MTt, and Schloss PD. The human gut microbiome as a screening tool for colorectal cancer. Cancer Prev Res (Phila). 2014; 7: 1112-1121.
33. Zenewicz LA, Yin X, Wang G, Elinav E, Hao L, Zhao L, and Flavell RA. IL-22 deficiency alters colonic microbiota to be transmissible and colitogenic. J Immunol. 2013; 190: 5306-5312.
34. Collins JW, Chervaux C, Raymond B, Derrien M, Brazeilles R, Kosta A, Chambaud I, Crepin VF, and Frankel G. Fermented dairy products modulate Citrobacter rodentium-induced colonic hyperplasia. J Infect Dis. 2014; 210: 1029-1041.
35. Wang T, Cai G, Qiu Y, Fei N, Zhang M, Pang X, Jia W, Cai S, and Zhao L. Structural segregation of gut microbiota between colorectal cancer patients and healthy volunteers. ISME J. 2012; 6: 320-329.
36. Moschetta A, Chen W, Liu F, Ling Z, Tong X, and Xiang C. Human intestinal lumen and mucosa-associated microbiota in patients with colorectal cancer. PloS one. 2012; 7: e39743.
37. Zackular JP, Baxter NT, Iverson KD, Sadler WD, Petrosino JF, Chen GY, and Schloss PD. The gut microbiome modulates colon tumorigenesis. MBio. 2013; 4: e00692-13.
38. Verbeke KA, Boobis AR, Chiodini A, Edwards CA, Franck A, Kleerebezem M, Nauta A, Raes J, van Tol EA, and Tuohy KM. Towards microbial fermentation metabolites as markers for health benefits of prebiotics. Nutr Res Rev. 2015; 28: 42-66.
39. Weir TL, Manter DK, Sheflin AM, Barnett BA, Heuberger AL, and Ryan EP. Stool microbiome and metabolome differences between colorectal cancer patients and healthy adults. PloS one. 2013; 8: e70803.
40. Miao H, Wu N, Luan C, Yang X, Zhang R, Lv N, and Zhu B. Quantitation of intestinal Fusobacterium and butyrate- producing bacteria in patients with colorectal adenomas and colorectal cancer. Wei Sheng Wu Xue Bao. 2014; 54: 1228-1234.
41. Chen WX, Ren LH, and Shi RH. Enteric microbiota leads to new therapeutic strategies for ulcerative colitis. World J Gastroenterol. 2014; 20: 15657-15663.
42. Rose DJ, DeMeo MT, Keshavarzian A, and Hamaker BR. Influence of dietary fiber on inflammatory bowel disease and colon cancer: importance of fermentation pattern. Nutr Rev. 2007; 65: 51–62.
43. Eeckhaut V, Ducatelle R, Sas B, Vermeire S, and Van Immerseel F. Progress towards butyrate-producing pharmabiotics: Butyricicoccus pullicaecorum capsule and efficacy in TNBS models in comparison with therapeutics. Gut. 2014; 63: 367.
44. Steppe M, Van Nieuwerburgh F, Vercauteren G, Boyen F, Eeckhaut V, Deforce D, Haesebrouck F, Ducatelle R, and Van Immerseel F. Safety assessment of the butyrate-producing Butyricicoccus pullicaecorum strain 25-3(T), a potential probiotic for patients with inflammatory bowel disease, based on oral toxicity tests and whole genome sequencing. Food Chem Toxicol. 2014; 72:129-37.
45. Geirnaert A, Steyaert A, Eeckhaut V, Debruyne B, Arends JB, Van Immerseel F, Boon N, and Van de Wiele T. Butyricicoccus pullicaecorum, a butyrate producer with probiotic potential, is intrinsically tolerant to stomach and small intestine conditions. Anaerobe. 2014; 30: 70-74.
46. Ericsson AC, Akter S, Hanson MM, Busi SB, Parker TW, Schehr RJ, Hankins MA, Ahner CE, Davis JW, Franklin CL, Amos-Landgraf JM, and Bryda EC. Differential susceptibility to colorectal cancer due to naturally occurring gut microbiota. Oncotarget. 2015; 6: 33689-33704. doi: 10.18632/oncotarget.5604.
47. Baxter NT, Zackular JP, Chen GY, Schloss PD. Structure of the gut microbiome following colonization with human feces determines colonic tumor burden. Microbiome. 2014; 2: 20.
48. Gómez-Gallego C, Pohl S, Salminen S, De Vos WM, Kneifel W. Akkermansia muciniphila: a novel functional microbe with probiotic properties. Benef Microbes. 2016. 7: 571-584.
49. Balamurugan R, Rajendiran E, George S, Samuel GV, and Ramakrishna BS. Real-time polymerase chain reaction quantification of specific butyrate-producing bacteria, Desulfovibrio and Enterococcus faecalis in the feces of patients with colorectal cancer. J Gastroenterol Hepatol. 2008; 23: 1298-1303.
50. Khan S. Potential role of Escherichia coli DNA mismatch repair proteins in colon cancer. Crit Rev Oncol Hematol. 2015; 96: 475-482.
51. Feldman M, Santos J, Grenier D. Comparative evaluation of two structurally related flavonoids, isoliquiritigenin and liquiritigenin, for their oral infection therapeutic potential. J Nat Prod. 2011; 74: 1862-1867.
52. Gaur R, Gupta VK, Singh P, Pal A, Darokar MP, Bhakuni RS. Drug Resistance Reversal Potential of Isoliquiritigenin and Liquiritigenin Isolated from Glycyrrhiza glabra Against Methicillin-Resistant Staphylococcus aureus (MRSA). Phytother Res. 2016; doi: 10.1002.
53. Wu Y, Chen X, Ge X, Xia H, Wang Y, Su S, Li W, Yang T, Wei M, Zhang H, Gou L, Li J, Jiang X, Yang J. Isoliquiritigenin prevents the progression of psoriasis-like symptoms by inhibiting NF-êB and proinflammatory cytokines. J Mol Med (Berl). 2016; 94: 195-206.
54. Haller D, Holt L, Parlesak A, Zanga J, Bäuerlein A, Sartor RB, Jobin C. Differential effect of immune cells on non-pathogenic Gram-negative bacteria-induced nuclear factor-kappaB activation and pro-inflammatory gene expression in intestinal epithelial cells. Immunology. 2004; 112: 310-320.
55. Kelly D, Campbell JI, King TP, Grant G, Jansson EA, Coutts AG, Pettersson S, Conway S. Commensal anaerobic gut bacteria attenuate inflammation by regulating nuclear-cytoplasmic shuttling of PPAR-gamma and RelA. Nat Immunol. 2004; 5: 104-112.
56. Kaci G, Goudercourt D, Dennin V, Pot B, Doré J, Ehrlich SD, Renault P, Blottière HM, Daniel C, Delorme C. Anti-inflammatory properties of Streptococcus salivarius, a commensal bacterium of the oral cavity and digestive tract. Appl Environ Microbiol. 2014; 80: 928-934.
57. Couvigny B, de Wouters T, Kaci G, Jacouton E, Delorme C, Doré J, Renault P, Blottière HM, Guédon E, Lapaque N. Commensal Streptococcus salivarius Modulates PPARã Transcriptional Activity in Human Intestinal Epithelial Cells. PLoS One. 2015; 10: e0125371.
58. Desai C, and Madamwar D. Extraction of inhibitor-free metagenomic DNA from polluted sediments, compatible with molecular diversity analysis using adsorption and ion-exchange treatments. Bioresour Technol. 2007; 98: 761-768.
59. Dennis KL, Wang Y, Blatner NR, Wang S, Saadalla A, Trudeau E, Roers A, Weaver CT, Lee JJ, Gilbert JA, Chang EB, and Khazaie K. Adenomatous polyps are driven by microbe-instigated focal inflammation and are controlled by IL-10-producing T cells. Cancer research. 2013; 73: 5905-5913.
60. Klimesova K, Kverka M, Zakostelska Z, Hudcovic T, Hrncir T, Stepankova R, Rossmann P, Ridl J, Kostovcik M, Mrazek J, Kopecny J, Kobayashi KS, and Tlaskalova-Hogenova H. Altered gut microbiota promotes colitis-associated cancer in IL-1 receptor-associated kinase M-deficient mice. Inflamm Bowel Dis. 2013; 19: 1266-1277.
61. Bi X, Tong C, Dockendorff A, Bancroft L, Gallagher L, Guzman G, Iozzo RV, Augenlicht LH, and Yang W. Genetic deficiency of decorin causes intestinal tumor formation through disruption of intestinal cell maturation. Carcinogenesis. 2008; 29: 1435-1440.
62. Tong C, Yin Z, Song Z, Dockendorff A, Huang C, Mariadason J, Flavell RA, Davis RJ, Augenlicht LH, and Yang W. c-Jun NH2-terminal kinase 1 plays a critical role in intestinal homeostasis and tumor suppression. Am J Pathol. 2007; 171: 297-303.
63. Mariadason JM, Nicholas C, L’Italien KE, Zhuang M, Smartt HJ, Heerdt BG, Yang W, Corner GA, Wilson AJ, Klampfer L, Arango D, and Augenlicht LH. Gene expression profiling of intestinal epithelial cell maturation along the crypt-villus axis. Gastroenterology. 2005; 128: 1081-1088.
64. Bhatt RS, Kothari ST, Gohil DJ, D’Souza M, and Chowdhary AS. Novel evidence of microglial immune response in impairment of Dengue infection of CNS. Immunobiology. 2015; 220: 1170-1176.