
Introduction
Esophageal cancer is the eight most common cancer worldwide, with 450.000 new cases and 400.000 estimated deaths per year. [1, 2] The two main types of esophageal cancer, squamous cell carcinoma (SCC) and adenocarcinoma (AC), differ in pathogenesis, epidemiology, tumor biology, prognosis and treatment strategies. [3, 4]
Multimodality treatment, combining esophagectomy with perioperative chemotherapy or neoadjuvant chemoradiotherapy, has been shown to improve patients’ survival and is therefore the standard treatment for curable esophageal cancer. [5-7] However, due to the aggressive character of the tumor and the lack of effective individualized treatment, the survival remains poor with 5-year survival rates of merely 36-47%. [5-8] Moreover, large individual differences in survival, treatment response and metastasis emphasize the need for more personalized therapy. Existing histopathological terms, such as the pathologic TNM classification, are insufficient to accurately predict these individual differences in outcome and to inform personalized treatment. [9-11]
Evidence for the potential prognostic role of gene expression profiles is accumulating. Gene signatures may find clinical application in predicting survival, response to neoadjuvant treatment and metastatic potential. This would enable individualized targeted therapy in order to avoid unnecessary treatment and improve quality of life and longevity.
Prognostic pretreatment gene expression profiles have already been identified through genome-wide microarray analysis for rectal adenocarcinoma [12, 13] and breast cancer [14-16]. With regard to esophageal cancer, multiple studies have suggested a clear association between gene expression and clinical outcome. This systematic review aims to provide an overview of the results, in order to outline the current understanding of the predictive potential of gene expression for survival, response to chemo(radio)therapy, and lymph node metastasis.
Results
Study selection and study characteristics
A flowchart of the systematic literature search and study selection is shown in Figure 1. The systematic search yielded 5.082 unique studies, of which 54 were retrieved for full-text screening. Of these, 23 studies were included according to the criteria (Figure 1) and underwent critical appraisal, using the QUIPS tool (Table 1). One study was excluded as a low quality study [18], while the remaining 12 studies of moderate quality [19-30] and 10 studies of high quality [31-40] were deemed eligible for this review. The 22 eligible studies together included 827 patients, were conducted in 8 countries, and were published between 2003 and 2014. All studies conducted microarray analysis of gene expression profiles, with the exception of 1 study [40] employing RNA next-generation sequencing to analyze transcriptional profiles. When separated on the basis of outcome, 9 studies investigated gene expression profiles in relation to survival [19, 25, 27, 29, 30, 36-38, 40], 7 studies in relation to response to chemo(radio)therapy [24, 27, 28, 32, 34, 35, 39] and 9 studies in relation to lymph node metastasis [20-23, 25, 26, 31, 33, 36].
Table 1: Critical Appraisal of reported bias in 6 domains and overall quality according to the Quality in Prognostic Studies Tool
Study |
Study participation |
Study attrition |
Prognostic factor measurement |
Outcome measurement |
Study confounding |
Statistical analysis and reporting |
Quality |
Ishibashi [19] |
+ |
+ |
+/- |
+ |
+/- |
+/- |
Moderate |
Kan [20] |
+/- |
+ |
+/- |
+ |
+/- |
+/- |
Moderate |
Tamoto [31] |
+/- |
+ |
+ |
+ |
+/- |
+ |
High |
Sato [21] |
+/- |
+ |
+ |
+ |
+/- |
+/- |
Moderate |
Luthra [32] |
+/- |
+ |
+ |
+/- |
+ |
+ |
High |
Yamabuki [22] |
+/- |
+ |
+ |
- |
+/- |
+ |
Moderate |
Li [18] |
- |
+ |
+/- |
+/- |
- |
+/- |
Low |
Uchikado [23] |
+/- |
+ |
+ |
+ |
- |
+/- |
Moderate |
Duong [24] |
+/- |
+ |
+/- |
+/- |
+ |
+ |
Moderate |
Hammoud [25] |
+/- |
+/- |
+/- |
+ |
+/- |
+/- |
Moderate |
Lagarde [33] |
+ |
+ |
+ |
+ |
+ |
+ |
High |
Sano [26] |
- |
+ |
+/- |
+ |
- |
+/- |
Moderate |
Maher [34] |
+ |
+ |
+ |
+ |
+ |
+ |
High |
Schauer [35] |
+ |
+ |
+ |
+ |
+/- |
+/- |
High |
Peters[36] |
+ |
+ |
+ |
+ |
+ |
+ |
High |
Rao [27] |
+/- |
+ |
+ |
+/- |
- |
+/- |
Moderate |
Motoori [28] |
+/- |
+ |
+ |
+/- |
+/- |
+/- |
Moderate |
Kim [29] |
+/- |
+ |
+ |
+/- |
+/- |
+/- |
Moderate |
Goh [30] |
+/- |
+ |
+/- |
+/- |
+/- |
+/- |
Moderate |
Pennathur [37] |
+ |
+ |
+ |
+ |
+ |
+ |
High |
Lu [38] |
+/- |
+ |
+ |
+/- |
+ |
+ |
High |
Wen [39] |
+ |
+ |
+ |
+ |
+ |
+ |
High |
Lin [40] |
+ |
+ |
+ |
+/- |
+ |
+/- |
High |
+ low bias, +/- moderate bias, - high bias
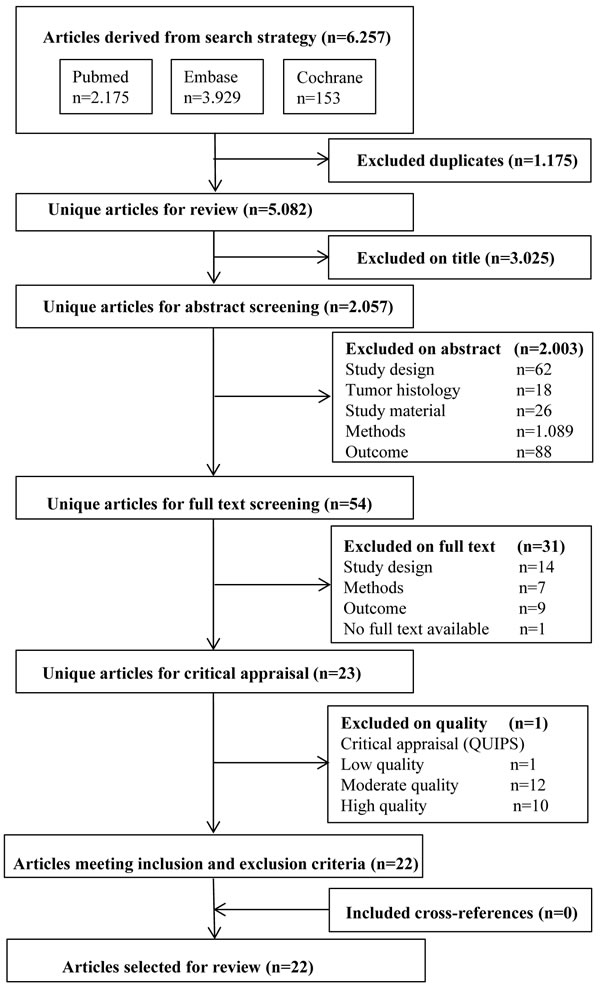
Figure 1: Flowchart search, selection of papers on prognostic gene expression profiling in esophageal cancer (2000-2015).
Gene expression and survival
The 9 studies [19, 25, 27, 29, 30, 36-38, 40] that studied gene expression in association with survival are summarized in Table 2. In 7 studies, patients underwent esophagectomy only and resection specimens were obtained as study material, either fresh frozen [19, 27, 30, 36-38, 40] or formalin-fixed paraffin-embedded (FFPE) [25]. In 2 studies, esophagectomy was preceded by chemotherapy [27] or chemoradiotherapy [29] and pretreatment biopsies were obtained as study material. Prognostic genes were identified through correlation to continuous survival [25, 36, 38], comparison between a poor and good survival group [27, 40] or used to form patient clusters [19, 29, 30, 37]. Genes with differential expression between tumor and normal tissue [30, 38] were not regarded as prognostic genes. After gene expression profiling, 6 studies [27, 29, 30, 36-38] proceeded with the identification of a prognostic gene signature, which was validated in an external cohort in 4 studies [29, 30, 36, 38].
Table 2: Articles identifying genes associated with survival in esophageal AC and SCC (2000-2015)
|
Study (year) |
Country |
n |
Histological tumor type |
Survival assessment |
Median follow-up/ overall survival |
Methods |
Prognostic genes (cut-off point) |
Gene signature |
Signature validation (n samples) |
Hammoud (2009) [25] |
USA |
89 |
AC |
Continuous |
FU 25 months (range 2-132) OS 2.18 years |
DASL 502 cancer genes |
9 genes (continuous) |
Not identified |
Not conducted |
Kim (2010) [29] |
USA |
64 |
AC |
3 clusters; Poor survival cluster; mean OS< 13 months |
Not reported |
48 K Oligo-nucleotide microarray |
452 (1.5-fold), 10 genes (4-fold) |
2 genes |
10 genes (52) |
Peters (2010) [36] |
UK |
75 |
AC |
Continuous
|
FU 20 months (range 0.5-137) FU survivors 89 months (range 66-137) |
44 K Oligo-nucleotide microarray |
119 genes (continuous), 10 genes (1.5-fold) |
4 genes |
4 genes (371) |
Goh (2011) [30] |
UK |
56 |
AC |
5 clusters; Poor survival cluster; median OS 1.37 years Remaining clusters; median OS 2.74 years |
FU survivors (min. 5years) |
44 K Oligo-nucleotide microarray |
Not identified |
4 genes |
4 genes (371) |
Rao (2011) [27] |
UK |
35 |
AC |
Poor survival group; OS <570 dys Good survival group; OS >570dys survival |
FU 938 days (min. 500) OS 570 days |
22 K cDNA microarray |
165 genes (1.4-fold) |
165 genes |
Not conducted |
Pennathur (2013) [37] |
USA |
64 |
AC |
2 clusters; Poor survival cluster; median OS 19 months (95%CI 10-25) Good survival cluster; Median OS not reached |
OS 27 months (95%CI lower limit 22) FU survivors 34 months (range 2-76) |
Affymetrix U133 microarray |
59 genes (2-fold) |
59 genes |
Not conducted |
Ishibashi (2003) [19] |
Japan |
12 |
SCC |
2 clusters; Recurrence cluster; median DFS 280 dys Non-recurrence cluster; median FU 483 dys |
OS (range 121-644 days) |
Affymetrix 12,6 K microarray |
multiple genes (continuous) |
Not reported |
Not conducted |
Lu (2014) [38] |
China |
10 |
SCC |
Continuous |
Not reported |
Affymetrix U133 microarray |
Not identified |
1 gene |
1 gene (198) |
Lin (2014) [40] |
China |
8 |
SCC |
Recurrence group; Recurrence and death <2yrs Non-recurrence group; DFS ≥5yrs |
Not reported |
Ion Total RNA-Seq Kit v2 |
533 genes (2-fold) |
Not identified |
Not conducted |
n = number, AC = adenocarcinoma, SCC = squamous cell carcinoma, FU = follow-up, OS = overall survival, DFS = disease-free survival
Adenocarcinoma
Of the 6 studies [25, 27, 29, 30, 36, 37] conducted on AC, 5 studies [27, 29, 30, 36, 37] reported gene signatures associated with survival. One study [36] reported and validated a prognostic 4-gene signature (and showed that underexpression of DCK, PAPSS2 and SIRT2 in combination with overexpression of TRIM44 decreased 5-year survival from 58% to 14%. A second study [29] discovered clusters of patients with differential gene expression profiles and further investigated genes with overexpression in the poor prognosis cluster. External validation of these genes showed a significant association between a 2-gene signature, with combined overexpression of SPARC and SPP1, and poor survival. A third study [30] also performed cluster analysis and found that another validated 4-gene signature (EGFR, MTMR9, NEIL2, and WT1) was able to stratify patients into 5 survival clusters. A similar study identified a 165-gene [37] signature to classify patients into a good survival cluster and poor survival cluster. The last study [27] took another approach to divide a cohort of patients into a good survival group and a poor survival group and compared gene expression between both groups to find a 59-gene signature predictive of survival.
Squamous cell carcinoma
As for SCC, only 1 [38] of the 3 studies [19, 38, 40] identified a prognostic gene signature. This study [38] found an association between overexpression of the randomly selected gene CTTN and shorter disease-free survival in an external validation cohort.
Gene expression and response to chemo(radio)therapy
The 7 studies [24, 27, 28, 32, 34, 35, 39] that analyzed gene expression in association with response to chemo(radio)therapy are summarized in Table 3. Patients received neoadjuvant chemotherapy in 3 studies [27, 28, 35] and neoadjuvant chemoradiotherapy in 4 studies [24, 32, 34, 39], following varying regimens as specified in Table 2. All studies obtained fresh frozen pretreatment endoscopic biopsies for microarray analysis. Response to chemo(radio)therapy was defined differently in each study and evaluated on the basis of resection specimens in 4 studies [32, 34, 35, 39] and on the basis of (a combination of) medical imaging techniques in 3 studies [24, 27, 28]. All studies proposed a gene signature prognostic for response to chemo(radio)therapy, which was externally validated in 3 studies [28, 34, 39].
Table 3: Articles identifying genes associated with response to chemo(radio)therapy in esophageal AC and SCC (2000-2015)
|
Study (year) |
Country |
n |
Histological tumor type |
Treatment |
Response Evaluation |
Response definition (n responders) |
Method |
Prognostic genes (cut-off point) |
Gene signature |
Signature validation (n samples) |
Schauer (2009) [35] |
Germany |
47 |
AC |
CT (Cisplatin/ 5-FU/Leucoverin) + Surgery |
Resection specimen |
<50% viable tumor cells (19) |
Affymetrix U133 microarray |
86 genes (2-fold) |
1 gene |
Not conducted |
Rao (2010) [27] |
UK |
35 |
AC |
CT (Epirubicin/ Cisplatin/Capecitabine) + Surgery (26) |
CT-scan, EUS |
RECIST criteria (18) |
22 K cDNA microarray |
113 genes (1.4-fold) (EUS) |
113 genes |
Not conducted |
Motoori (2010) [28] |
Japan |
25 |
SCC |
CT (Cisplatin/ 5-FU/ Doxorubicin) + Surgery (17) |
CT-scan |
<50% viable tumor cells (11) |
30K oligo-nucleotide microarray |
19.166 genes (continuous) |
199 genes |
199 genes (10) |
Wen (2014) [39] |
China |
28 |
SCC |
CRT (Cisplatin/ Vinorelbine/40Gy) + Surgery |
Resection Specimen |
No residual tumor cells (11) |
Affymetrix U133 microarray |
178 genes (continuous), 10 genes (2-fold) |
3 genes |
3 genes (32) |
Luthra (2005) [32] |
USA |
19 |
AC (16) SCC (2) ASCC (1) |
CRT (Docetaxel/ 5-FU/ Irinotecan/ 50.4Gy) + Surgery |
Resection Specimen |
No residual tumor cells (10) |
Affymetrix 22 K microarray |
80 genes (2-fold) |
3 genes |
Not conducted |
Duong (2007) [24] |
Australia |
46 |
AC (25) SCC (21) |
CRT (Cisplatin/ 5-FU/ 35-50Gy) + Surgery |
CT scan, endoscopy with biopsy, FDG-PET |
Metabolic response and no residual tumor (17) |
10,5 K cDNA microarray |
Not reported |
32 genes (SCC) |
Not conducted |
Maher (2009) [34] |
Ireland |
13 |
AC (10) SCC (3) |
CRT (Cisplatin/ 5-FU/40.5-44Gy) + Surgery |
Resection Specimen |
Fibrosis with no (TRG1) or rare (TRG2) residual tumor cells (4) |
32 K oligo-nucleotide microarray |
103 genes (continuous), 67 genes (2-fold) |
12 genes |
12 genes (27) |
n= number, AC= adenocarcinoma, SCC= squamous cell carcinoma, CT = chemotherapy, CRT = chemoradiotherapy, 5-FU = 5-Fluorouracil, CT-scan = Computerized Tomography-scan, EUS= endoscopic ultrasound, FDG-PET= Fluorodeoxyglucose Positron Emission Tomography, RECIST = Response Evaluation Criteria in Solid Tumors , TRG = Tumor Regression Grade.
Adenocarcinoma
Two studies [27, 35] found prognostic genes and a gene signature for AC only. One study [35] compared gene expression between responders and non-responders to chemotherapy. The results demonstrated a significant correlation between the overexpression of Ephrin B3 and response. Another study [27] identified, on the basis of endoscopic ultrasound (EUS) only, a 113-gene signature correlated with chemotherapy response.
Squamous cell carcinoma
Two studies [28, 39] were conducted on SCC only. One study [28] documented a 199-gene signature and showed in external validation that 1 gene (PERP) was underexpressed and 4 genes (DAD1, PRDX6, SELPINB6 and SRF) were overexpressed in non-responders compared to responders to chemotherapy. Similarly, another study [39] identified a 3-gene signature and found that a combination of underexpression of ClOrf226 and LIMCHI1, and overexpression of MMP1 was predicitive for responders.
Adenocarcinoma and squamous cell carcinoma
Three studies [24, 32, 34] obtained biopsies of both AC and SCC. The first study [34] found differentially expressed genes, of which 12 genes were selected for external validation. A model of 5 genes reported that underexpression of 4 genes (EPB41L3, NMES1, RNPC1, STAT5B) and overexpression of 1 gene (RTKN), was able to identify responders from non-responders to chemoradiotherapy. The second study [32] showed that overexpression of 3 genes (PERP, S100A2 and SPRR3) was able to characterize complete responders to chemoradiotherapy. The third study [24] investigated differential expression in both AC and SCC and identified a 32-gene signature that was predictive for response to chemoradiotherapy in SCC only.
Gene expression and lymph node metastasis
Table 4 summarizes the 9 articles [20-23, 25, 26, 31, 33, 36] that investigated gene expression profiles in relation to lymph node metastasis. All patients underwent esophagectomy only and fresh frozen resection specimens were obtained as study material. In 6 studies [22, 23, 25, 26, 31, 36] the (International Union Against Cancer (UICC)) TNM classification was used by pathologists to assess lymph node metastasis and in 3 studies [20, 21,33] no form of classification was stated. All 9 studies identified prognostic genes with differential expression between patients groups with node-negative (N0) versus node-positive (N+) tumors. Of these, 4 studies [20, 22, 26, 31] reported a gene signature, which was validated in an external cohort in 3 studies [20, 26, 31].
Adenocarcinoma
In AC, 3 studies [25, 33, 36] identified differentially expressed genes but none reported a gene signature to predict N+ tumors.
Squamous cell carcinoma
In SCC, 6 studies [20-23, 26, 31] documented genes with differential expression and 4 studies [20, 22, 26, 31] developed a gene signature predictive for lymph node involvement. Three studies [20, 22, 26, 31] compared gene expression between N0 tumors and N+ tumors and identified a gene signature consisting of 20 [22], 44 [31] and 58 [20] genes, of which the latter 2 were externally validated. Another study [26] compared gene expression between node-negative patients and patients with more than 5 metastatic lymph nodes. This study further reported and validated a gene signature of 6 genes. Overexpression of CALB1, CEA/CEACAM5, CLDN10, KRT7/CK7, MUC1, and TFF3 was associated with more than 5 metastatic lymph nodes.
Overlap in gene expression
Supplementary Table S3 combines the available results of all reviewed studies into a list of genes for each of the 3 outcomes per histological tumor type. In association with survival, the 9 studies identified a total of 1.337 genes (excluding 1 study [19] that did not specify the number of multiple genes identified with differential expression), of which 277 genes (21%) (range 1-113 per study) were reported. Only for AC, overlap between the studies was found with respect to 9 genes (ALDH1A3, BIN1, CSPG2, DOK1, IFIT1, IFIT3, PHB, SPP1) which were described by 2 of the 5 studies. For response to chemo(radio)therapy, the 7 studies identified a total of 19.726 genes (excluding 1 study [28] that identified 19.166 genes with differential expression), of which 158 genes (1%) (range 1-49 per study) were reported. No overlap in genes was found between the studies. The 9 studies that studied gene expression in relation with lymph node metastasis identified a total of 1.001 genes and reported a total of 677 genes (68%) (range 5-252 per study). Of these, 3 genes (ATR, MAL, PCP4) were described in 2 studies investigating SCC.
Table 4: Articles identifying genes associated with lymph node metastasis in esophageal AC and SCC (2000-2015)
|
Study (year) |
Country |
n |
Histological tumor type |
Classification for lymph node assessment |
Compared N stage (n samples) |
Method |
Prognostic genes (cut-off point) |
Gene signature |
Signature validation (n samples) |
Lagarde (2008) [33] |
The Netherlands |
61 |
AC |
Not reported |
N0 (17) N+ (44) |
44 K oligonucleotide microarray |
5 genes (continuous) |
Not reported |
Not conducted |
Hammoud (2008) [25] |
USA |
89 |
AC |
TNM classification |
N0 (23) N+ (66) |
DASL 502 cancer genes |
17 genes (continuous) |
Not identified |
Not conducted |
Peters (2010) [36] |
UK |
75 |
AC |
TNM classification |
N0 (14) N+ (48) |
44 K Oligonucleotide microarray |
270 genes (1.5-fold) |
Not identified |
Not conducted |
Tamoto (2004) [31] |
Japan |
36 |
SCC |
UICC TNM classification |
N0 (16) N+ (20) |
1,3 K cDNA microarray |
87 genes (1.2-fold) |
44 genes |
44 genes (18) |
Kan (2004) [20] |
Japan |
15 |
SCC |
Not reported |
N0 (6) N+ (9) |
8,1 K cDNA microarray |
120 genes (continuous) |
58 genes |
58 genes (13) |
Sato (2006) [21] |
Japan |
54 |
SCC |
Not reported |
T1N0 (9) T1N+ (10), T2-4N0 (7) T2-4N+ (28) |
Affymetrix 22 K microarray |
78 genes (continuous) |
Not identified |
Not conducted |
Yamabuki (2006) [22] |
Japan |
19 |
SCC |
UICC TNM classification |
N0 (6) N+ (13) |
32 K cDNA microarray |
34 genes (5-fold) |
20 genes |
Not conducted |
Uchikado (2006) [23] |
Japan |
16 |
SCC |
UICC TNM classification |
N0 (5) N+ (11) |
17 K oligonucleotide microarray |
181 genes (not reported) |
Not identified |
Not conducted |
Sano (2009) [26] |
Japan |
35 |
SCC |
UICC TNM classification |
N0 (11), >5 positive nodes (25) |
Affymetrix U95A microarray |
209 (continuous) |
6 genes |
6 genes (66) |
n = number, AC = adenocarcinoma, SCC = squamous cell carcinoma, UICC = International Union Against Cancer, N = number of lymph nodes, according to TNM-6 classification.
Discussion
This systematic review aimed to identify prognostic genetic profiles in esophageal carcinoma. The results demonstrate a large heterogeneity in gene expression profiles and gene signatures predicting survival, response to chemo(radio)therapy, and lymph node metastasis. None of the identified gene signatures is directly applicable in clinical practice at present. However, microarray analysis and genome sequencing might provide valuable information for predicting individual variations in clinical outcome and establishing personalized therapy for esophageal cancer patients in the near future.
A careful literature search and quality assessment were directed at including all studies of moderate and high quality relevant to prognostic gene expression. The 22 included studies were assessed on the same criteria and genes with prognostic relevance were retrieved from the article or through additional contact with study authors if possible. In support of a prognostic role, all studies, except 2 [30, 38], identified genes with differential expression with regard to the investigated outcome and 16 studies [20, 22, 24, 26-32, 34-39] identified and reported a gene signature. In consistence with the distinct epidemiology and tumor biology of AC and SCC [4, 11], most studies conducted in East Asia included exclusively SCC and most studies in western countries focused on AC only. Of the 3 studies [24, 32, 34] investigating both AC and SCC, 2 studies [32, 34] described a gene signature for both tumor types, while the third study [24] found a gene signature that was predictive for SCC only.
Despite the thorough review, studies to current date have been heterogeneous in both methods and results. Therefore, comparison of the different studies has been unable to establish a repeatedly identified gene signature with clinical relevance. Studies differed largely in the documented number of prognostic genes and genes were not reported nor provided after contacting authors in 8 articles [26-28, 32, 35, 37, 39, 40]. Although the 22 studies identified a large number of prognostic genes (Tables 2, 3 and 4), only 1.112 genes were reported and included in Supplementary Table S3. Comparison of data per outcome and histological subtype showed that only a 12 genes return in more than 1 study, suggesting a high false positive rate of identified genes. Only 9 genes (ALDH1A3, BIN1, CSPG2, DOK1, IFIT1, IFIT3, PHB, SPP1) were described in 2 studies on survival in AC and only 3 genes (ATR, MAL, PCP4) on lymph node metastasis in SCC. There was no overlap between studies investigating response to chemo(radio)therapy.
The heterogeneity in identified genes can be attributed to several factors. Firstly, the studies used limited sample sizes and thus individual genetic variability may have largely impacted the identified genes. The studies included 8 to 89 patients, with only 3 studies [25, 33, 36] investigating 75 or more patients. Moreover, only 10 [20, 26, 28-31, 34, 36, 38, 39] of the 16 reported gene signatures were validated in external cohorts. Validation in independent cohorts increases reliability of the gene signatures and is required to achieve clinical implementation. In addition, the included studies showed large methodological variation in treatment of patients, definition and evaluation of outcome, employed microarray analysis and chosen cut-off point for differential expression.
The studies investigating survival showed heterogeneity in whether gene expression was correlated to continuous survival [25, 36, 38], compared between differently defined poor and good survival groups [27, 40] or used to create patient clusters [19, 29, 30, 37]. More importantly, response to chemo(radio)therapy was assessed using computerized tomography (CT) scans, Fluorodeoxyglucose Positron Emission Tomography (FDG-PET), or endoscopic ultrasound (EUS) with or without biopsy in 3 studies [24, 27, 28]. Accuracy of these imaging techniques in evaluating response is suboptimal compared to histopathology, which is the gold standard [41-43]. Conclusions on response to chemo(radio)therapy were further complicated by the use of different chemotherapy regimens and varying definition of response. Response was defined as either 50% reduction of viable tumor cells [28, 35] or absence of residual tumor cells [24, 32, 34, 39]. These are 2 distinct predictive categories of partial response and complete response, respectively. [44, 45] Similarly, the studies investigating lymph node metastasis differed in the classification system used and the lymph node-stage compared.
Despite these limitations, the current findings show that gene signatures can be of great prognostic value for clinical outcomes and are therefore paramount in understanding pathogenesis and selecting optimal personalized therapy for the individual patient. A gene signature to predict survival may be able to explain why some patients with good tumor characteristics show shorter disease-free survival than expected, and vice versa, thus offering information that is not accurately provided by the pathologic TNM classification. [46, 47] Moreover, patients who are unlikely to benefit from chemo(radio)therapy could be selected to receive direct surgical resection, avoiding unnecessary toxicity [7, 48] and delay in surgical treatment with risk of disease progression. Conversely, a restrictive and non-surgical approach with less comorbidity might be considered for patients who are likely to be complete responders to chemo(radio)therapy. In addition, the identification of a gene signature to predict lymph node metastasis would be a powerful diagnostic tool. Lymph node-negative patients could receive limited-field radiotherapy with reduced treatment-related toxicities. [49] Furthermore, an invasive extended lymphadenectomy might be avoided in these patients, limiting the risk of postoperative morbidity. [50] Although the included studies did not investigate other prognostic variables as tumor differentiation, perineural and angioinvasive growth, gene signatures for these variables can be of great value in the future as well.
This systematic review shows potential for prognostic gene expression analysis and future research should aim at translation to clinical practice. An international consortium dedicated to large-scale data sharing and using a clear methodological ‘gold standard’ to perform analyses can resolve inconsistencies among the reported gene expression profiles. [51] In addition, future studies can yield more reliable results by conducting gene expression profiling on larger samples and by validating signatures in independent patient cohorts. This would allow for the development of a gene signature with direct clinical relevance, similar to the 70-gene signature ‘MammaPrint’ to predict survival of patients with breast cancer [14-16] and the 42-gene ‘ColoPrint’ to predict disease relapse in early stage colon cancer [12, 13]. In addition to microarrays analysis, 1 study [40] employed RNA next-generation sequencing. This exciting emerging technique can provide additional information on gene fusions and alternative splicing with high accuracy and sensitivity [52, 53]. Advances in microarray analysis and next-generation sequencing will form valuable tools to realize personalized medicine for patients with esophageal cancer in the near future.
materials and Methods
Search strategy
A systematic literature search was conducted of the Medline (via PubMed), Embase and Cochrane library databases, using the limits ‘human’, ‘English language’ and ‘publication date 2000-2015’. The medical subject headings (MeSH) and their synonyms concern ‘esophageal neoplasm’, in combination with ‘DNA/RNA sequence analysis’ or ‘gene expression’, in relation to ‘response to chemo(radio)therapy’, ‘metastasis’, ‘survival’, ‘prognosis’ or ‘recurrence’. The complete search strategy is provided in the supplementary Table S1. The search was last updated on June 30 2016.
Study selection
Studies identified by the search strategy were evaluated for eligibility by independent dual author review (EV and IF). Discrepancies between the two reviewers were resolved by consensus. After removal of duplicates, studies that seemed unrelated to the study aims were excluded in title screening. The remaining articles underwent subsequent abstract and full text screening, based on carefully constructed inclusion and exclusion criteria (Supplementary Table S2). These criteria aimed at inclusion of original studies, that conducted microarray analysis or genome sequencing on untreated cancer biopsies or resection specimens of AC or SCC, and associated the genetic profile to survival, response to chemo(radio)therapy and/or lymph node metastasis. A manual cross-reference search was performed in the reference lists of the eligible articles to assure that relevant related articles were included in this study.
Quality assessment
Studies eligible on the basis of the inclusion and exclusion criteria were subsequently evaluated in a critical appraisal, using the Quality in Prognostic Studies (QUIPS) tool. [17] The quality of studies was assessed on the basis of bias in study participation, study attrition, prognostic factor measurement, outcome measurement, study confounding and statistical analysis plus reporting. Studies were assigned low, moderate or high risk of bias in each of these 6 domains. In case of discrepancies in quality assessment between the two authors (EV and IF), a consensus was reached through discussion. The overall quality of each study was scored using a three-point scale (low, moderate and high quality). Low quality studies, defined as high bias in at least 2 of the 6 domains, were excluded from this study. Studies were defined to be of high quality if they scored low bias on at least 4 domains in the absence of any high bias score. Both high quality studies and the remaining studies of moderate quality were included in this study.
Data extraction
Data were collected independently by two authors (EV and IF). The following information was obtained from the included studies: first author’s name, publication year, country of origin, sample size, histological tumor type, treatment, study material, definition of outcome, sequencing method or microarray analysis, cutoff value for expression, method of analysis, identified prognostic genes and/or gene signature, and validation. Gene signatures consisting of less than 10 genes were mentioned in the text. If data on any of the above items were not reported in the study, items were indicated as “not reported”. Authors were contacted for important information that was missing or unclear.
Data presentation
The above-mentioned data were presented per study in tables, making a distinction between survival, response to chemo(radio)therapy and metastasis and separating AC and SCC. Studies were compared on the basis of treatment and study material as well as methods used to identify genes, such as chosen microarray analysis, and validation. When available, the identified prognostic genes and gene signatures were described. A list of prognostic genes was constructed, combining the results of all studies per outcome and histological tumor type. Genes reported in more than 1 study were highlighted. When studies investigated differential gene expression on multiple cut-off points, genes identified by the lowest cut-off point were included in the list of genes.
conflicts of interest
E. Visser, I.A. Franken, L.A.A. Brosens, J.P. Ruurda, and R. van Hillegersberg have no conflicts of interest or financial ties to disclose.
References
1. Ferlay J, Soerjomataram I, Dikshit R, Eser S, Mathers C, Rebelo M, Parkin DM, Forman D, Bray F. Cancer incidence and mortality worldwide: Sources, methods and major patterns in GLOBOCAN 2012. Int J Cancer. 2015;136(5):E359-86. doi: 10.1002/ijc.29210.
2. Siegel RL, Miller KD, Jemal A. Cancer statistics, 2015. CA Cancer J Clin. 2015;65(1):5-29. doi: 10.3322/caac.21254.
3. Domper Arnal MJ, Ferrandez Arenas A, Lanas Arbeloa A. Esophageal cancer: Risk factors, screening and endoscopic treatment in western and eastern countries. World J Gastroenterol. 2015;21(26):7933-7943. doi: 10.3748/wjg.v21.i26.7933.
4. Greenawalt DM, Duong C, Smyth GK, Ciavarella ML, Thompson NJ, Tiang T, Murray WK, Thomas RJ, Phillips WA. Gene expression profiling of esophageal cancer: Comparative analysis of barrett’s esophagus, adenocarcinoma, and squamous cell carcinoma. Int J Cancer. 2007;120(9):1914-1921. doi: 10.1002/ijc.22501.
5. Medical Research Council Oesophageal Cancer Working Group. Surgical resection with or without preoperative chemotherapy in oesophageal cancer: A randomised controlled trial. Lancet. 2002;359(9319):1727-1733. doi: S0140-6736(02)08651-8.
6. Shapiro J, van Lanschot JJ, Hulshof MC, van Hagen P, van Berge Henegouwen MI, Wijnhoven BP, van Laarhoven HW, Nieuwenhuizen GA, Hospers GA, Bonenkamp JJ, Cuesta MA, Blaisse RJ, Busch OR et al. Neoadjuvant chemoradiotherapy plus surgery versus surgery alone for oesophageal or junctional cancer (CROSS): Long-term results of a randomised controlled trial. Lancet Oncol. 2015;16(9):1090-1098. doi: 10.1016/S1470-2045(15)00040-6.
7. van Hagen P, Hulshof MC, van Lanschot JJ, Steyerberg EW, van Berge Henegouwen MI, Wijnhoven BP, Richel DJ, Nieuwenhuizen GA, Hospers GA, Bonenkamp JJ, Cuestas MA, Blaisse RJ, Busch OR et al. Preoperative chemoradiotherapy for esophageal or junctional cancer. N Engl J Med. 2012;366(22):2074-2084. doi: 10.1056/NEJMoa1112088.
8. Cunningham D, Allum WH, Stenning SP, Thompson JN, van de Velde CJ, Nicolson M, Scarffe JH, Lofts FJ, Falk SJ, Iveson TJ, Smith DB, Langley RE, Verma M et al. Perioperative chemotherapy versus surgery alone for resectable gastroesophageal cancer. N Engl J Med. 2006;355(1):11-20. doi: 355/1/11.
9. Diederich S. Staging of oesophageal cancer. Cancer Imaging. 2007;7 Spec No A:S63-6. doi: 10.1102/1470-7330.2007.9003.
10. Edge SB, Compton CC. The american joint committee on cancer: The 7th edition of the AJCC cancer staging manual and the future of TNM. Ann Surg Oncol. 2010;17(6):1471-1474. doi: 10.1245/s10434-010-0985-4.
11. Rustgi AK, El-Serag HB. Esophageal carcinoma. N Engl J Med. 2014;371(26):2499-2509. doi: 10.1056/NEJMra1314530.
12. Ghadimi BM, Grade M, Difilippantonio MJ, Varma S, Simon R, Montagna C, Füzesi L, Langer C, Becker H, Liersch T, Ried T. Effectiveness of gene expression profiling for response prediction of rectal adenocarcinomas to preoperative chemoradiotherapy. J Clin Oncol. 2005;23(9):1826-1838. doi: 23/9/1826.
13. Salazar R, Roepman P, Capella G, Moreno V, Simon I, Dreezen C, Lopez-Doriga A, Santos C, Marijnen C, Westerga J, Bruin S, Kerr D, Kuppen P et al. Gene expression signature to improve prognosis prediction of stage II and III colorectal cancer. J Clin Oncol. 2011;29(1):17-24. doi: 10.1200/JCO.2010.30.1077.
14. Chang JC, Wooten EC, Tsimelzon A, Hilsenbeck SG, Gutierrez MC, Elledge R, Mohsin S, Osborne CK, Chamness GC, Allred DC,O’Connell P. Gene expression profiling for the prediction of therapeutic response to docetaxel in patients with breast cancer. Lancet. 2003;362(9381):362-369. doi: S0140-6736(03)14023-8.
15. van de Vijver MJ, He YD, van’t Veer LJ, Dai H, Hart AA, Voskuil DW, Schreiber GJ, Peterse JL, Roberts C, Marton MJ, Parrish M, Atsma D, Witteveen A et al. A gene-expression signature as a predictor of survival in breast cancer. N Engl J Med. 2002;347(25):1999-2009. doi: 10.1056/NEJMoa021967.
16. van ‘t Veer LJ, Dai H, van de Vijver MJ, He YD, Hart AA, Mao M, Peterse HL, van der Kooy K, Marton MJ, Witteveen AT, Schreiber GJ, Kerkhoven RM, Roberts C et al. Gene expression profiling predicts clinical outcome of breast cancer. Nature. 2002;415(6871):530-536. doi: 10.1038/415530a.
17. Hayden JA, van der Windt DA, Cartwright JL, Cote P, Bombardier C. Assessing bias in studies of prognostic factors. Ann Intern Med. 2013;158(4):280-286. doi: 10.7326/0003-4819-158-4-201302190-00009.
18. Li P, Ling Z, Yang H, Huang Y, Zhao M, Zheng Z, Dong Z. Expression profile of metastasis-associated genes in esophageal squamous cell carcinoma. J Huazhong Univ Sci Technolog Med Sci. 2006;26(2):167-171.
19. Ishibashi Y, Hanyu N, Nakada K, Suzuki Y, Yamato T, Yanaga K, Ohkawa K, Hashimoto N, Nakajima T, Saito H, Matsushima M, Urashima M. Profiling gene expression ratios of paired cancerous and normal tissue predicts relapse of esophageal squamous cell carcinoma. Cancer Res. 2003;63(16):5159-5164.
20. Kan T, Shimada Y, Sato F, Ito T, Kondo K, Watanabe G, Maeda M, Yamasaki S, Meltzer SJ, Imamura M. Prediction of lymph node metastasis with use of artificial neural networks based on gene expression profiles in esophageal squamous cell carcinoma. Ann Surg Oncol. 2004;11(12):1070-1078. doi: ASO.2004.03.007.
21. Sato T, Iizuka N, Hamamoto Y, Yoshino S, Abe T, Takeda S, Uchimura S, Miyamoto T, Sei F, Hamada K, Yamada-Okabe H, Oka M. Esophageal squamous cell carcinomas with distinct invasive depth show different gene expression profiles associated with lymph node metastasis. Int J Oncol. 2006;28(5):1043-1055.
22. Yamabuki T, Daigo Y, Kato T, Hayama S, Tsunoda T, Miyamoto M, Ito T, Fujita M, Hosokawa M, Kondo S, Nakamura Y. Genome-wide gene expression profile analysis of esophageal squamous cell carcinomas. Int J Oncol. 2006;28(6):1375-1384.
23. Uchikado Y, Inoue H, Haraguchi N, Mimori K, Natsugoe S, Okumura H, Aikou T, Mori M. Gene expression profiling of lymph node metastasis by oligomicroarray analysis using laser microdissection in esophageal squamous cell carcinoma. Int J Oncol. 2006;29(6):1337-1347.
24. Duong C, Greenawalt DM, Kowalczyk A, Ciavarella ML, Raskutti G, Murray WK, Phillips WA, Thomas RJ. Pretreatment gene expression profiles can be used to predict response to neoadjuvant chemoradiotherapy in esophageal cancer. Ann Surg Oncol. 2007;14(12):3602-3609. doi: 10.1245/s10434-007-9550-1.
25. Hammoud ZT, Badve S, Zhao Q, Li L, Saxena R, Thorat MA, Morimiya A, Rieger KM, Kesler KA. Differential gene expression profiling of esophageal adenocarcinoma. J Thorac Cardiovasc Surg. 2009;137(4):829-834. doi: 10.1016/j.jtcvs.2008.08.052.
26. Sano M, Aoyagi K, Takahashi H, Kawamura T, Mabuchi T, Igaki H, Tachimori Y, Kato H, Ochiai A, Honda H, Nimura Y, Nagino M, Yoshida T et al. Forkhead box A1 transcriptional pathway in KRT7-expressing esophageal squamous cell carcinomas with extensive lymph node metastasis. Int J Oncol. 2010;36(2):321-330.
27. Rao S, Welsh L, Cunningham D, te-Poele RH, Benson M, Norman A, Saffery C, Giddings I, Workman P, Clarke PA. Correlation of overall survival with gene expression profiles in a prospective study of resectable esophageal cancer. Clin Colorectal Cancer. 2011;10(1):48-56. doi: 10.3816/CCC.2011.n.007.
28. Motoori M, Takemasa I, Yamasaki M, Komori T, Takeno A, Miyata H, Takiguchi S, Fujiwara Y, Yasuda T, Yano M, Matsuura N, Matsubara K, Monden M, et al. Prediction of the response to chemotherapy in advanced esophageal cancer by gene expression profiling of biopsy samples. Int J Oncol. 2010;37(5):1113-1120.
29. Kim SM, Park YY, Park ES, Cho JY, Izzo JG, Zhang D, Kim SB, Lee JH, Bhutani MS, Swisher SG, Wu X, Coombes KR, Maru D et al. Prognostic biomarkers for esophageal adenocarcinoma identified by analysis of tumor transcriptome. PLoS One. 2010;5(11):e15074. doi: 10.1371/journal.pone.0015074.
30. Goh XY, Rees JR, Paterson AL, Chin SF, Marioni JC, Save V, O’Donovan M, Eijk PP, Alderson D, Ylstra B, Caldas C, Fitzgerald RC. Integrative analysis of array-comparative genomic hybridisation and matched gene expression profiling data reveals novel genes with prognostic significance in oesophageal adenocarcinoma. Gut. 2011;60(10):1317-1326. doi: 10.1136/gut.2010.234179.
31. Tamoto E, Tada M, Murakawa K, Takada M, Shindo G, Teramoto K, Matsunaga A, Komuro K, Kanai M, Kawakami A, Fujiwara Y, Kobayashi N, Shirata K, et al. Gene-expression profile changes correlated with tumor progression and lymph node metastasis in esophageal cancer. Clin Cancer Res. 2004;10(11):3629-3638. doi: 10.1158/1078-0432.CCR-04-0048.
32. Luthra R, Wu TT, Luthra MG, Izzo J, Lopez-Alvarez E, Zhang L, Bailey J, Lee JH, Bresalier R, Rashid A, Swisher SG, Ajani JA. Gene expression profiling of localized esophageal carcinomas: Association with pathologic response to preoperative chemoradiation. J Clin Oncol. 2006;24(2):259-267. doi: JCO.2005.03.3688.
33. Lagarde SM, Ver Loren van Themaat PE, Moerland PD, Gilhuijs-Pederson LA, Ten Kate FJ, Reitsma PH, van Kampen AH, Zwinderman AH, Baas F, van Lanschot JJ. Analysis of gene expression identifies differentially expressed genes and pathways associated with lymphatic dissemination in patients with adenocarcinoma of the esophagus. Ann Surg Oncol. 2008;15(12):3459-3470. doi: 10.1245/s10434-008-0165-y.
34. Maher SG, Gillham CM, Duggan SP, Smyth PC, Miller N, Muldoon C, O’Byrne KJ, Sheils OM, Hollywood D, Reynolds JV. Gene expression analysis of diagnostic biopsies predicts pathological response to neoadjuvant chemoradiotherapy of esophageal cancer. Ann Surg. 2009;250(5):729-737. doi: 10.1097/SLA.0b013e3181bce7e1.
35. Schauer M, Janssen KP, Rimkus C, Raggi M, Feith M, Friess H, Theisen J. Microarray-based response prediction in esophageal adenocarcinoma. Clin Cancer Res. 2010;16(1):330-337. doi: 10.1158/1078-0432.CCR-09-1673.
36. Peters CJ, Rees JR, Hardwick RH, Hardwick JS, Vowler SL, Ong CA, Zhang C, Save V, O’Donovan M, Rassl D, Alderson D, Caldas C, Fitzgerald RC et al. A 4-gene signature predicts survival of patients with resected adenocarcinoma of the esophagus, junction, and gastric cardia. Gastroenterology. 2010;139(6):1995-2004.e15. doi: 10.1053/j.gastro.2010.05.080.
37. Pennathur A, Xi L, Litle VR, Gooding WE, Krasinskas A, Landreneau RJ, Godfrey TE, Luketich JD. Gene expression profiles in esophageal adenocarcinoma predict survival after resection. J Thorac Cardiovasc Surg. 2013;145(2):505-12; discussion 512-3. doi: 10.1016/j.jtcvs.2012.10.031.
38. Lu P, Qiao J, He W, Wang J, Jia Y, Sun Y, Tang S, Fu L, Qin Y. Genome-wide gene expression profile analyses identify CTTN as a potential prognostic marker in esophageal cancer. PLoS One. 2014;9(2):e88918. doi: 10.1371/journal.pone.0088918.
39. Wen J, Yang H, Liu MZ, Luo KJ, Liu H, Hu Y, Zhang X, Lai RC, Lin T, Wang HY, Fu JH. Gene expression analysis of pretreatment biopsies predicts the pathological response of esophageal squamous cell carcinomas to neo-chemoradiotherapy. Ann Oncol. 2014;25(9):1769-1774. doi: 10.1093/annonc/mdu201.
40. Lin ZW, Gu J, Liu RH, Liu XM, Xu FK, Zhao GY, Lu CL, Ge D. Genome-wide screening and co-expression network analysis identify recurrence-specific biomarkers of esophageal squamous cell carcinoma. Tumour Biol. 2014;35(11):10959-10968. doi: 10.1007/s13277-014-2388-9.
41. Chang F, Deere H, Mahadeva U, George S. Histopathologic examination and reporting of esophageal carcinomas following preoperative neoadjuvant therapy: Practical guidelines and current issues. Am J Clin Pathol. 2008;129(2):252-262. doi: 10.1309/CCR3QN4874YJDJJ7.
42. Mandard AM, Dalibard F, Mandard JC, Marnay J, Henry-Amar M, Petiot JF, Roussel A, Jacob JH, Segol P, Samama G. Pathologic assessment of tumor regression after preoperative chemoradiotherapy of esophageal carcinoma. clinicopathologic correlations. Cancer. 1994;73(11):2680-2686.
43. Westerterp M, van Westreenen HL, Reitsma JB, Hoekstra OS, Stoker J, Fockens P, Jager PL, Van Eck-Smit BL, Plukker JT, van Lanschot JJ, Sloof GW. Esophageal cancer: CT, endoscopic US, and FDG PET for assessment of response to neoadjuvant therapy--systematic review. Radiology. 2005;236(3):841-851. doi: 236/3/841.
44. Wijnhoven BP, Tran KT, Esterman A, Watson DI, Tilanus HW. An evaluation of prognostic factors and tumor staging of resected carcinoma of the esophagus. Ann Surg. 2007;245(5):717-725. doi: 10.1097/01.sla.0000251703.35919.02.
45. Chirieac LR, Swisher SG, Ajani JA, Komaki RR, Correa AM, Morris JS, Roth JA, Rashid A, Hamilton SR, Wu TT. Posttherapy pathologic stage predicts survival in patients with esophageal carcinoma receiving preoperative chemoradiation. Cancer. 2005;103(7):1347-1355. doi: 10.1002/cncr.20916.
46. Parry K, Visser E, van Rossum PS, Mohammad NH, Ruurda JP, van Hillegersberg R. Prognosis and treatment after diagnosis of recurrent esophageal carcinoma following esophagectomy with curative intent. Ann Surg Oncol. 2015;22 Suppl 3:1292-1300. doi: 10.1245/s10434-015-4840-5.
47. Miyata H, Yamasaki M, Kurokawa Y, Takiguchi S, Nakajima K, Fujiwara Y, Konishi K, Mori M, Doki Y. Survival factors in patients with recurrence after curative resection of esophageal squamous cell carcinomas. Ann Surg Oncol. 2011;18(12):3353-3361. doi: 10.1245/s10434-011-1747-7.
48. Cunningham D, Starling N, Rao S, Iveson T, Nicolson M, Coxon F, Middleton G, Daniel F, Oates J, Norman AR; Upper Gastrointestinal Clinical Studies Group of the National Cancer Research Institute of the United Kingdom. Capecitabine and oxaliplatin for advanced esophagogastric cancer. N Engl J Med. 2008;358(1):36-46. doi: 10.1056/NEJMoa073149.
49. Chowhan NM. Injurious effects of radiation on the esophagus. Am J Gastroenterol. 1990;85(2):115-120.
50. Ma GW, Situ DR, Ma QL, Long H, Zhang LJ, Lin P, Rong TH. Three-field vs two-field lymph node dissection for esophageal cancer: A meta-analysis. World J Gastroenterol. 2014;20(47):18022-18030. doi: 10.3748/wjg.v20.i47.18022.
51. Guinney J, Dienstmann R, Wang X, de Reyniès A, Schlicker A, Soneson C, Marisa L, Roepman P, Nyamundanda G, Angelino P, Bot BM,Morris JS, Simon IM, et al. The consensus molecular subtypes of colorectal cancer. Nat Med. 2015;21(11):1350-1356. doi: 10.1038/nm.3967.
52. Ozsolak F, Milos PM. RNA sequencing: Advances, challenges and opportunities. Nat Rev Genet. 2011;12(2):87-98. doi: 10.1038/nrg2934.
53. Wang Z, Gerstein M, Snyder M. RNA-seq: A revolutionary tool for transcriptomics. Nat Rev Genet. 2009;10(1):57-63. doi: 10.1038/nrg2484.