
INTRODUCTION
Breast cancer is the most common cancer and the leading cause of cancer-related death in women worldwide [1]. It consists of the luminal A, luminal B (HER2-negative), luminal B (HER2-positive), HER2-positive (non-luminal), and triple-negative (ductal) subtypes. Approximately 15% of invasive breast cancers are triple-negative breast cancers (TNBC) that lack estrogen receptor (ER), progesterone receptor (PR), and human epidermal growth factor receptor 2 (HER2) expressions and usually exhibit a high pathological grade and more aggressive clinical behavior. Currently, chemotherapy is the only systemic treatment modality for TNBC patients.
The spindle assembly checkpoint (SAC) is a signaling cascade that prevents chromosome missegregation by arresting mitosis until all chromosomes are properly attached to the mitotic spindle [2]. As the core SAC kinase, TTK kinase is a dual-specificity kinase able to phosphorylate serine/threonine and tyrosine residues [3], and critical for the recruitment of SAC proteins to unattached kinetochores, mitotic checkpoint complex (MCC) formation, and mitotic arrest [4]. Thus, the inhibition of TTK activity causes cells to prematurely exit mitosis with unattached chromosomes, resulting in severe chromosome missegregation, aneuploidy, and eventually cell death [5–8]. The increased expression of mitotic checkpoint genes contributes to chromosomal instability in cancer cells [9–12]. Elevated TTK mRNA levels are found in several human cancers, including thyroid carcinoma, breast cancer, lung cancer, pancreatic cancer, prostate cancer, and melanoma, as well as glioblastoma and hepatocellular carcinoma—where it is associated with poor prognosis [9, 11, 13-18].
Previous studies show that TTK is overexpressed in breast cancer tissue and cells, particularly in the HER2-positive and TNBC subtypes [9, 10, 19, 20]. Whether it is also a prognostic factor in TNBC remains disputed. In the current study, we retrospectively analyzed TTK expression in 169 TNBC samples and investigated the correlation between TTK expression and TNBC prognosis.
RESULTS
Clinicopathological characteristics and survival data of the cohort
The present study enrolled 169 consecutive TNBC cases (Table 1). The median age of patients at surgery was 51 years (range, 16–81 years). Most cases were immediate- to high-grade invasive breast ductal carcinoma (162/169, 95.5%), and 91.7% (155/169) of patients received a modified radical mastectomy. Of cases with available adjuvant treatment information, 99.3% (134/135) received chemotherapy (one ceased treatment because of an allergic reaction) and 34.3% (48/140) received radiation. Five cases lost follow-up. The median overall follow-up period was 1864 days (range, 1104–2373 days), and the five-year DFS and OS rates were 76.2% and 90.6%, respectively.
Table 1: Baseline clinicopathological characteristics and treatments of the cohort
Characteristics (n=169) |
Values |
|---|---|
Age at diagnosis: |
|
Median, range (years) |
51 (26~81) |
<40 |
30 (17.8%) |
40~59 |
103 (60.9%) |
≥60 |
36 (21.3%) |
surgery |
|
MRM |
155 (91.7%) |
BCS |
14 (8.3%) |
Histology subtype |
|
IDC |
162 (95.9%) |
others |
7 (4.1%) |
Grade |
|
Low |
1 (0.6%) |
Intermediate |
43 (25.4%) |
High |
125 (74%) |
Lymphovascular invasion |
|
No |
156 (92.3%) |
Yes |
13 (7.7%) |
Tumor size, cm |
|
≤2 |
82 (48.5%) |
2~5 |
80 (47.3%) |
>5 |
7 (4.1%) |
Number of positive lymph nodes |
|
0 |
89 (52.7%) |
1~3 |
36 (21.3%) |
4~9 |
21 (12.4%) |
≥10 or 3rd stop metastasis |
23 (13.6%) |
Pathologic stage |
|
I |
49 (29.0%) |
II |
73 (43.2%) |
III |
47 (27.8%) |
Ki67 |
|
<20% |
16 (9.5%) |
≥20% |
153 (90.5%) |
P53 status |
|
Negative |
75 (44.4%) |
Positive |
94 (55.6%) |
Molecular subtype |
|
Basal-like TNBC |
97 (57.4%) |
Non basal-like TNBC |
38 (22.5%) |
NA |
34 (20.1%) |
Chemotherapy |
|
None* |
1 (0.6%) |
A-based |
34 (20.1%) |
T-based |
21 (12.4%) |
AT-based |
67 (39.6%) |
Others |
13 (7.7%) |
NA |
34 (20.1%) |
Radiation |
|
No |
92 (54.4%) |
Yes |
48 (28.4%) |
NA |
29 (17.2%) |
Follow-up |
|
Median, range (days) |
1864 (1104~2373) |
5-y disease free rate (%) |
76.2 |
5-y survival rate (%) |
90.6 |
*One ceased chemotherapy because of an allergic reaction
Abbreviations: MRM modified radical mastectomy, BCS breast-conserving surgery, IDC invasive ductal carcinoma, NA not available, A anthrocycline, T taxanes.
TTK expression and cutpoint determination
TTK expression was analyzed in 169 patients. Most samples (168/169, 99.4%) displayed cytoplasm and membrane staining, of which 10 cases (5.9%) had concomitant nuclear expression (Table 2, Figure 1). Both “H-score. Cytoplasm & membrane” and “H-score. Whole cell” methods yielded a cutoff value of 55 with nearly identical p values (p < 0.001, Figure 2); however, the area under the curve (AUC) was slightly higher in the whole cell staining analysis, thus this scoring method was selected and the discriminating threshold set at 55.
Table 2: TTK expression results
Positive cells rate (%) |
Number of cases (%) |
|
|---|---|---|
Cytoplasm & membrane only staining |
||
Negative |
0 |
1 (0.6%) |
Positive |
90 (5~220) |
168 (99.4%) |
1+ |
40 (5~90) |
165 (97.6%) |
2+ |
20 (5~80) |
123 (72.8%) |
3+ |
7.5 (5~40) |
32 (18.9%) |
Nucleus staining |
||
Negative |
0 |
159 (94.1%) |
Positive |
40 (5~160) |
10 (5.9%) |
1+ |
25 (5~40) |
6 (3.6%) |
2+ |
80 (30~80) |
4 (2.4%) |
3+ |
10 |
1 (0.6%) |
Whole cell staining |
||
Negative |
0 |
1 (0.6%) |
Positive |
90 (5~340) |
168 (99.4%) |
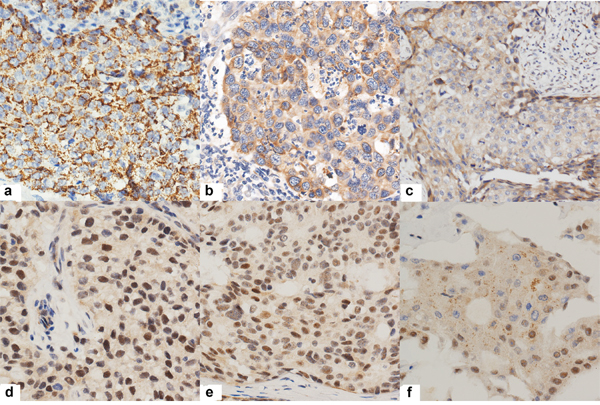
Figure 1: Representative immunohistochemical results of TTK positive tumor cells. a., b., c. showing TTK cytoplasm and membrane positivity with 3+, 2+ and 1+ intensity respectively. d., e., f. showing nucleus positivity with 3+, 2+ and 1+ intensity.
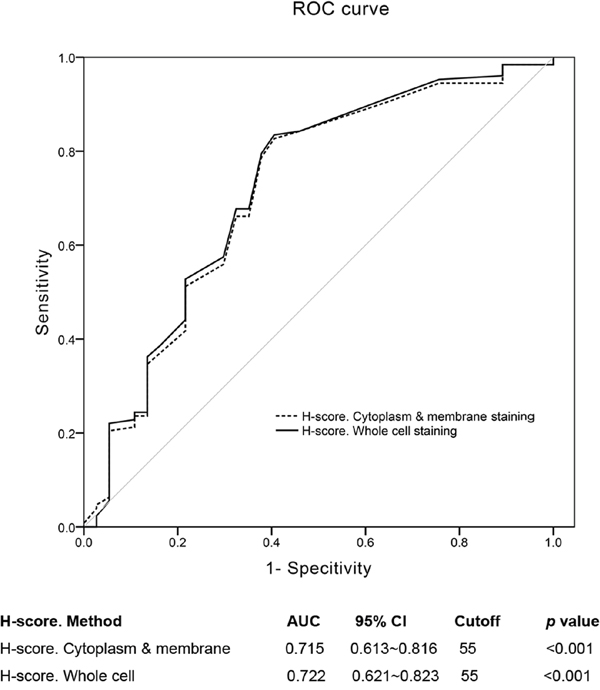
Figure 2: Cutoff values of “H-score. Cytoplasm & membrane” and “H-score. Whole cell”. ROC curves showed that the cutpoint of the two methods were both 55. The “H-score. Whole cell” assessment method had a little higher AUC (0.722 (0.613~0.816)) than the former method (0.715 (0.621~0.823)).
Correlation between TTK and clinicopathological factors
The association between clinicopathological characteristics and TTK expression are summarized in Table 3. No significant association was found between TTK status and age, histology subtype, grade, lymphovascular invasion (LVI), tumor size, number of positive lymph nodes, pathologic stage, Ki67 index, and p53 status; however, TTK overexpression was significantly higher in the basal-like TNBC subgroup.
Table 3: Correlations between TTK expression and clinicopathologic characteristics
characteristics |
TTK (n=166) |
X2 |
p |
|
|---|---|---|---|---|
Low expression |
High expression |
|||
Age at diagnosis: 51 (26~81) |
2.415 |
0.299 |
||
<40 |
9 (5.3%) |
21 (12.4%) |
||
40~59 |
22 (13.0%) |
81 (47.9%) |
||
≥60 |
12 (7.1%) |
24 (14.2%) |
||
Histology subtype |
1.289 |
0.256 |
||
IDC |
43 (25.4%) |
119 (70.4%) |
||
others |
0 (0%) |
7 (4.1%) |
||
Grade |
0.006 |
0.937 |
||
Low/Intermediate |
11 (6.5%) |
33 (19.5%) |
||
High |
32 (18.9%) |
93 (55.0%) |
||
Lymphovascular invasion |
2.111 |
0.146 |
||
No |
37 (21.9%) |
119 (70.4%) |
||
Yes |
6 (3.6%) |
7 (4.1%) |
||
Tumor size (cm) |
2.841 |
0.242 |
||
≤2 |
17 (10.1%) |
65 (38.5%) |
||
2~5 |
25 (14.8%) |
55 (32.5%) |
||
>5 |
1 (0.6%) |
6 (3.6%) |
||
Number of positive lymph nodes |
3.761 |
0.288 |
||
0 |
18 (10.8%) |
71 (42.8%) |
||
1~3 |
10 (6.0%) |
26 (15.7%) |
||
4~9 |
6 (3.0%) |
15 (9.0%) |
||
≥10 or 3rd stop metastasis |
9 (4.8%) |
14 (7.8%) |
||
Pathologic stage |
2.344 |
0.310 |
||
I |
9 (5.3%) |
40 (23.7%) |
||
II |
19 (11.2%) |
54 (32.0%) |
||
III |
15 (8.9%) |
32 (18.9%) |
||
Ki67 index |
0.743 |
0.389 |
||
<20% |
6 (3.6%) |
10 (6.0%) |
||
≥20% |
37 (21.1%) |
116 (69.3%) |
||
P53 status |
0.001 |
0.977 |
||
Negative |
19 (11.2%) |
56 (33.1%) |
||
Positive |
24 (14.2%) |
70 (41.4%) |
||
Molecular subtype |
3.870 |
0.049 |
||
Basal-like TNBC |
22 (13.0%) |
75 (44.4%) |
||
Non basal-like TNBC |
15 (8.8%) |
23 (13.6%) |
||
NA |
6 (3.6%) |
28 (16.6%) |
||
Abbreviations: IDC invasive ductal carcinoma, A Anthracyclin, T Taxanes, NA Not available.
Survival analysis
Clinical follow-up data were available for 164 out of 169 patients. Univariate survival analysis revealed that LVI, increased tumor size, positive lymph nodes, advanced stage, specific chemotherapy regimen (Anthracycline+Taxanes (AT)-based regimen), and lower TTK expression were associated with shorter DFS (Table 4). All of these factors excepting increased tumor size, as well as radiation therapy, were also associated with a reduced OS (Table 4). The Kaplan-Meier curves for DFS and OS against TTK expression are shown in Figure 3. Conversely, age, surgery type, histology subtype, grade, p53 status, Ki67 index, and molecular subtype had no impact on survival in our study.
Table 4: Univariate analyses of survival against various characteristics
Variables |
No.Pat |
DFS |
OS |
||||
|---|---|---|---|---|---|---|---|
No.even |
X2 |
P |
No.evetnt |
X2 |
P |
||
Age |
4.316 |
0.116 |
2.232 |
0.328 |
|||
<40 |
30 |
20 |
3 |
||||
40~59 |
100 |
17 |
7 |
||||
≥60 |
34 |
10 |
5 |
||||
Surgery |
1.970 |
0.160 |
0.102 |
0.749 |
|||
MRM |
150 |
36 |
14 |
||||
BCS |
14 |
1 |
1 |
||||
Histology |
0.017 |
0.895 |
0.815 |
0.367 |
|||
IDC |
159 |
36 |
14 |
||||
others |
5 |
1 |
1 |
||||
Grade |
0.402 |
0.526 |
0.244 |
0.621 |
|||
Low/Intermediate |
42 |
11 |
3 |
||||
High |
122 |
26 |
12 |
||||
LVI |
22.276 |
<0.001 |
3.864 |
0.049 |
|||
No |
151 |
29 |
12 |
||||
yes |
13 |
8 |
3 |
||||
P53 |
0.289 |
0.591 |
0.022 |
0.883 |
|||
Neg |
73 |
15 |
7 |
||||
Pos |
91 |
22 |
8 |
||||
Ki67 index |
1.226 |
0.268 |
2.963 |
0.085 |
|||
<20% |
14 |
5 |
3 |
||||
≥20% |
150 |
32 |
12 |
||||
Tumor size |
14.300 |
0.001 |
1.858 |
0.395 |
|||
≤2cm |
80 |
11 |
5 |
||||
2-5cm |
78 |
22 |
9 |
||||
>5cm |
6 |
4 |
1 |
||||
Number of positive lymph nodes |
32.757 |
<0.001 |
23.720 |
<0.001 |
|||
0 |
89 |
11 |
4 |
||||
1~3 |
35 |
9 |
2 |
||||
4~9 |
20 |
5 |
2 |
||||
≥10 or 3rd stop metastasis |
20 |
12 |
7 |
||||
Stage |
18.048 |
<0.001 |
11.361 |
0.003 |
|||
I |
49 |
4 |
2 |
||||
II |
73 |
15 |
4 |
||||
III |
42 |
18 |
9 |
||||
Molecular subtype |
0.206 |
0.650 |
0.295 |
0.587 |
|||
Basal-like TNBC |
96 |
22 |
9 |
||||
Non basal-like TNBC |
37 |
9 |
2 |
||||
NA |
31 |
6 |
4 |
||||
Chemotherapy |
10.014 |
0.018 |
11.365 |
0.010 |
|||
None* |
1 |
0 |
0 |
||||
A-based |
34 |
4 |
0 |
||||
T-based |
21 |
3 |
2 |
||||
AT-based |
67 |
20 |
6 |
||||
Others |
12 |
6 |
4 |
||||
NA |
29 |
4 |
3 |
||||
Radiation |
1.299 |
0.254 |
3.848 |
0.050 |
|||
No |
91 |
20 |
6 |
||||
Yes |
48 |
14 |
8 |
||||
NA |
35 |
3 |
1 |
||||
TTK expression |
29.438 |
<0.001 |
6.653 |
0.010 |
|||
<55 |
43 |
22 |
7 |
||||
≥55 |
121 |
15 |
7 |
||||
*One ceased chemotherapy because of an allergic reaction.
Abbreviations: MRM modified radical mastectomy, BCS breast-conserving surgery, IDC invasive ductal carcinoma, NA not available, A anthrocycline, T taxanes.
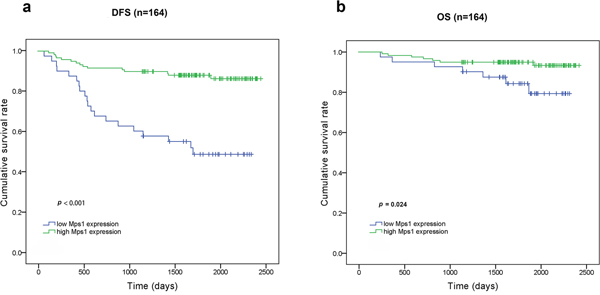
Figure 3: Kaplan-Meier curves for DFS and overall survival OS according to TTK expression. a. TTKhigh patients had a longer DFS than TTKlow patients (p<0.001). b. TTKhigh patients had a longer OS than TTKlow patients (p=0.024).
Cox regression multivariate analysis of DFS and OS revealed that TTK expression was an independent predictor for DFS (p < 0.001), but not for OS, whereas the number of positive lymph nodes was an independent predictor for both DFS (p < 0.001) and OS (p = 0.005) (Table 5). Cox regression analysis results for other clinical variables are shown in Supplemental Table S1–S3.
Table 5: Multivariate analysis of survival against various characteristics
DFS |
OS |
|||||
|---|---|---|---|---|---|---|
Hazard ratio |
95.0% confidence interval |
p value |
Hazard ratio |
95.0% confidence interval |
p value |
|
Age |
0.268 |
0.331 |
||||
<40 |
1 |
1 |
||||
40~59 |
0.532 |
0.228~1.240 |
0.627 |
0.134~2.929 |
||
≥60 |
0.862 |
0.321~2.310 |
1.715 |
0.341~8.617 |
||
surgery |
0.080 |
0.861 |
||||
MRM |
1 |
1 |
||||
BCS |
0.157 |
0.020~1.243 |
1.223 |
0.128~11.640 |
||
Histology subtype |
0.626 |
0.415 |
||||
IDC |
1 |
1 |
||||
Others |
1.691 |
0.205~13.946 |
2.540 |
0.270~23.874 |
0.186 |
|
Grade |
0.601 |
|||||
Low/Intermediate |
1 |
1 |
||||
High |
0.815 |
0.379~1.753 |
2.632 |
0.627~11.041 |
||
P53 |
0.857 |
0.392 |
||||
Negative |
1 |
1 |
||||
Positive |
1.067 |
0.526~2.164 |
0.597 |
0.183~1.947 |
||
Ki67 |
0.662 |
0.223 |
||||
<20% |
1 |
1 |
||||
≥20% |
1.256 |
0.453~3.483 |
0.391 |
0.086~1.769 |
||
Number of positive lymph nodes* |
0.000 |
0.002 |
||||
0 |
1 |
1 |
||||
1~3 |
2.256 |
0.915~5.561 |
1.244 |
0.216~7.167 |
||
4~9 |
1.661 |
0.569~4.851 |
1.592 |
0.273~9.276 |
||
≥10 or 3rd stop metastasis |
7.195 |
2.965~17.459 |
10.690 |
2.814~40.611 |
||
TTK expression |
0.000 |
0.111 |
||||
<55 |
1 |
1 |
||||
≥55 |
0.197 |
0.098~0.398 |
0.394 |
0.125~1.240 |
||
*Because of multicollinearity between lymphovascular invasion, tumor size, number of positive lymph nodes, and pathological stage, only number of positive lymph nodes entered Cox regression model in this table.
Abbreviations: MRM modified radical mastectomy, BCS breast-conserving surgery, IDC invasive ductal carcinoma.
Further subgroup analysis by log-rank testing showed that TTK expression associated with DFS in both basal-like (p = 0.001) and non-basal-like (p = 0.001) TNBC cases (Figure 4).
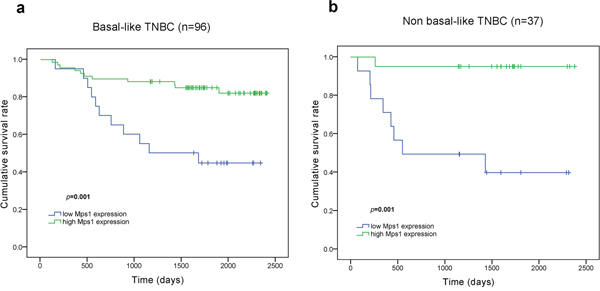
Figure 4: Kaplan-Meier curves for DFS according to TTK expression among TNBC subgroup corhorts. a. TTKhigh patients had a longer DFS than TTKlow patients among basal-like TNBC cohort (p=0.001). b. TTKhigh patients had a longer DFS than TTKlow patients among non basal-like TNBC cohort (p=0.001).
DISCUSSION
In the present study, it was found that TTK expression was associated with the TNBC molecular subtype and correlated with a better prognosis. Cox regression multivariate analysis confirmed TTK expression as an independent favorable prognostic indicator for TNBC. Consistent with our results, Maire et al [20] reported that low TTK mRNA expression in TNBC is significantly associated with a poorer overall survival, an increased risk of metastasis, and shorter DFS. However, AI-Ejeh et al [19] found that TTK protein levels were elevated specifically in highly aggressive tumors, leading to poor survival of less than 2 years. Both of the two studies had small sample sizes (39 and 69, respectively), and used different methods (RNA microarray analysis and IHC analysis) to determine expression. In addition, the latter study only used staining intensity to evaluate TTK protein expression, which might be far from a sufficient semi-quantitative assessment. Here, TTK protein expression was analyzed semi-quantitatively using the H-scoring system, which accounts for both staining intensity and the percentage of positive cells. A discriminating threshold for TTK expression was then determined with ROC curve analysis. This is the first study to evaluate the impact of TTK protein expression on the survival of a consecutive TNBC cohort with the largest sample size.
TTK has universally conserved functions at kinetochores to monitor the correct bipolar attachment and tension of all chromosomes to the mitotic spindle. Loss of TTK function causes chromosomal missegregation and induces cells apoptosis, while high level of TTK enable cells with higher aneuploidy to survive [9, 12, 16]. However, an auto-regulatory negative feedback loop between TTK and B-RafWT/ERK signaling was found in melanoma cells [21]. Deregulation of B-Raf/ERK signaling pathway is frequently observed and plays a central role in the carcinogenesis and maintenance of several cancers [22]. The negative feedback loop might exist in TNBC cells and low level of TTK activates the B-Raf/ERK signaling, which contributes to the invasiveness of cancer cells and poor survival of patients. Therefore, TTK plays a special and complicated role in breast cancer and should be regarded as an important regulator factor.
The use of TTK expression as a positive prognostic indicator may help in personalized prognosis evaluation and treatment. Apart from the traditional prognostic indicators-ER, PR and HER2, assessment of the TTK expression provides additional prognostic information. For example, in patients with early breast cancer of hormone receptor positive and HER2 negative, a high level of TTK expression predicts a good survival and may spare adjuvant chemotherapy safely. However, a low level of TTK expression may hint the need of cytotoxic agents. The data also identified a low TTK-expression TNBC subset with significantly worse prognosis in both basal-like and non-basal-like tumors. The molecular subgroup which was ER–/PR–/HER2–/TTKlow presented a quadrate-negative phenotype and was defined as quadrate-negative breast cancer (QNBC) in the current study. In other words, the four-biomarker panel can identify some TNBC cases with dismal prognosis which might require more intense treatment than others.
Numerous studies suggest that TTK may be a promising drug target for anticancer therapy, and several small-molecule inhibitors targeting this kinase are currently under development [5–8, 23–25] or have entered the clinic (BAY 1161909, NCT02138812; BAY 1217389, NCT02366949) [26]. However, the patient groups that would benefit from TTK-targeted therapy remain unclear. Moreover, because TTK is expressed in all proliferating human cells [27], these inhibitors should be used cautiously to avoid severe adverse effects. TTK-567(SYRNEIAYL) epitope peptide was also used to elicit cytotoxic T lymphocytes to establish cancer vaccines in lung, esophageal and advanced biliary tract cancers [28, 29].
This study has several limitations, primarily its retrospective nature and single-institution sample. The lack of a standard method to assess TTK expression is also a disadvantage. In addition, multicollinearity existed between lymph-vascular invasion, tumor size, number of positive lymph nodes, and pathological stage in the clinicopathological data, but these characteristics were considered separately in the Cox regression model. The Cox regression analysis showed TTK expression not an independent impact factor for OS. It might contribute to the small number of deaths and relative short follow-up period. For these reasons, a multi-institution prospective study with all molecular subtypes will be required to verify the prognostic role of TTK and to further assess the clinical significance of QNBC group.
In conclusion, while these findings should be confirmed with a larger patient population, our results suggest that TTK expression is a favorable independent prognostic biomarker for TNBC survival.
MATERIALS AND METHODS
Patients and tumor specimens
The study population included patients with unilateral TNBC who received curative surgery and adjuvant treatment according to guidelines at the Department of Breast Surgery of Peking Union Medical College Hospital (PUMCH) between January 2010 and June 2013. Cases with insufficient paraffin-embedded tumor tissue or those treated with neoadjuvant therapy were excluded from the study, resulting in a total of 169 consecutive enrolled patients (Figure 5). The follow-up period lasted from the date of surgery until June 2016. The primary endpoint was Disease-free survival (DFS) and secondary endpoint was overall survival (OS). DFS and OS intervals were defined as the time from surgery to the date of breast cancer-related relapse or death, respectively. Relapsed disease and metastasis were verified by diagnostic imaging and pathology during follow-up. This study was approved by the Ethics Committee of PUMCH and informed consent was obtained from each patient.
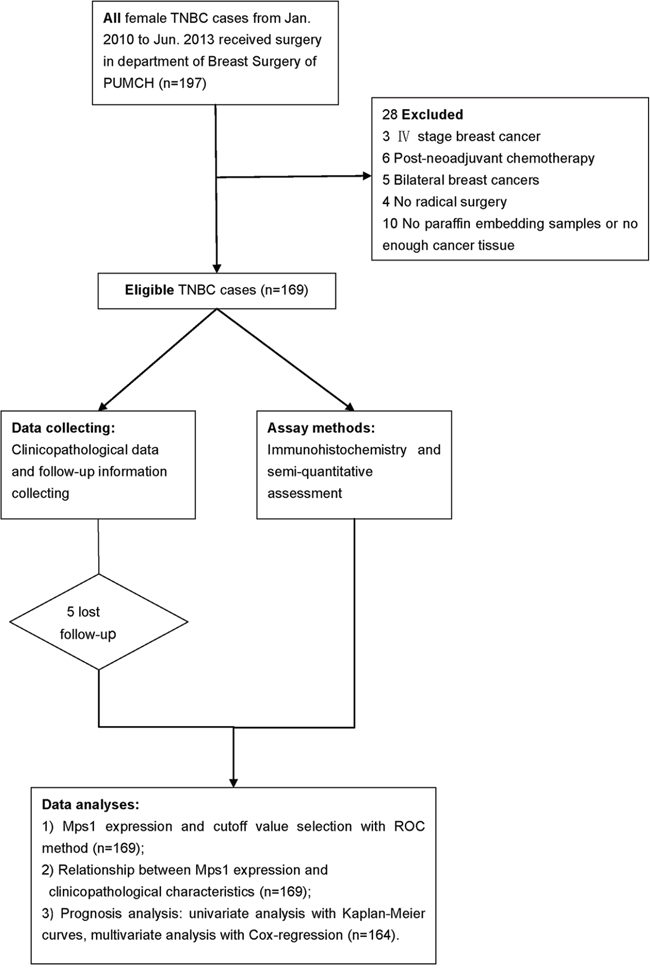
Figure 5: Flow diagram of the study. Total 197 consecutive TNBC cases were reviewed and 169 were included in this study. After clinicopathological and follow-up data collecting and immunohistochemistry experiment, associations between TTK expression with clinicopathological factors and survival were analyzed.
Immunohistochemistry staining and analysis
All tissues were fixed in 10% neutral-buffered formalin immediately after surgical resection and embedded in paraffin. Serial sections (3–4 μm) were mounted on adhesion slides. Immunohistochemical staining was performed with a Ventana Benchmark XT autostainer using standard autostaining protocols (Ventana Medical Systems Inc., Tucson, AZ) and all slides were processed according to the manufacturer’s protocols. The antibodies used for biomarker expression analysis and their optimized staining conditions are described in Table 6. Positive and negative controls were performed using the manufacturer-recommended control tissue and isotype antibody respectively.
Table 6: Antibodies and optimizations for the immunohistochemical analysis
Antibody |
Clone |
Dilution |
Source |
Positive style |
Positive control |
Cutoff values (%) |
Heat-induced antigen retrieval by 1 mM EDTA in 10 mM Tris buffer (pH 8.5) |
Incubation |
|---|---|---|---|---|---|---|---|---|
ERα |
Rabbit monoclonal (EP1) |
Prediluted |
Epitomics |
Nuclear staining |
Breast cancer or human, endometrial carcinoma |
≥1 |
100 °C, 30 min |
37 °C, 32 min |
PR |
Rabbit monoclonal (EP2) |
Prediluted |
Epitomics |
Nuclear staining |
Breast cancer |
≥1 |
100 °C, 30 min |
37 °C, 32 min |
Her-2 |
Rabbit monoclonal (4B5) |
Prediluted |
Ventana |
Membrane staining |
Breast cancer |
According to [34] |
100 °C, 30 min |
37 °C, 32 min |
CK5/6 |
Mouse monoclonal (D5/16 B4) |
Prediluted |
Dako |
Membrane and/or cytoplasmic staining |
Mesothelioma |
≥5 |
100 °C, 30 min |
37 °C, 32 min |
EGFR |
Rabbit monoclonal (5B7) |
Prediluted |
Ventana |
Membrane and/or cytoplasmic staining |
Skin |
>25 |
100 °C, 30 min |
37 °C, 32 min |
P53 |
Mouse monoclonal (DO7) |
Prediluted |
MXB |
Nuclear staining |
Colon adenocarcinoma |
≥5 |
100 °C, 30 min |
37 °C, 32 min |
Ki-67 |
Mouse monoclonal (MIB1) |
Prediluted |
ZSGB-BIO |
Nuclear staining |
Breast cancer |
≥14 |
100 °C, 30 min |
37 °C, 32 min |
TTK |
Rabbit polyclonal |
1:100 |
Sigma |
Cytoplasmic and/ or membrane staining, rare nuclear staining |
Small intestine |
≥55 |
100 °C, 30 min |
37 °C, 32 min |
IHC slides were evaluated by two experienced pathologists in a blinded manner. Positive staining was defined as cells with staining patterns specified in Table 6. H-scoring was used to quantify TTK staining because no uniform standard exists [30–34]. For this, the overall staining intensity (0-3) was multiplied by the percentage of positive cells (0-100%), and all values were added to generate a final H-score ranging from 0 to 300. For ROC curve analysis, TTK staining was scored based on staining only in the cytoplasm and membrane (“H-score. Cytoplasm & membrane”) or in the whole cell including cytoplasm, membrane and nucleus (“H-score. Whole cell”). The expression of other biomarkers was determined based on the cutoff value provided in Table 6. For HER-2 specifically, staining intensities were rated as (0), (1+), (2+), and (3+) according to the HER2 test guide for breast cancer [35]. HER-2 (0) or (1+) slides were categorized as HER-2-negative, while HER-2 (3+) slides were classified as HER-2-positive. HER-2 (2+) cases were subjected to secondary analysis by fluorescent in situ hybridization (FISH) to confirm HER-2 status on a genetic basis, and those determined to be negative were enrolled in the present study. The five-biomarker immunopanel (ER, PR, HER2, CK5/6, EGFR) was also used to classify TNBC cases as basal-like (ER–/PR–/HER2– with EGFR+ and/or CK5/6+) or non-basal-like (ER–/PR–/HER2–/EGFR–/CK5/6–).
Statistical analysis
Statistical analysis was performed in SPSS 17.0 (SPSS, Chicago, IL, USA). Qualitative variables were compared with chi-square tests and univariate log-rank testing was used to assess the associations of DFS and OS with disease covariates to identify prognostic factors. Cox regression multivariate analysis was performed to determine the significance of prognostic factors. All p values were two sided and considered significant at α = 0.05.
Receiver operating characteristic (ROC) curve analysis was used to assess the discriminatory power of prognostic factors to identify the optimal value of a continuous variable to differentiate between a probability of survival and death [36, 37].
ACKNOWLEDGMENTS
We thank Li Peng, Xin Huang, Yan Li, Xuefei Wang, Ru Yao and Ying Xu for providing some clinicopathological information. We also thank Sumei Zhang and Yufeng Luo for immunohistochemistry techniques consulting.
CONFLICTS OF INTEREST
The authors declare that they have no conflicts of interest.
FUNDING
This study was funded by Twelfth Five Year Key Programs for Science and Technology Development of China (2014BAI08B03), Beijing Municipal Natural Science Foundation (7164292), International Science and Technology Cooperation Projects (2015DFA30650), Capital Special Research Project for Health Development (2014-2-4012) and Capital research project for the characteristics clinical application (Z151100004015170).
Ethical standards
The study complied with the current laws of Republic of China and was approved by the Ethics Committee of PUMCH. Additionally, written informed consent was obtained from each patient.
REFERENCES
1. Ferlay J, Soerjomataram I, Dikshit R, Eser S, Mathers C, Rebelo M, Parkin DM, Forman D, Bray F. Cancer incidence and mortality worldwide: sources, methods and major patterns in GLOBOCAN 2012. INT J CANCER. 2015; 136:E359-E386.
2. Lara-Gonzalez P, Westhorpe FG, Taylor SS. The Spindle Assembly Checkpoint. CURR BIOL. 2012; 22:R966-R980.
3. Lauzé E, Stoelcker B, Luca FC, Weiss E, Schutz AR. Yeast spindle pole body duplication gene MPS1 encodes an essential dual specificity protein kinase. EMBO J. 1995.
4. Xu Q, Zhu S, Wang W, Zhang X, Old W, Ahn N, Liu X. Regulation of Kinetochore Recruitment of Two Essential Mitotic Spindle Checkpoint Proteins by Mps1 Phosphorylation. MOL BIOL CELL. 2008; 20:10-20.
5. Hewitt L, Tighe A, Santaguida S, White AM, Jones CD, Musacchio A, Green S, Taylor SS. Sustained Mps1 activity is required in mitosis to recruit O-Mad2 to the Mad1–C-Mad2 core complex. The Journal of Cell Biology. 2010; 190:25-34.
6. Jemaà M, Galluzzi L, Kepp O, Senovilla L, Brands M, Boemer U, Koppitz M, Lienau P, Prechtl S, Schulze V, Siemeister G, Wengner AM, Mumberg D, Ziegelbauer K, Abrieu A, Castedo M, et al. Characterization of novel MPS1 inhibitors with preclinical anticancer activity. CELL DEATH DIFFER. 2013; 20:1532-1545.
7. Kwiatkowski N, Jelluma N, Filippakopoulos P, Soundararajan M, Manak MS, Kwon M, Choi HG, Sim T, Deveraux QL, Rottmann S, Pellman D, Shah JV, Kops GJPL, Knapp S, Gray NS. Small-molecule kinase inhibitors provide insight into Mps1 cell cycle function. NAT CHEM BIOL. 2010; 6:359-368.
8. Colombo R, Caldarelli M, Mennecozzi M, Giorgini ML, Sola F, Cappella P, Perrera C, Depaolini SR, Rusconi L, Cucchi U, Avanzi N, Bertrand JA, Bossi RT, Pesenti E, Galvani A, Isacchi A, et al. Targeting the Mitotic Checkpoint for Cancer Therapy with NMS-P715, an Inhibitor of MPS1 Kinase. CANCER RES. 2010; 70:10255-10264.
9. Daniel J, Coulter J, Woo JH, Wilsbach K, Gabrielson E. High levels of the Mps1 checkpoint protein are protective of aneuploidy in breast cancer cells. Proceedings of the National Academy of Sciences. 2011; 108:5384-5389.
10. Yuan B. Increased Expression of Mitotic Checkpoint Genes in Breast Cancer Cells with Chromosomal Instability. CLIN CANCER RES. 2006; 12:405-410.
11. Salvatore G, Nappi TC, Salerno P, Jiang Y, Garbi C, Ugolini C, Miccoli P, Basolo F, Castellone MD, Cirafici AM, Melillo RM, Fusco A, Bittner ML, Santoro M. A Cell Proliferation and Chromosomal Instability Signature in Anaplastic Thyroid Carcinoma. CANCER RES. 2007; 67:10148-10158.
12. Ling Y, Zhang X, Bai Y, Li P, Wei C, Song T, Zheng Z, Guan K, Zhang Y, Zhang B, Liu X, Ma RZ, Cao C, Zhong H, Xu Q. Overexpression of Mps1 in colon cancer cells attenuates the spindle assembly checkpoint and increases aneuploidy. BIOCHEM BIOPH RES CO. 2014; 450:1690-1695.
13. Tannous BA, Kerami M, Van der Stoop PM, Kwiatkowski N, Wang J, Zhou W, Kessler AF, Lewandrowski G, Hiddingh L, Sol N, Lagerweij T, Wedekind L, Niers JM, Barazas M, Nilsson RJA, Geerts D, et al. Effects of the Selective MPS1 Inhibitor MPS1-IN-3 on Glioblastoma Sensitivity to Antimitotic Drugs. Journal of the National Cancer Institute. 2013; 105:1322-1331.
14. Landi MT, Dracheva T, Rotunno M, Figueroa JD, Liu H. Gene Expression Signature of Cigarette Smoking and Its Role in Lung Adenocarcinoma Development and Survival. PLOS ONE. 2008.
15. Liang XD, Dai YC, Li ZY, Gan MF, Zhang SR, Yin-Pan, Lu HS, Cao XQ, Zheng BJ, Bao LF, Wang DD, Zhang LM, Ma SL. Expression and function analysis of mitotic checkpoint genes identifies TTK as a potential therapeutic target for human hepatocellular carcinoma. PLOS ONE. 2014; 9:e97739.
16. Kaistha BP, Honstein T, Müller V, Bielak S, Sauer M, Kreider R, Fassan M, Scarpa A, Schmees C, Volkmer H, Gress TM, Buchholz M. Key role of dual specificity kinase TTK in proliferation and survival of pancreatic cancer cells. BRIT J CANCER. 2014; 111:1780-1787.
17. Shiraishi T, Terada N, Zeng Y, Suyama T, Luo J. Cancer/Testis antigens as potential predictors of biochemical recurrence of prostate cancer following radical prostatectomy. J TRANSL MED. 2011.
18. Cui Y, Guadagno TM. B-Raf(V600E) signaling deregulates the mitotic spindle checkpoint through stabilizing Mps1 levels in melanoma cells. ONCOGENE. 2008; 27:3122-3133.
19. Al-Ejeh F, Simpson PT, Sanus JM, Klein K, Kalimutho M, Shi W, Miranda M, Kutasovic J, Raghavendra A, Madore J, Reid L, Krause L, Chenevix-Trench G, Lakhani SR, Khanna KK. Meta-analysis of the global gene expression profile of triple-negative breast cancer identifies genes for the prognostication and treatment of aggressive breast cancer. Oncogenesis. 2014; 3:e100.
20. Maire V, Baldeyron C, Richardson M, Tesson B, Vincent-Salomon A, Gravier E, Marty-Prouvost B, De Koning L, Rigaill G, Dumont A, Gentien D, Barillot E, Roman-Roman S, Depil S, Cruzalegui F, Pierre A, et al. TTK/hMPS1 is an attractive therapeutic target for triple-negative breast cancer. PLOS ONE. 2013; 8:e63712.
21. Zhang L, Shi R, He C, Cheng C, Song B, Cui H, Zhang Y, Zhao Z, Bi Y, Yang X, Miao X, Guo J, Chen X, Wang J, Li Y, Cheng X, et al. Oncogenic B-Raf(V600E) abrogates the AKT/B-Raf/Mps1 interaction in melanoma cells. CANCER LETT. 2013; 337:125-132.
22. McCubrey JA, Steelman LS, Chappell WH, Abrams SL, Wong EW, Chang F, Lehmann B, Terrian DM, Milella M, Tafuri A, Stivala F, Libra M, Basecke J, Evangelisti C, Martelli AM, Franklin RA. Roles of the Raf/MEK/ERK pathway in cell growth, malignant transformation and drug resistance. Biochim Biophys Acta. 2007; 1773:1263-1284.
23. Tardif KD, Rogers A, Cassiano J, Roth BL, Cimbora DM, McKinnon R, Peterson A, Douce TB, Robinson R, Dorweiler I, Davis T, Hess MA, Ostanin K, Papac DI, Baichwal V, McAlexander I, et al. Characterization of the Cellular and Antitumor Effects of MPI-0479605, a Small-Molecule Inhibitor of the Mitotic Kinase Mps1. MOL CANCER THER. 2011; 10:2267-2275.
24. Liu Y, Lang Y, Patel NK, Ng G, Laufer R, Li S, Edwards L, Forrest B, Sampson PB, Feher M, Ban F, Awrey DE, Beletskaya I, Mao G, Hodgson R, Plotnikova O, et al. The Discovery of Orally Bioavailable Tyrosine Threonine Kinase (TTK) Inhibitors: 3-(4-(heterocyclyl)phenyl)-1H -indazole-5-carboxamides as Anticancer Agents. J MED CHEM. 2015; 58:3366-3392.
25. Naud S, Westwood IM, Faisal A, Sheldrake P, Bavetsias V, Atrash B, Cheung KJ, Liu M, Hayes A, Schmitt J, Wood A, Choi V, Boxall K, Mak G, Gurden M, Valenti M, et al. Structure-Based Design of Orally Bioavailable 1H-Pyrrolo[3,2-c]pyridine Inhibitors of Mitotic Kinase Monopolar Spindle 1 (MPS1). J MED CHEM. 2013; 56:10045-10065.
26. Wengner AM, Siemeister G, Koppitz M, Schulze V, Kosemund D, Klar U, Stoeckigt D, Neuhaus R, Lienau P, Bader B, Prechtl S, Raschke M, Frisk AL, von Ahsen O, Michels M, Kreft B, et al. Novel Mps1 Kinase Inhibitors with Potent Antitumor Activity. MOL CANCER THER. 2016; 15:583-592.
27. Hogg D, Guidos C, Bailey D, Amendola A, Groves T, Davidson J, Schmandt R, Mills G. Cell cycle dependent regulation of the protein kinase TTK. ONCOGENE. 1994; 9:89-96.
28. Suda T, Tsunoda T, Daigo Y, Nakamura Y, Tahara H. Identification of human leukocyte antigen-A24-restricted epitope peptides derived from gene products upregulated in lung and esophageal cancers as novel targets for immunotherapy. CANCER SCI. 2007; 98:1803-1808.
29. Aruga A, Takeshita N, Kotera Y, Okuyama R, Matsushita N, Ohta T, Takeda K, Yamamoto M. Long-term Vaccination with Multiple Peptides Derived from Cancer-Testis Antigens Can Maintain a Specific T-cell Response and Achieve Disease Stability in Advanced Biliary Tract Cancer. CLIN CANCER RES. 2013; 19:2224-2231.
30. Yeo W, Chan SL, Mo FK, Chu CM, Hui JW, Tong JH, Chan AW, Koh J, Hui EP, Loong H, Lee K, Li L, Ma B, To KF, Yu SC. Phase I/II study of temsirolimus for patients with unresectable Hepatocellular Carcinoma (HCC)- a correlative study to explore potential biomarkers for response. BMC CANCER. 2015; 15.
31. Specht E, Kaemmerer D, Sänger J, Wirtz RM, Schulz S, Lupp A. Comparison of immunoreactive score, HER2/neu score and H score for the immunohistochemical evaluation of somatostatin receptors in bronchopulmonary neuroendocrine neoplasms. HISTOPATHOLOGY. 2015; 67:368-377.
32. Budwit-Novotny DA, McCarty KS, Cox EB, Soper JT, Mutch DG, Creasman WT, Flowers JL, McCarty KJ. Immunohistochemical analyses of estrogen receptor in endometrial adenocarcinoma using a monoclonal antibody. CANCER RES. 1986; 46:5419-5425.
33. Kraus JA, Dabbs DJ, Beriwal S, Bhargava R. Semi-quantitative immunohistochemical assay versus oncotype DX((R)) qRT-PCR assay for estrogen and progesterone receptors: an independent quality assurance study. Mod Pathol. 2012; 25:869-876.
34. Christoph DC, Kasper S, Gauler TC, Loesch C, Engelhard M, Theegarten D, Poettgen C, Hepp R, Peglow A, Loewendick H, Welter S, Stamatis G, Hirsch FR, Schuler M, Eberhardt WE, Wohlschlaeger J. betaV-tubulin expression is associated with outcome following taxane-based chemotherapy in non-small cell lung cancer. Br J Cancer. 2012; 107:823-830.
35. Wolff AC, Hammond ME, Hicks DG, Dowsett M, McShane LM, Allison KH, Allred DC, Bartlett JM, Bilous M, Fitzgibbons P, Hanna W, Jenkins RB, Mangu PB, Paik S, Perez EA, Press MF, et al. Recommendations for human epidermal growth factor receptor 2 testing in breast cancer: American Society of Clinical Oncology/College of American Pathologists clinical practice guideline update. J CLIN ONCOL. 2013; 31:3997-4013.
36. Hong G, Suh KS, Suh SW, Yoo T, Kim H, Park MS, Choi Y, Paeng JC, Yi NJ, Lee KW. Alpha-fetoprotein and (18)F-FDG positron emission tomography predict tumor recurrence better than Milan criteria in living donor liver transplantation. J HEPATOL. 2016; 64:852-859.
37. Schmid P, Nagai Y, Agarwal R, Hancock B, Savage PM, Sebire NJ, Lindsay I, Wells M, Fisher RA, Short D, Newlands ES, Wischnewsky MB, Seckl MJ. Prognostic markers and long-term outcome of placental-site trophoblastic tumours: a retrospective observational study. The Lancet. 4; 374:48-55.