
INTRODUCTION
Hepatocellular carcinoma (HCC) is one of the most frequent malignancies and the sixth leading cause of cancer-related deaths in the United States [1]. The development of HCC is caused by the interaction of environmental, genetic and epigenetic factors [2, 3], such as aflatoxin exposure, alcohol consumption, hepatitis virus infection and familial tendency [4–6]. In addition, epigenetic modification is involved in HCC pathogenesis [3], and aberrant DNA methylation is the primary mediator of epigenetic changes in HCC [7].
Methylation of CpG islands in the gene promoters is recognized as a common epigenetic mechanism of transcriptional regulations [8, 9], and it has been shown to have a relation to the occurrence and development of several types of carcinomas [10–14]. Aberrant DNA methylation of the gene promoters may become promising biomarkers for the early diagnosis of diseases [15, 16]. Several studies have suggested that aberrant methylation of multiple tumor suppressor genes may contribute to the pathogenesis of HCC and epigenetic inactivation provides a prognostic value for determining the risk for the development of HCC [17, 18].
Aberrant patterns of DNA methylation in HCC can be useful for the prediction of cancer risk. We conduct a comprehensive meta-analysis based on the accumulation of the HCC association studies on DNA methylation to provide molecular clues of the potential diagnostic biomarkers with aberrant DNA methylation in HCC.
RESULTS
A total of 2109 studies were identified by our initial research using the keywords “hepatocellular carcinoma or hepatocarcinoma or primary liver cancer or HCC or hepatic carcinoma or liver tumor” and “DNA methylation” from PubMed, Web of Science, Cochrane Library, Embase, CNKI and Wanfang literature database. After a series of selection procedure shown in Figure 1, we excluded 983 irrelevant studies, 611 non-case control studies, 218 studies without methylation frequency data and 153 studies less than 3 articles. Thus, a total of 144 eligible studies were included in the current meta-analysis (Supplementary Document S1). The 144 case-control studies published from 2000 to 2016 included 6523 HCC tumor tissues, 5498 adjacent tissues, 689 normal tissues, 2044 HCC serums and 1371 normal serums within 24 genes. Among these 24 genes, the meta-analysis of p16, RASSF1A, CDH1, RUNX3 and GSTP1 genes methylation was performed between HCC tumor tissues vs adjacent tissues, HCC tumor tissues vs normal tissues and HCC serums vs normal serums. The meta-analysis of p14, p15, p73, APC, SOCS1, MGMT, SFRP1, PRDM2, DAPK1, RARβ, IGF2 and hMLH1 genes methylation was performed between HCC tumor tissues vs adjacent tissues and HCC tumor tissues vs normal tissues. The meta-analysis of WIF1 gene methylation was performed between HCC tumor tissues vs adjacent tissues and HCC serums vs normal serums, and the meta-analysis of DLC1, p53, SPINT2, RB1, OPCML and WT1 genes methylation was performed between HCC tumor tissues vs adjacent tissues.
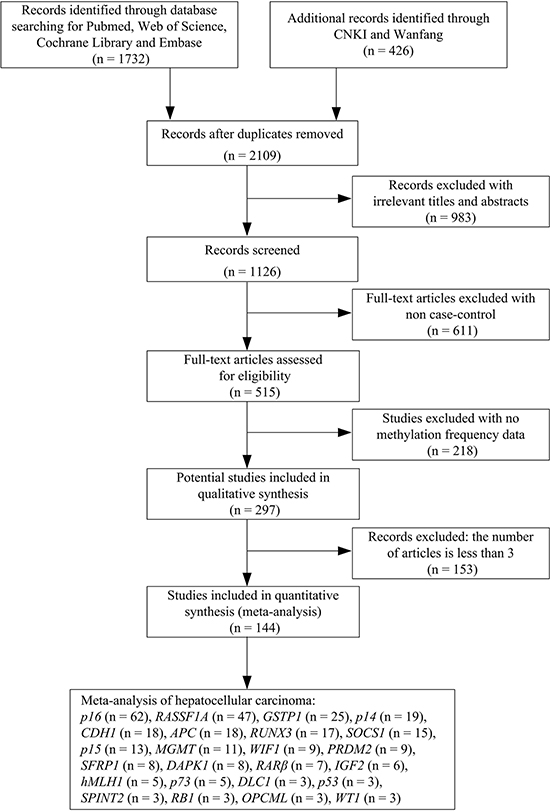
Figure 1: Flow diagram of the stepwise selection from the relevant studies.
For 24 genes reported in at least three studies between HCC tumor tissues and adjacent tissues (Table 1), no evidence of statistical heterogeneity was observed for nine genes, including GSTP1 (I2 = 35%), PRDM2 (I2 = 40%), DAPK1 (I2 = 19%), p73 (I2 = 48%), hMLH1 (I2 = 0%), DLC1 (I2 = 0%), p53 (I2 = 16%), OPCML (I2 = 0%) and WT1 (I2 = 0%). No visual bias was shown in the meta-analysis of the above nine genes (Figure 2). Our data also demonstrated a significant heterogeneity of the remaining 15 genes that included p16 (I2 = 68%), RASSF1A (I2 = 53%), p14 (I2 = 77%), APC (I2 = 71%), RUNX3 (I2 = 68%), SOCS1 (I2 = 82%), CDH1 (I2 = 82%), p15 (I2 = 51%), MGMT (I2 = 79%), WIF1 (I2 = 71%), SFRP1 (I2 = 67%), RARβ (I2 = 62%), IGF2 (I2 = 86%), SPINT2 (I2 = 71%) and RB1 (I2 = 64%). Therefore, random effect tests were applied for the meta-analysis of the above 15 genes. Their funnel plots were shown in Figure 2.
Table 1: Characteristics of 24 aberrant methylated genes between carcinoma tissues and adjacent tissues in HCC
Gene |
Studies (n) |
Overall OR (95% CI) |
I2 |
P value |
Carcinoma tissues/adjacent tissues |
|---|---|---|---|---|---|
p16 |
43 |
5.10 [3.81, 6.84] |
68% |
< 0.00001 |
2185/2081 |
RASSF1A |
28 |
6.70 [4.83, 9.30] |
53% |
< 0.00001 |
1414/1265 |
GSTP1 |
20 |
6.81 [5.39, 8.62] |
35% |
< 0.00001 |
1011/883 |
p14 |
17 |
2.67 [1.26, 5.64] |
77% |
0.01 |
911/717 |
APC |
15 |
5.14 [3.18, 8.30] |
71% |
< 0.00001 |
888/762 |
RUNX3 |
13 |
19.99 [10.06, 39.72] |
68% |
< 0.00001 |
1025/998 |
SOCS1 |
13 |
3.47 [1.80, 6.71] |
82% |
0.0002 |
767/674 |
CDH1 |
12 |
2.31 [1.13, 4.74] |
82% |
0.02 |
575/533 |
p15 |
12 |
2.03 [1.23, 3.36] |
51% |
0.006 |
535/446 |
MGMT |
10 |
1.66 [0.64, 4.28] |
79% |
0.3 |
560/470 |
PRDM2 |
9 |
12.33 [8.54, 17.81] |
40% |
< 0.00001 |
470/452 |
WIF1 |
8 |
6.53 [3.33, 12.80] |
71% |
< 0.00001 |
654/506 |
DAPK1 |
6 |
1.03 [0.64, 1.66] |
19% |
0.91 |
271/231 |
SFRP1 |
5 |
3.95 [1.91, 8.14] |
67% |
0.0002 |
304/275 |
RARβ |
5 |
5.27 [1.53, 18.10] |
62% |
0.008 |
276/170 |
IGF2 |
5 |
0.18 [0.02, 1.55] |
86% |
0.12 |
160/200 |
p73 |
5 |
6.15 [3.09, 12.24] |
48% |
< 0.00001 |
275/169 |
hMLH1 |
4 |
5.10 [2.20, 11.85] |
0% |
0.0001 |
251/182 |
DLC1 |
3 |
17.30 [6.71, 44.58] |
0% |
< 0.00001 |
206/200 |
p53 |
3 |
5.12 [1.27, 20.59] |
16% |
0.02 |
107/107 |
SPINT2 |
3 |
18.38 [3.81, 88.61] |
71% |
0.0003 |
130/130 |
RB1 |
3 |
7.33 [0.58, 92.08] |
64% |
0.12 |
123/123 |
OPCML |
3 |
1.93 [1.20, 3.11] |
0% |
0.006 |
213/144 |
WT1 |
3 |
5.08 [2.41, 10.69] |
0% |
< 0.0001 |
113/113 |
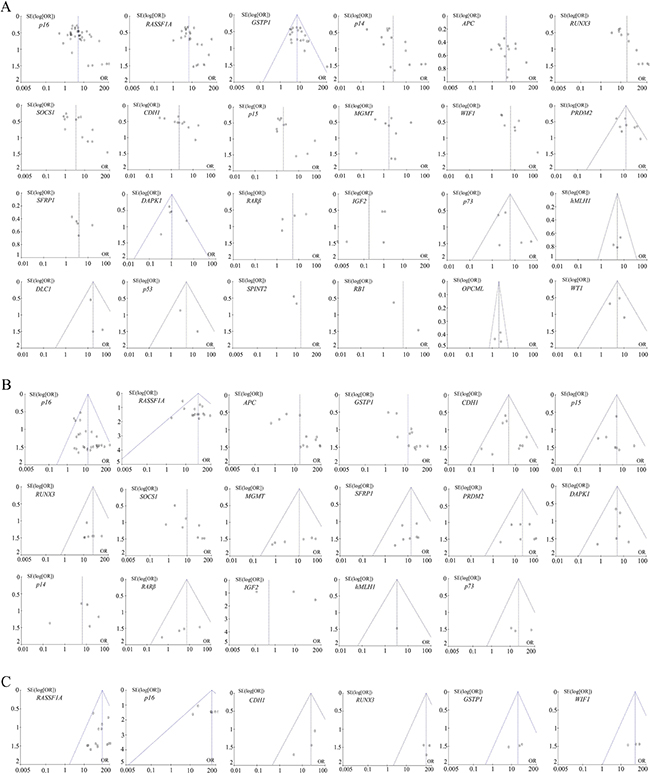
Figure 2: (A) Funnel plots of DNA methylation of 24 genes between HCC tumor tissues and adjacent tissues in the meta-analysis. (B) Funnel plots of DNA methylation of 17 genes between HCC tumor tissues and normal tissues in the meta-analysis. (C) Funnel plots of DNA methylation of four genes between HCC tumor serums and normal serums in the meta-analysis.
For 17 genes reported in at least three studies between HCC tumor tissues and normal tissues (Table 2), no evidence of statistical heterogeneity was observed for 11 genes, including p16 (I2 = 13%), RASSF1A (I2 = 37%), CDH1 (I2 = 17%), p15 (I2 = 0%), RUNX3 (I2 = 0%), MGMT (I2 = 36%), SFRP1 (I2 = 0%), PRDM2 (I2 = 0%), DAPK1 (I2 = 0%), RARβ (I2 = 14%) and p73 (I2 = 0%). No visual bias was shown in the meta-analysis of the above 11 genes (Figure 2). Our data also demonstrated a significant heterogeneity of 5 genes that included APC (I2 = 73%), GSTP1 (I2 = 57%), SOCS1 (I2 = 66%), p14 (I2 = 56%) and IGF2 (I2 = 89%). Therefore, random effect tests were applied for the meta-analysis of the above 5 genes. The heterogeneity of hMLH1 was not applicable, because two of three case-control studies were not estimable. Their funnel plots were shown in Figure 2.
Table 2: Characteristics of 17 aberrant methylated genes between carcinoma tissues and normal tissues in HCC
Gene |
Studies (n) |
Overall OR (95% CI) |
I2 |
P value |
Carcinoma tissues/normal tissues |
|---|---|---|---|---|---|
p16 |
31 |
13.41 [9.18, 19.59] |
13% |
< 0.00001 |
1415/399 |
RASSF1A |
21 |
43.70 [26.92, 70.96] |
37% |
< 0.00001 |
900/341 |
APC |
14 |
17.20 [5.75, 51.41] |
73% |
< 0.00001 |
727/217 |
GSTP1 |
13 |
13.56 [5.52, 33.29] |
57% |
< 0.00001 |
646/199 |
CDH1 |
10 |
4.93 [2.70, 8.99] |
17% |
< 0.00001 |
469/111 |
p15 |
9 |
5.48 [2.54, 11.79] |
0% |
< 0.0001 |
382/70 |
RUNX3 |
8 |
31.16 [12.24, 79.31] |
0% |
< 0.00001 |
549/152 |
SOCS1 |
8 |
9.73 [2.85, 33.27] |
66% |
0.0003 |
474/118 |
MGMT |
8 |
10.84 [3.46, 33.91] |
36% |
< 0.0001 |
458/93 |
PRDM2 |
8 |
24.86 [10.44, 59.17] |
0% |
< 0.00001 |
422/116 |
SFRP1 |
7 |
13.97 [5.28, 36.92] |
0% |
< 0.00001 |
372/91 |
DAPK1 |
7 |
5.32 [2.38, 11.91] |
0% |
< 0.0001 |
328/77 |
p14 |
6 |
6.42 [1.54, 26.69] |
56% |
0.01 |
317/57 |
RARβ |
5 |
7.37 [1.79, 30.39] |
14% |
0.006 |
230/54 |
IGF2 |
5 |
0.48 [0.02, 9.59] |
89% |
0.63 |
207/36 |
hMLH1 |
3 |
3.24 [0.18, 58.10] |
— |
0.42 |
204/34 |
p73 |
3 |
27.59 [4.87, 156.35] |
0% |
0.0002 |
174/27 |
The heterogeneity of hMLH1 gene methylation was not applicable, because two of three case-control studies were not estimable.
For six genes reported in at least three studies between HCC tumor serums and normal serums (Table 3), no evidence of statistical heterogeneity was observed for four genes, including RASSF1A (I2 = 0%), p16 (I2 = 0%), CDH1 (I2 = 0%), RUNX3 (I2 = 0%), GSTP1 (I2 = 0%) and WIF1 (I2 = 0%). No visual bias was shown in the meta-analysis of the above six genes and their funnel plots were shown in Figure 2.
Table 3: Characteristics of six aberrant methylated genes between carcinoma serums and normal serums in HCC
Gene |
Studies (n) |
Overall OR (95% CI) |
I2 |
Pvalue |
Carcinoma serums/normal serums |
|---|---|---|---|---|---|
RASSF1A |
16 |
83.81 [47.35, 148.36] |
0% |
< 0.00001 |
1110/783 |
p16 |
9 |
123.15 [49.12, 308.74] |
0% |
< 0.00001 |
510/352 |
CDH1 |
3 |
23.70 [5.39, 104.28] |
0% |
< 0.0001 |
216/90 |
RUNX3 |
3 |
103.92 [16.33, 661.45] |
0% |
< 0.00001 |
172/110 |
GSTP1 |
3 |
21.09 [4.02, 110.65] |
0% |
0.0003 |
155/100 |
WIF1 |
3 |
53.65 [10.62, 271.09] |
0% |
< 0.00001 |
252/180 |
As shown in Table 1, the meta-analysis of p16 gene was involved with 43 studies between 2185 HCC tumor tissues and 2081 adjacent tissues. Our results revealed that the frequency of p16 gene methylation in carcinoma tissues was significantly higher than adjacent tissues (the overall OR = 5.10, 95% CI = 3.81–6.84, p < 0.00001). The meta-analysis of RASSF1A methylation between 1414 HCC tumor tissues and 1265 adjacent tissues indicated a statistical difference (the overall OR = 6.70, 95% CI = 4.83–9.30, p < 0.00001). The same consequence was also found in the other 18 genes including APC (the overall OR = 5.14, 95% CI = 3.18–8.30, p < 0.00001), RUNX3 (the overall OR = 19.99, 95% CI = 10.06–39.72, p < 0.00001), SOCS1 (the overall OR = 3.47, 95% CI = 1.80–6.71, p = 0.0002), CDH1 (the overall OR = 2.31, 95% CI = 1.13–4.74, p = 0.02), p15 (the overall OR = 2.03, 95% CI = 1.23–3.36, p = 0.006), WIF1 (the overall OR = 6.53, 95% CI = 3.33–12.80, p < 0.00001), PRDM2 (the overall OR = 12.33, 95% CI = 8.54–17.81, p < 0.00001), SFRP1 (the overall OR = 3.95, 95% CI = 1.91–8.14, p = 0.0002), RARβ (the overall OR = 5.27, 95% CI = 1.53–18.10, p = 0.008), p73 (the overall OR = 6.15, 95% CI = 3.09–12.24, p < 0.00001), hMLH1 (the overall OR = 5.10, 95% CI = 2.20–11.85, p = 0.0001), DLC1 (the overall OR = 17.30, 95% CI = 6.71–44.58, p < 0.00001), p53 (the overall OR = 5.12, 95% CI = 1.27–20.59, p = 0.02), SPINT2 (the overall OR = 18.38, 95% CI = 3.81–88.61, p = 0.0003), OPCML (the overall OR = 1.93, 95% CI = 1.20–3.11, p = 0.006) and WT1 (the overall OR = 5.08, 95% CI = 2.41–10.69, p < 0.0001). Our meta-analysis was unable to find any statistical significance between HCC tumor tissues and adjacent tissues for the methylation of the remaining four genes, including MGMT, DAPK1, IGF2 and RB1.
As shown in Table 2, the meta-analysis of p16 gene was involved with 31 studies between 1415 HCC tumor tissues and 399 normal tissues. Our results revealed that the frequency of p16 gene methylation in carcinoma tissues was significantly higher than normal tissues (the overall OR = 13.41, 95% CI = 9.18–19.59, p < 0.00001). The meta-analysis of RASSF1A methylation between 900 HCC tumor tissues and 341 normal tissues indicated a statistical difference (the overall OR = 43.70, 95% CI = 26.92–70.96, p < 0.00001). The same consequence was also found in the other 13 genes including APC (the overall OR = 17.20, 95% CI = 5.75–51.41, p < 0.00001), GSTP1 (the overall OR = 13.56, 95% CI = 5.52–33.29, p < 0.00001), CDH1 (the overall OR = 4.93, 95% CI = 2.70–8.99, p < 0.00001), p15 (the overall OR = 5.48, 95% CI = 2.54–11.79, p < 0.0001), RUNX3 (the overall OR = 31.16, 95% CI = 12.24–79.31, p < 0.00001), SOCS1 (the overall OR = 9.73, 95% CI = 2.85–33.27, p = 0.0003), MGMT (the overall OR = 10.84, 95% CI = 3.46–33.91, p < 0.0001), SFRP1 (the overall OR = 13.97, 95% CI = 5.28–36.92, p < 0.00001), PRDM2 (the overall OR = 24.86, 95% CI = 10.44–59.17, p < 0.00001), DAPK1 (the overall OR = 5.32, 95% CI = 2.38–11.91, p < 0.0001), p14 (the overall OR = 6.42, 95% CI = 1.54–26.69, p = 0.01), RARβ (the overall OR = 7.37, 95% CI = 1.79–30.39, p = 0.006) and p73 (the overall OR = 27.59, 95% CI = 4.87–156.35, p = 0.0002). Our meta-analysis was unable to find any statistical significance between HCC tumor tissues and adjacent tissues for the methylation of the remaining two genes, including IGF2 and hMLH1.
As shown in Table 3, Our meta-analysis showed statistical significance between HCC tumor serums and normal serums for the methylation of all six genes, including RASSF1A (the overall OR = 83.81, 95% CI = 47.35–148.36, p < 0.00001), p16 (the overall OR = 123.15, 95% CI = 49.12–308.74, p < 0.00001), CDH1 (the overall OR = 23.70, 95% CI = 5.39–104.28, p < 0.0001), RUNX3 (the overall OR = 103.92, 95% CI = 16.33–661.45, p < 0.00001), GSTP1 (the overall OR = 21.09, 95% CI = 4.02–110.65, p = 0.0003) and WIF1 (the overall OR = 53.65, 95% CI = 10.62–271.09, p < 0.00001).
In this meta-analysis, we selected geographical populations to analyze sources of heterogeneity. We found that there was significant difference in RASSF1A and GSTP1 between HCC tumor tissues and normal tissues in Japan (p = 0.041) and America (p = 0.021) respectively (Supplementary Table S2). However, there was no significance in other genes between HCC tumor tissues and normal tissues in geographical populations (Supplementary Table S2). In addition, we didn’t find any significance in 24 methylated genes between HCC tumor tissues and adjacent tissues (Supplementary Table S1) and six methylated genes between HCC tumor serums and normal serums (Supplementary Table S3) in geographical populations. Our meta-analysis indicated that the heterogeneity was not contributed by geographical populations, except RASSF1A and GSTP1 between HCC tumor tissues and normal tissues in Japan and America respectively.
Subgroup meta-analysis by geographical populations was performed for p16, RASSF1A, GSTP1, APC, RUNX3, SOCS1 and PRDM2 between HCC tumor tissues and adjacent tissues. As shown in Figure 3, we found a statistical difference between HCC tumor tissues and adjacent tissues for p16 methylation in China from 28 studies (OR = 4.88, 95% CI = 3.50–6.81, I2 = 66%, p < 0.00001) and in Japan from 6 studies (OR = 8.43, 95% CI = 3.71–19.19, I2 = 68%, p < 0.00001), but not in Germany from 3 studies (p = 0.12, I2 = 86%). In addition, there was a significant geographical difference in the meta-analysis of RASSF1A gene in China (OR = 6.07, 95% CI = 4.18–8.80, I2 = 57%, p < 0.00001) and Japan (OR = 18.52, 95% CI = 2.30–149.14, I2 = 72%, p = 0.006, Figure 3). The same consequence was also found in the other four genes including GSTP1 (China: OR = 5.12, 95% CI = 3.89–6.73, I2 = 7%, p < 0.00001; Japan: OR = 15.06, 95% CI = 8.59–26.40, I2 = 18%, p < 0.00001), APC (China: OR = 4.88, 95% CI = 3.63–6.56, I2 = 34%, p < 0.00001; Japan: OR = 11.32, 95% CI = 1.97–64.94, I2 = 89%, p = 0.006), RUNX3 (China: OR = 24.10, 95% CI = 9.00–64.52, I2 = 75%, p < 0.00001; Japan: OR = 15.11, 95% CI = 4.46–51.24, I2 = 62%, p < 0.0001) and PRDM2 (China: OR = 9.77, 95% CI = 6.01–15.88, I2 = 38%, p < 0.00001; Japan: OR = 20.24, 95% CI = 10.80–37.95, I2 = 47%, p < 0.00001)(Figure 4). The subgroup meta-analysis of SOCS1 was unable to observe any significant result in each geographical population (Supplementary Figure S1).
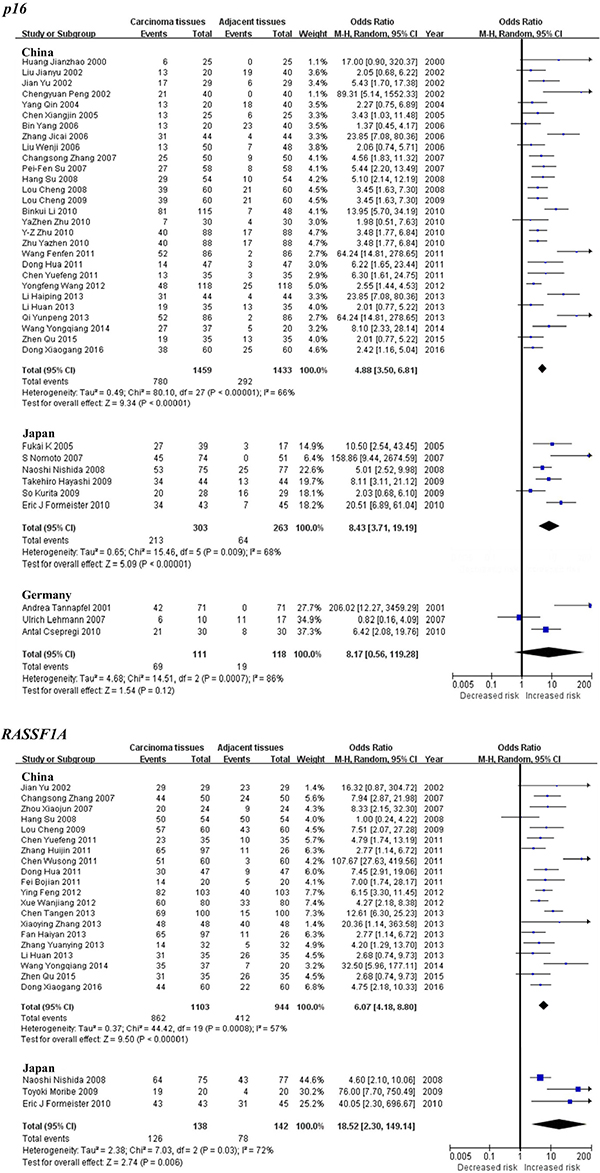
Figure 3: Forest plots of p16 and RASSF1A methylation between HCC tumor tissues and adjacent tissues in the meta-analysis.
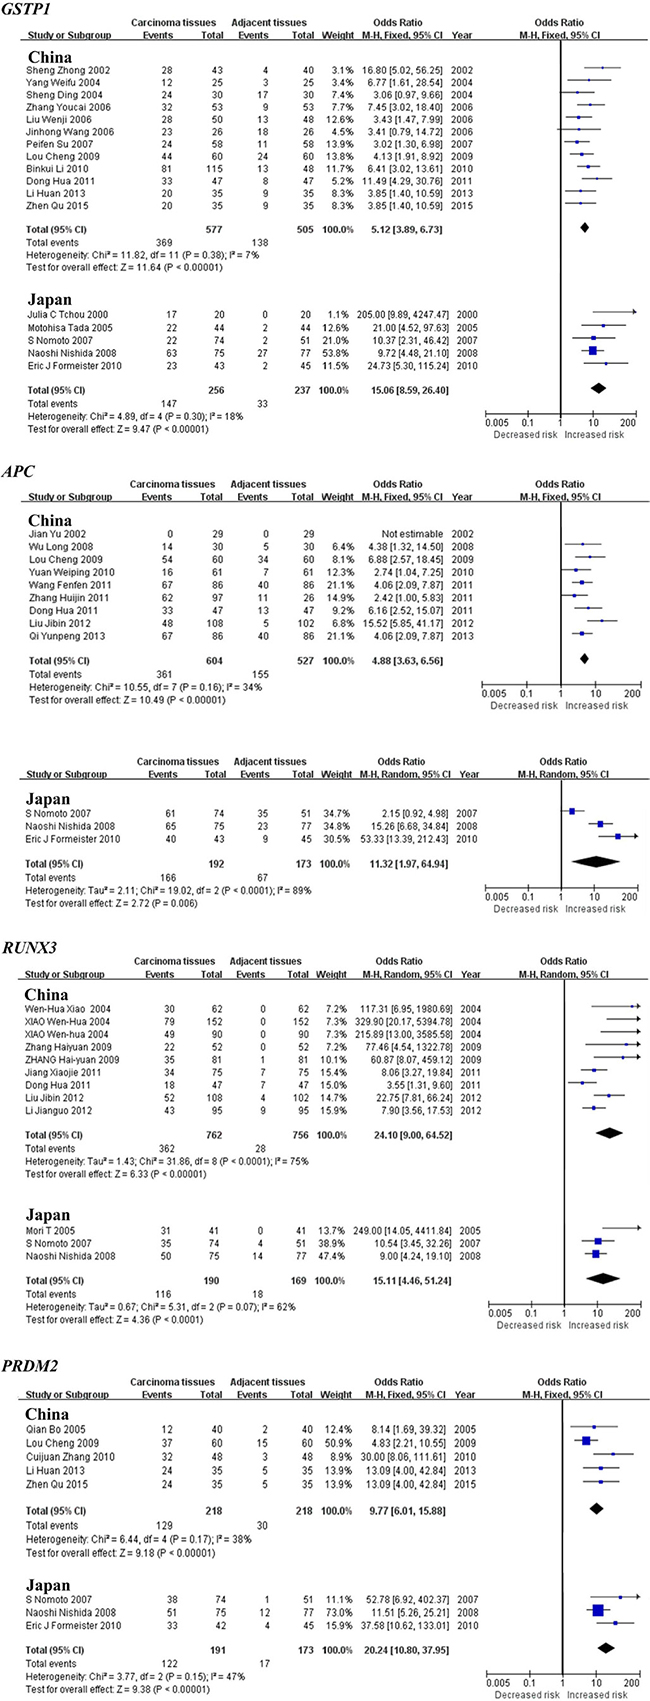
Figure 4: Forest plots of GSTP1, APC, RUNX3 and PRDM2 methylation between HCC tumor tissues and adjacent tissues in the meta-analysis.
The subgroup meta-analysis by geographical populations was also performed for p16, APC, RUNX3 and PRDM2 between HCC tumor tissues and normal tissues. As shown in Figure 5, we found a statistical difference between HCC tumor tissues and normal tissues for p16 methylation in China from 15 studies (OR = 21.31, 95% CI = 11.10–40.94, I2 = 0%, p < 0.00001), in Japan from 6 studies (OR = 9.20, 95% CI = 4.58–18.51, I2 = 0%, p < 0.00001) and in Germany from 3 studies (OR = 30.43, 95% CI = 7.32–126.41, I2 = 41%, p < 0.00001). The same consequence was also found in the other two genes including RUNX3 (China: OR = 22.22, 95% CI = 5.36–92.12, I2 = 0%, p < 0.0001; Japan: OR = 53.40, 95% CI = 13.03–218.85, I2 = 36%, p < 0.00001) and PRDM2 (China: OR = 30.54, 95% CI = 7.33–127.34, I2 = 23%, p < 0.00001; Japan: OR = 33.16, 95% CI = 8.97–122.59, I2 = 0%, p < 0.00001)(Figure 5). In addition, there was a significant geographical difference in the meta-analysis of APC gene in China (OR = 43.92, 95% CI = 12.13–159.06, I2 = 0%, p < 0.00001) but not in Japan (OR = 9.96, 95% CI = 0.64–155.15, I2 = 88%, p = 0.10, Figure 5).
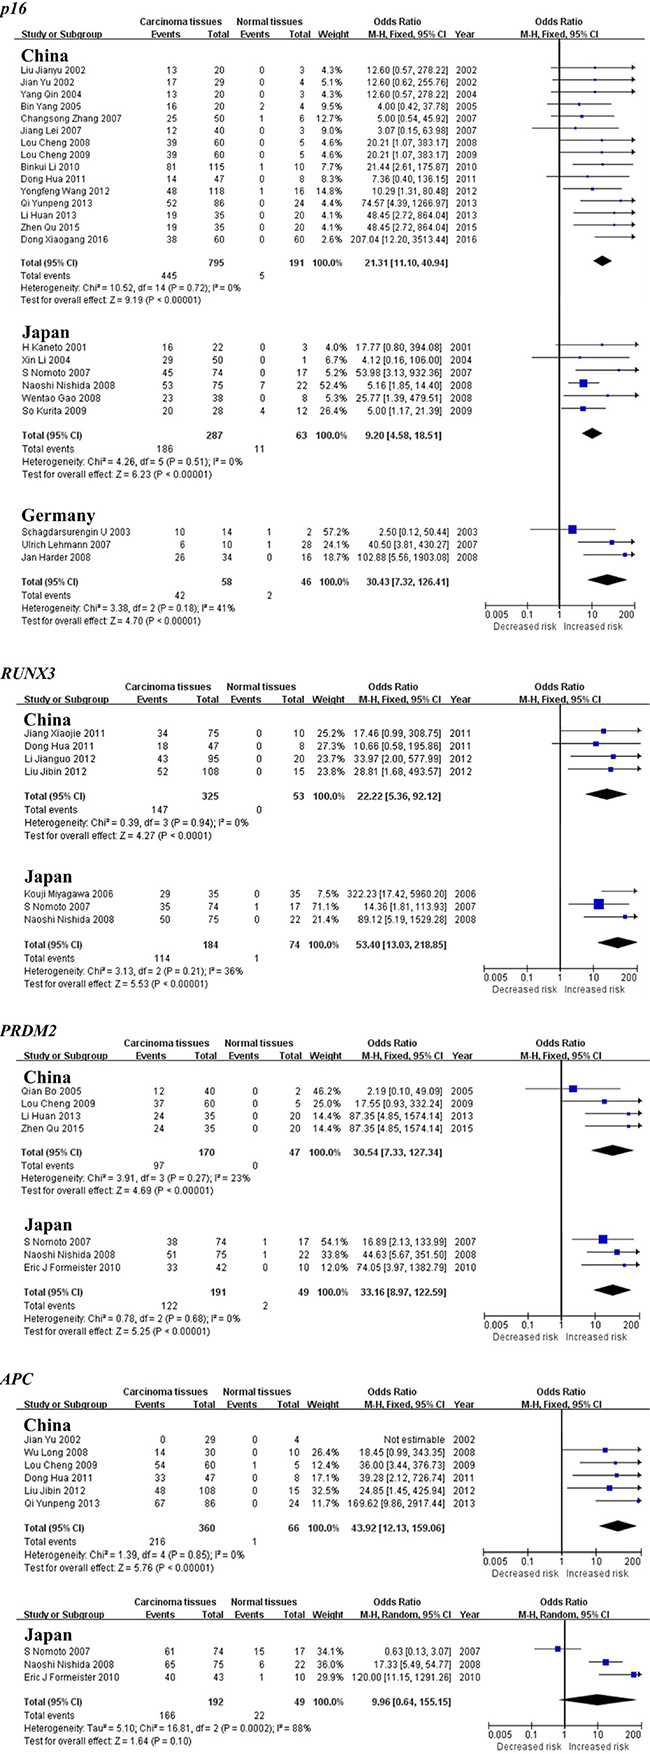
Figure 5: Forest plots of p16, RUNX3, PRDM2 and APC methylation between HCC tumor tissues and normal tissues in the meta-analysis.
DISCUSSION
Our meta-analysis has included a large amount of studies that evaluated the contribution of aberrant DNA methylation to the risk of HCC. The meta-analysis mainly focused on 24 tumor suppressor genes between HCC tumor tissues and adjacent tissues, 17 tumor suppressor genes between HCC tumor tissues and normal tissues and six tumor suppressor genes between HCC serums and normal serums (≥3 studies per gene). 20 HCC-associated genes (p16, RASSF1A, GSTP1, p14, APC, RUNX3, SOCS1, CDH1, p15, WIF1, PRDM2, SFRP1, RARβ, p73, hMLH1, DLC1, p53, SPINT2, OPCML and WT1) hypermethylation showed significant evidences between HCC tumor tissues and adjacent tissues to the risk of HCC. 15 HCC-associated genes (p16, RASSF1A, APC, GSTP1, CDH1, p15, RUNX3, SOCS1, MGMT, SFRP1, PRDM2, DAPK1, p14, RARβ and p73) hypermethylation showed significant evidences between HCC tumor tissues and normal tissues to the risk of HCC. Six HCC-associated genes (RASSF1A, p16, CDH1, RUNX3, GSTP1 and WIF1) hypermethylation showed significant evidences between HCC serums and normal serums to the risk of HCC.
This meta-analysis showed that methylation of p16, RASSF1A, APC, GSTP1, CDH1, p15, RUNX3, SOCS1, SFRP1, PRDM2, p14, RARβ and p73 genes in HCC tumor tissues was significantly higher than both adjacent tissues and normal tissues, revealing that the number of hepatic cells with these methylated genes may increase significantly in hepatocarcinogenesis process from normal liver to adjacent liver and HCC. In addition, methylation of MGMT and DAPK1 genes in HCC tumor tissues was significantly higher than normal tissues but not adjacent tissues, revealing that methylation of two genes may play a significant role in the early stage of hepatocarcinogenesis process. However, methylation of IGF2 gene in HCC tumor tissues was not significantly higher than neither adjacent tissues nor normal tissues, revealing that methylation of IGF2 gene didn’t play a significant role during the hepatocarcinogenesis process.
Subgroup meta-analysis by geographical populations found that RASSF1A, GSTP1, APC, RUNX3 and PRDM2 hypermethylation was a common risk factor between HCC tumor tissues and adjacent tissues in HCC patients, however, the statistical significance of p16 hypermethylation was only found in China and Japan, but not in Germany. In addition, we found that subgroup meta-analysis by geographical populations showed p16, RUNX3 and PRDM2 hypermethylation was a common risk factor between HCC tumor tissues and normal tissues in HCC patients. However, the statistical significance of APC hypermethylation was only found in China but not in Japan. The effects of p16 hypermethylation on China, Japan and Germany, and APC hypermethylation on China and Japan are different, due to the diversities of hereditary, alcohol consumption and hepatitis virus infection in the different geographic regions [4, 19, 20]. Our results suggested that aberrant DNA methylation might become useful biomarkers in the early diagnosis of HCC.
On the other hand, some meta-analyses showed that global DNA hypomethylation in peripheral blood leukocytes may be a promising biomarker for cancer risk [21]. The association between global DNA methylation and cancer risk may depend on different factors, such as cancer and sample types [22]. For example, Barchitta found that LINE-1 methylation, a representative biomarker for global DNA methylation, increased significantly in colorectal carcinoma and gastric carcinoma, but not hepatocellular carcinoma. In addition, the significant difference in methylation levels was confirmed in tissue samples, but not in blood samples [22]. However, our meta-analysis showed that methylation of four genes (RASSF1A, p16, CDH1 and RUNX3) in both tissue and serum samples were significantly different for the risk of HCC.
Aberrant gene methylation is recognized as one of the main mechanisms of triggering HCC [23], and it may serve as a useful biomarker for the prediction of HCC risk. The silencing of tumor suppressor genes by hypermethylation in the promoter regions also contributed to HCC progression [24]. For example, RASSF1A promoter methylation may conduce to the loss of RASSF1A expression, thereby leading to the silencing of RASSF1A gene and decrease of its function, which is one of the most common early events in HCC [25]. The same phenomenon occurred in many other genes, such as p16, GSTP1, APC, RUNX3, SOCS1, WIF1, p73, hMLH1, DLC1, OPCML and WT1 [18, 26–33]. The frequencies of methylation of these gene promoters were significant higher in HCC than in nonneoplastic liver tissues and normal liver tissues. In addition, Feng revealed that HOXA9, RASSF1 and SFRP1 were more frequently methylated in HBV-positive HCC cases, while CDKN2A were significantly more frequently methylated in HCV-positive HCC cases, suggesting that methylation of these gene promoters may be involved in virus-induced hepatocarcinogenesis [34].
The present meta-analysis has several limitations that need to be taken with the following cautions. First, the selection bias is inevitable due to the search strategy restricted to the articles published in English or Chinese. Secondly, the heterogeneity existed in 15 genes between HCC tumor tissues and adjacent tissues and five genes between HCC tumor tissues and normal tissues. This phenomenon may be caused by the moderate number of samples in the involved studies and the inconsistent criteria in the selection of controls. We expect a larger size of samples to be tested in the future for a more reliable conclusion. Thirdly, our meta-analysis focused on the genes with at least three independent studies, and this might prevent those genes reported in two large studies from being included in the current meta-analysis. Finally, the status of DNA methylation was qualitative (M+ or M−) in all the selected studies that were performed with methylation specific PCR (MSP). The tested CpG sites might not stand for the whole promoter regions.
In summary, our meta-analysis indicated that aberrant DNA methylation was associated with the risk of HCC. Aberrant DNA methylation might become useful biomarkers for the prediction and prognostication of HCC.
MATERIALS AND METHODS
Study identification
We conducted a comprehensive systematic literature via PubMed, Web of Science, Cochrane Library, Embase, CNKI and Wanfang using the “hepatocellular carcinoma or hepatocarcinoma or primary liver cancer or HCC or hepatic carcinoma or liver tumor” and “DNA methylation” as keywords in titles and abstracts. The search was updated until September 1, 2016. The search was limited to the articles published in English and Chinese. A preliminary review of abstracts was conducted to determine the relevance on methylation study. Studies were selected if they met the following criteria: (1) they were the case-control associations of gene methylation with the risk of HCC in humans; (2) they had the sufficient methylation informations to calculate the odds ratios (ORs) and 95 % confidence intervals (CIs) for the meta-analysis. We excluded the studies such as letters, reviews, abstracts and conference articles. Studies with non case-control or no methylation frequency data were also removed from the meta-analysis. Furthermore, we excluded the genes with the number of articles less than 3. The selection process of the included studies was shown in the flow chart of Figure 1.
Data extraction and quality assessment
All the literatures and data included in the meta-analysis were retrieved and extracted independently by five authors (CZ, JL, TH, DD and DJ) to improve subjective bias, and any discrepancy was checked again and resolved through discussion. For each eligible article, we extracted the following information: first author’s name, publication year, geographical populations, the numbers of cases and controls.
Quality assessment was performed by three authors (CZ, XS and DL) independently and any disagreement was discussed with the fourth author (KW). Due to the observational study design of the included studies, the Newcastle-Ottawa Scale was used to assess the methodological quality of the included studies. It assessed the selection, comparability and exposure of a case-control study.
Meta-analysis
The Review Manager software (version 5.0, Cochrane Collaboration, Oxford, UK) and STATA (version 10.0 Stata Corporation College Station, TX) were used for the current meta-analysis. The combined ORs and the corresponding 95% CIs were calculated and computed in the forest plots for each gene to evaluate the contribution of its DNA methylation to the risk of HCC. A fixed-effect model was applied for the meta-analysis with the moderate heterogeneity (I2 < 50%), otherwise a random-effect model was used. Funnel plots were used to check whether there was an obvious publication bias among the involved studies. P values less than 0.05 were considered to be significant.
Abbreviations
HCC: Hepatocellular carcinoma; CNKI: China National Knowledge Infrastructure; OR: Odds ratio; CI: Confidence interval; RASSF1A: Ras association domain family member1A; GSTP1: Glutathione S-transferase pi 1; APC: Adenomatous polyposis coli; RUNX3: Runt-related transcription factor 3; SOCS1: Suppressor of the cytokine signalling 1; MGMT: O6-methylguanine-DNA methyltransferase; WIF1: WNT inhibitory factor 1; PRDM2: PR domain containing 2; SFRP1: Secreted frizzled-related protein 1; RARβ: Retinoic acid receptor beta; hMLH1: Human MutL homolog 1; DLC1: Deleted in liver cancer 1; SPINT2: Serine peptidase inhibitor, Kunitz type, 2; OPCML: Opioid binding protein/cell adhesion molecule-like; WT1: Wilms tumor 1.
ACKNOWLEDGMENTS
This work was supported by the grants from: National Natural Science Foundation of China (31100919, 81301891 and 81371469), Natural Science Foundation of Zhejiang Province (LY15H160015), the Specialized Research Fund for the Social Development of Hangzhou (20160533B21) and the Scientific Innovation Fund of the Affiliated Hospital of Hangzhou Normal University.
CONFLICTS OF INTEREST
The authors have declared that no competing interests exist.
Authors contributions
CZ, GC and KW conceived and designed the research. CZ, JL, TH, DD and DJ analyzed the data. All authors made substantial contributions towards drafting the manuscript, reviewed the final manuscript for intellectual content, and authorized the submission. All authors read and approved the final manuscript.
REFERENCES
1. Siegel RL, Miller KD, Jemal A. Cancer statistics, 2015. CA Cancer J Clin. 2015; 65:5–29.
2. Clifford RJ, Zhang J, Meerzaman DM, Lyu MS, Hu Y, Cultraro CM, Finney RP, Kelley JM, Efroni S, Greenblum SI, Nguyen CV, Rowe WL, Sharma S, et al. Genetic variations at loci involved in the immune response are risk factors for hepatocellular carcinoma. Hepatology. 2010; 52:2034–2043.
3. Tian Y, Yang W, Song J, Wu Y, Ni B. Hepatitis B virus X protein-induced aberrant epigenetic modifications contributing to human hepatocellular carcinoma pathogenesis. Mol Cell Biol. 2013; 33:2810–2816.
4. Arzumanyan A, Reis HM, Feitelson MA. Pathogenic mechanisms in HBV- and HCV-associated hepatocellular carcinoma. Nat Rev Cancer. 2013; 13:123–135.
5. Liu Y, Chang CC, Marsh GM, Wu F. Population attributable risk of aflatoxin-related liver cancer: systematic review and meta-analysis. Eur J Cancer. 2012; 48:2125–2136.
6. Suh B, Yun JM, Park S, Shin DW, Lee TH, Yang HK, Ahn E, Lee H, Park JH, Cho B. Prediction of future hepatocellular carcinoma incidence in moderate to heavy alcohol drinkers with the FIB-4 liver fibrosis index. Cancer. 2015; 121:3818–3825.
7. Lambert MP, Paliwal A, Vaissiere T, Chemin I, Zoulim F, Tommasino M, Hainaut P, Sylla B, Scoazec JY, Tost J, Herceg Z. Aberrant DNA methylation distinguishes hepatocellular carcinoma associated with HBV and HCV infection and alcohol intake. J Hepatol. 2011; 54:705–715.
8. Hellman A, Chess A. Gene body-specific methylation on the active X chromosome. Science. 2007; 315:1141–1143.
9. Jones PA. Functions of DNA methylation: islands, start sites, gene bodies and beyond. Nat Rev Genet. 2012; 13:484–492.
10. Heyn H, Sayols S, Moutinho C, Vidal E, Sanchez-Mut JV, Stefansson OA, Nadal E, Moran S, Eyfjord JE, Gonzalez-Suarez E, Pujana MA, Esteller M. Linkage of DNA methylation quantitative trait loci to human cancer risk. Cell Rep. 2014; 7:331–338.
11. Jiang D, Hong Q, Shen Y, Xu Y, Zhu H, Li Y, Xu C, Ouyang G, Duan S. The diagnostic value of DNA methylation in leukemia: a systematic review and meta-analysis. PLoS One. 2014; 9:e96822.
12. Lange CP, Laird PW. Clinical applications of DNA methylation biomarkers in colorectal cancer. Epigenomics 2013, 5:105–108.
13. Tessema M, Yu YY, Stidley CA, Machida EO, Schuebel KE, Baylin SB, Belinsky SA. Concomitant promoter methylation of multiple genes in lung adenocarcinomas from current, former and never smokers. Carcinogenesis. 2009; 30:1132–1138.
14. Shimazu T, Asada K, Charvat H, Kusano C, Otake Y, Kakugawa Y, Watanabe H, Gotoda T, Ushijima T, Tsugane S. Association of gastric cancer risk factors with DNA methylation levels in gastric mucosa of healthy Japanese: a cross-sectional study. Carcinogenesis. 2015; 36:1291–1298.
15. Lee BB, Lee EJ, Jung EH, Chun HK, Chang DK, Song SY, Park J, Kim DH. Aberrant methylation of APC, MGMT, RASSF2A, and Wif-1 genes in plasma as a biomarker for early detection of colorectal cancer. Clin Cancer Res. 2009; 15:6185–6191.
16. Richards KL, Zhang B, Sun M, Dong W, Churchill J, Bachinski LL, Wilson CD, Baggerly KA, Yin G, Hayes DN, Wistuba II, Krahe R. Methylation of the candidate biomarker TCF21 is very frequent across a spectrum of early-stage nonsmall cell lung cancers. Cancer. 2011; 117:606–617.
17. Nishida N, Nagasaka T, Nishimura T, Ikai I, Boland CR, Goel A. Aberrant methylation of multiple tumor suppressor genes in aging liver, chronic hepatitis, and hepatocellular carcinoma. Hepatology. 2008; 47:908–918.
18. Nishida N, Kudo M, Nagasaka T, Ikai I, Goel A. Characteristic patterns of altered DNA methylation predict emergence of human hepatocellular carcinoma. Hepatology. 2012; 56:994–1003.
19. El-Serag HB, Rudolph KL. Hepatocellular carcinoma: epidemiology and molecular carcinogenesis. Gastroenterology. 2007; 132:2557–2576.
20. Morgan TR, Mandayam S, Jamal MM. Alcohol and hepatocellular carcinoma. Gastroenterology. 2004; 127:S87–96.
21. Woo HD, Kim J. Global DNA hypomethylation in peripheral blood leukocytes as a biomarker for cancer risk: a meta-analysis. PLoS One. 2012; 7:e34615.
22. Barchitta M, Quattrocchi A, Maugeri A, VinciguerraM, Agodi A. LINE-1 hypomethylation in blood and tissue samples as an epigenetic marker for cancer risk: a systematic review and meta-analysis. PLoS One. 2014; 9:e109478.
23. Nishida N, Nishimura T, Nagasaka T, Ikai I, Goel A, Boland CR. Extensive methylation is associated with beta-catenin mutations in hepatocellular carcinoma: evidence for two distinct pathways of human hepatocarcinogenesis. Cancer Res. 2007; 67:4586–4594.
24. Ling Y, Zhu J, Gao L, Liu Y, Zhu C, Li R, Wei L, Zhang C. The silence of MUC2 mRNA induced by promoter hypermethylation associated with HBV in Hepatocellular Carcinoma. BMC Med Genet. 2013; 14:14.
25. Huang ZH, Hu Y, Hua D, Wu YY, Song MX, Cheng ZH. Quantitative analysis of multiple methylated genes in plasma for the diagnosis and prognosis of hepatocellular carcinoma. Exp Mol Pathol. 2011; 91:702–707.
26. Song MA, Tiirikainen M, Kwee S, Okimoto G, Yu H, Wong LL. Elucidating the landscape of aberrant DNA methylation in hepatocellular carcinoma. PLoS One. 2013; 8:e55761.
27. Wang ZK, Liu J, Liu C, Wang FY, Chen CY, Zhang XH. Hypermethylation of adenomatous polyposis coli gene promoter is associated with novel Wnt signaling pathway in gastric adenomas. J Gastroenterol Hepatol. 2012; 27:1629–1634.
28. Kim WJ, Kim EJ, Jeong P, Quan C, Kim J, Li QL, Yang JO, Ito Y, Bae SC. RUNX3 inactivation by point mutations and aberrant DNA methylation in bladder tumors. Cancer Res. 2005; 65:9347–9354.
29. Yoshikawa H, Matsubara K, Qian GS, Jackson P, Groopman JD, Manning JE, Harris CC, Herman JG. SOCS-1, a negative regulator of the JAK/STAT pathway, is silenced by methylation in human hepatocellular carcinoma and shows growth-suppression activity. Nat Genet. 2001; 28:29–35.
30. Huang L, Li MX, Wang L, Li BK, Chen GH, He LR, XuL, Yuan YF. Prognostic value of Wnt inhibitory factor-1 expression in hepatocellular carcinoma that is independent of gene methylation. Tumour Biol. 2011; 32:233–240.
31. Li B, Liu W, Wang L, Li M, Wang J, Huang L, Huang P, Yuan Y. CpG island methylator phenotype associated with tumor recurrence in tumor-node-metastasis stage I hepatocellular carcinoma. Ann Surg Oncol. 2010; 17:1917–1926.
32. Wong CM, Lee JM, Ching YP, Jin DY, Ng IO. Genetic and epigenetic alterations of DLC-1 gene in hepatocellular carcinoma. Cancer Res. 2003; 63:7646–7651.
33. Yu J, Zhang HY, Ma ZZ, Lu W, Wang YF, Zhu JD. Methylation profiling of twenty four genes and the concordant methylation behaviours of nineteen genes that may contribute to hepatocellular carcinogenesis. Cell Res. 2003; 13:319–333.
34. Feng Q, Stern JE, Hawes SE, Lu H, Jiang M, Kiviat NB. DNA methylation changes in normal liver tissues and hepatocellular carcinoma with different viral infection. Exp Mol Pathol. 2010; 88:287–292.