
INTRODUCTION
Tumor-infiltrating immune cells can influence tumor progression and metastasis. While one of their functions is recognition and elimination of tumor cells [1], they have also been reported to promote immune evasion by tumor cells and, eventually, metastasis [2–4]. Recent reports suggest that tumor-infiltrating lymphocytes (TILs) have an important role in boosting anti-tumor immunity against CRC [5–9] and other malignancies [10–15]. However, like other components of the tumor microenvironment, TILs display heterogeneity in their target site [8, 16]. This heterogeneity causes difficulties in determining their roles.
Recently, several studies have demonstrated that TILs have high prognostic utility. Galon et al. introduced the ‘immunoscore (IS)’, a value based on the density of CD3+ and CD8+ lymphocytes in the tumor center (CT) and invasive margin (IM) [17–19]. Moreover, some authors have reported that the IS method is superior to the current tumor-node-metastases (TNM) staging system, especially in colon cancers [20, 21]. However, the evidence is limited to stages I–III of the disease [18, 22].
Tumor-associated macrophages (TAMs) are another component of tumor-infiltrating immune cells. Macrophages are derived from monocytes and exhibit two polarization states in response to different microenvironmental signals–M1 and M2 [23–25]. M1 macrophages are pro-inflammatory and function as bactericides and antigen-presenting cells. M2 macrophages have an immunosuppressive phenotype. Several studies have revealed that M2 macrophage infiltration is associated with unfavorable outcomes in patients with CRC [26–29]. However, other studies have revealed that high infiltration by M1 as well as M2 macrophages is correlated with good prognosis [30]. Therefore, the prognostic utility of TAMs remains unclear.
The aim of this study was to confirm the prognostic value of the IS in patients with advanced CRC. The characteristics of tumor infiltrating immune cells was also determined. Additionally the heterogeneity in the target sites of tumor-infiltrating immune cells in patients with advanced CRC was evaluated.
RESULTS
The heterogeneous density of tumor infiltrating immune cells according to tumor location
Representative results of immunohistochemistry for tumor infiltrating immune cells are shown in Figure 1. The cell count per area (cells/mm2) of CD3+ lymphocyte was the highest in the IM (median, interquartile range (IQR); 389.15, 246.95–649.42) than any other site (297.79, 154.13–516.33 at the CT; 76.27, 28.04–204.55 at the DM). The density of CD8+ lymphocytes was lower in the CT (112.24, 48.42–232.98) than the IM (293.20, 177.85–504.41) and the DM (235.68, 91.52–648.20). The pixel count per area (pixels/mm2) of CD68+ macrophages was the highest in the DM (500631.05, 318786.38–844905.83). Similarly, CD163-positive macrophages were more frequently infiltrating in the DM (160636.11, 85120.41–283752.28) than any other site. All tumor-infiltrating immune cells except FOXP3+ lymphocytes presented a heterogeneous density according to tumor location (Figure 2). The comprehensive median and IQR values of the density of each tumor’s microenvironmental factors are described in Table 1 .
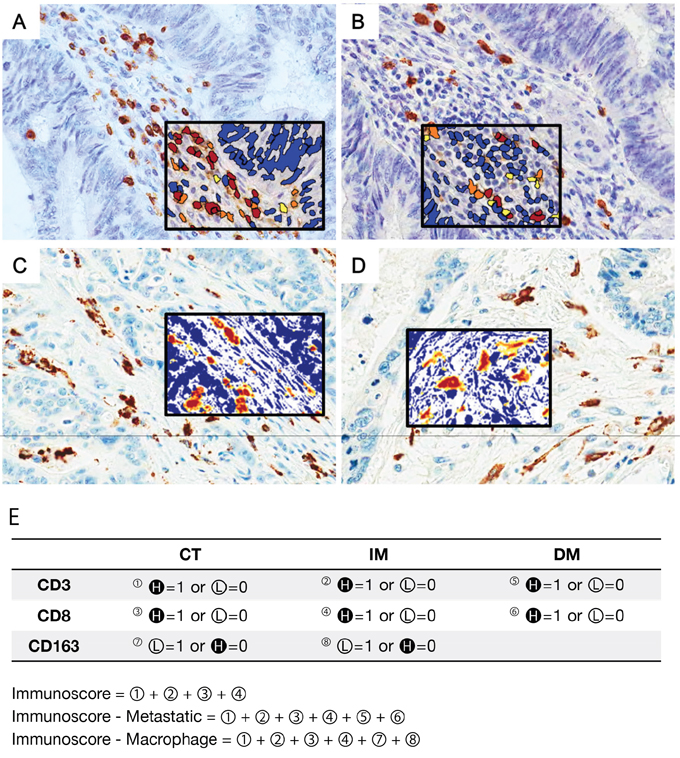
Figure 1: Representative figures of immunohistochemistry for tumor-infiltrating immune cells (×400) and schematic description of the immunoscore (IS) model. Tumor-infiltrating lymphocytes (TILs) were stained with CD3 (A) and CD8 (B) antibodies. Tumor-associated macrophages (TAMs) were confirmed using CD68 (C) and CD163 (D) antibodies. The density of each subset of immune cells was counted by an image analysis system. The black squared inset presents the results of image analysis. The immunostained area is shown in red, and the non-immunostained area is shown in blue. E. The IS model is based on the enumeration of two lymphocyte subsets (CD3 and CD8) in the CT and IM of the primary tumor. All patients were grouped into high-density (H in dark circle) and low-density (L in light circle) groups for each marker in each region. The IS-metastatic (IS-M) model additionally includes lymphocyte density data in distant metastases. In the IS-macrophage (IS-ma) model, data of CD163+ macrophage density in the CT and IM were added. Because our data showed that TAMs had an opposite prognostic correlation compared to that of TILs, a low density of TAMs and a high density of TILs was recorded as a score.
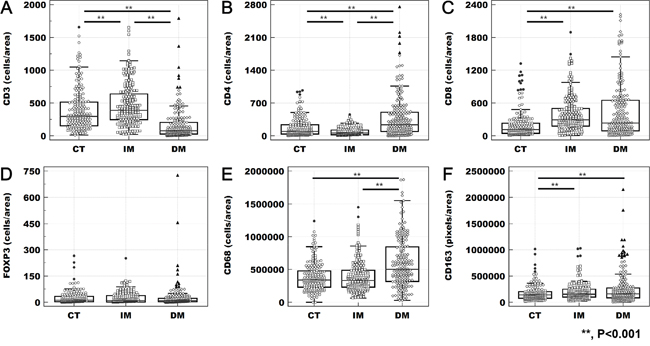
Figure 2: Heterogeneity of tumor-infiltrating immune cells. The density of CD3+ (A), CD4+ (B), CD8+ (C), CD68+ (E), and CD163+ (F) cells differed significantly according to tumor location (**; p < 0.001 in the results of the paired t-test). However, the density of FOXP3+ lymphocytes (D) did not present heterogeneity according to tumor location.
Table 1: The median, IQR, and cut-off values of the tumor-infiltrating immune cells
Median |
IQR |
Cut-off value |
||
|---|---|---|---|---|
CD3 |
Tumor center |
297.79 |
154.13 - 516.33 |
158.52 |
Invasive margin |
389.15 |
246.95 - 649.42 |
321.15 |
|
Distant metastasis |
76.27 |
28.04 - 204.55 |
272.23 |
|
CD4 |
Tumor center |
98.01 |
38.30 - 241.05 |
22.88 |
Invasive margin |
59.01 |
24.03 - 124.82 |
82.25 |
|
Distant metastasis |
238.52 |
94.42 - 506.93 |
52.61 |
|
CD8 |
Tumor center |
112.24 |
48.42 - 232.98 |
310.10 |
Invasive margin |
293.20 |
177.85 - 504.41 |
164.67 |
|
Distant metastasis |
235.68 |
91.52 - 648.20 |
98.92 |
|
FOXP3 |
Tumor center |
11.67 |
2.92 - 33.33 |
6.37 |
Invasive margin |
9.58 |
2.52 - 38.26 |
0.71 |
|
Distant metastasis |
9.36 |
2.72 - 23.27 |
33.69 |
|
CD68 |
Tumor center |
340080.87 |
229761.65 - 480635.88 |
623734.20 |
Invasive margin |
330204.65 |
233509.22 - 485385.06 |
278123.90 |
|
Distant metastasis |
500631.05 |
318786.38 - 844905.83 |
488839.60 |
|
CD163 |
Tumor center |
138787.44 |
80061.73 - 201969.89 |
328155.00 |
Invasive margin |
153225.53 |
100686.21 - 250086.39 |
230371.20 |
|
Distant metastasis |
160636.11 |
85120.41 – 273752.28 |
53170.20 |
The density of each tumor-infiltrating immune cell was varies in relation to the organ of metastasis (Figure 3). CD3+, CD4+, and CD8+ lymphocytes are denser in metastatic non-regional lymph node than in any other metastatic site. However, FOXP3+ lymphocytes are observed more frequently in lung metastases than in distant metastatic lymph nodes. All marker-positive immune cells had the lowest density in the ovary.
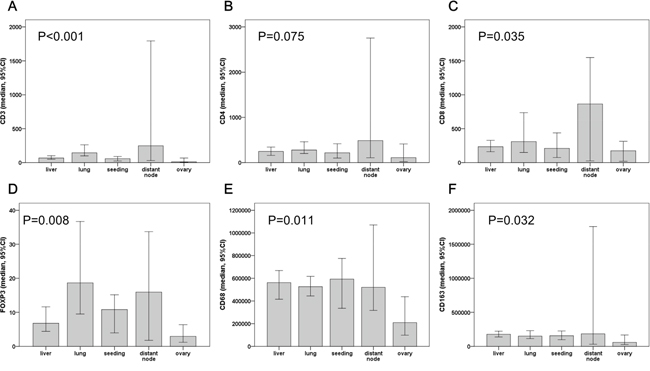
Figure 3: The density of tumor infiltrating immune cells at different distant metastasis sites. CD3+ (A), CD4+ (B) and CD8+ (C) lymphocytes were more frequently observed in non-regional lymph nodes. However, FOXP3+ lymphocytes (D) were higher in lung metastases than in distant lymph nodes. Including CD68+ (E) and CD163+ (F) macrophages, all tumor-infiltrating immune cells have the lowest density in ovary metastases.
Prognostic correlation of tumor-infiltrating immune cells in advanced CRCs
We divided the patients into low and high groups by the predetermined cut-off values of the continuous variables using maximal chi square method according to each immune cell marker in each tumor location. The Kaplan-Meier method revealed that a low density of CD3+ lymphocytes in the CT and the DM was statistically associated with a poor outcome (p = 0.030 and p = 0.013, respectively). A low density of CD4+ lymphocytes in the CT and IM was also related to a poor outcome (p = 0.001 and p = 0.018, respectively). In contrast, there was an association between CD8+ and FOXP3+ lymphocytes in the DM and patient worse outcome (p = 0.002 and p = 0.008, CD8 and FOXP3 respectively). The patients presenting with a high density of CD68+ and CD163+ macrophages in the CT of their primary tumor had significantly worse outcomes. Additional data on the median survival time and comparisons between patient groups according to immune cell markers and respective tumor location are listed in Supplementary Table 1.
Application of immunoscore and their clinical implications in advanced CRCs
Through the assembled density data, we evaluated the patients with the IS system, which gives a score depending on the total number of high densities marked (from IS0 to IS4). Owing to loss of tissue microarray (TMA) core tissue, IS results were available for only 193 of 196 patients. According to the IS, 49.7% (96/193) was recorded as a low IS (IS0: 5.7%, IS1: 19.7% and IS2: 24.4%) and 50.3% (96/193) was a high IS (IS3: 43.0% and IS4: 7.3%).
In the present study, we used two additional scoring models that incorporate the results of macrophage infiltration into the primary tumor (IS-macrophage, IS-ma) and lymphocyte infiltrates into distant metastases (IS-metastatic, IS-M). IS-ma and IS-M results were available in 193 and 188 patients, respectively. Seventy five (38.9%) patients were low IS-ma (IS-ma0: 0%, IS-ma1: 1.0%, IS-ma2: 10.9%, and IS-ma3: 26.9%) and 118 (61.1%) patients presented with a high IS-ma (IS-ma4: 28.0%, IS-ma5: 29.0%, and IS-ma6: 4.1%). Of 188 patients, 53.2% (100/188) had low IS-M (IS-M0: 3.2%, IS-M1: 10.6%, IS-M2: 16.0%, and IS-M3: 23.4%) and 46.8% (88/100) had high IS-M (IS-M4: 33.5%, IS-M5: 10.6%, and IS-M6: 2.7%).
When the IS was compared to the patient’s clinicopathologic features, higher pT stage (p = 0.001) and the presence of perineural invasion (p = 0.008) were significantly correlated with lower IS (Table 2). Lower IS-ma was associated with higher pT stage (p = 0.004) and synchronous metastasis (p = 0.007). Lower IS-M was also correlated with aggressive clinicopathological features, including higher pT stage (p < 0.001), lymphatic invasion (p = 0.003), and perineural invasion (p = 0.004).
Table 2: Clinicopathologic factors and tumor-infiltrating immune cells
Characteristics |
Immunoscore |
Immunoscore-macrophage |
Immunoscore-metastatic |
||||||
|---|---|---|---|---|---|---|---|---|---|
Low (0-2) (%) |
High (3-4) (%) |
P |
Low (0-3) (%) |
High (4-6) (%) |
P |
Low (0-3) (%) |
High (4-6) (%) |
P |
|
Age (mean±SD) |
60.41±1.33 |
59.38±1.19 |
0.459 |
60.89±1.52 |
59.25±1.09 |
0.308 |
60.11±1.31 |
59.66±1.20 |
0.801 |
Gender |
0.666 |
0.767 |
0.559 |
||||||
Male |
50 (52.1) |
54 (55.7) |
39 (52.0) |
65 (55.1) |
52 (52.0) |
50 (56.8) |
|||
Female |
46 (47.9) |
43 (44.3) |
36 (48.0) |
53 (44.9) |
48 (48.0) |
38 (43.2) |
|||
pT stage |
0.001 |
0.004 |
<0.001 |
||||||
pT1-3 |
47 (49.0) |
71 (73.2) |
36 (48.0) |
82 (69.5) |
49 (49.0) |
65 (73.9) |
|||
pT4 |
49 (51.0) |
26 (26.8) |
39 (52.0) |
36 (30.5) |
51 (51.0) |
23 (26.1) |
|||
pN stage |
0.738 |
0.570 |
0.083 |
||||||
pN0 |
17 (17.7) |
19 (19.6) |
12 (16.0) |
24 (20.3) |
14 (14.0) |
21 (23.9) |
|||
pN1-2 |
79 (82.3) |
78 (80.4) |
63 (84.0) |
94 (79.7) |
86 (86.0) |
67 (76.1) |
|||
Metastasis |
0.143 |
0.007 |
0.087 |
||||||
Metachronous |
28 (29.2) |
38 (39.2) |
15 (20.0) |
46 (39.0) |
29 (29.0) |
36 (40.9) |
|||
Synchronous |
68 (70.8) |
59 (60.8) |
60 (80.0) |
72 (61.0) |
71 (71.0) |
52 (59.1) |
|||
Lymphatic invasion |
0.104 |
0.119 |
0.003 |
||||||
Absent |
27 (28.1) |
38 (39.2) |
20 (26.7) |
45 (38.1) |
24 (24.0) |
39 (44.3) |
|||
Present |
69 (71.9) |
59 (60.8) |
55 (73.3) |
73 (61.9) |
76 (76.0) |
49 (55.7) |
|||
Perineural invasion |
0.008 |
0.240 |
0.004 |
||||||
Absent |
37 (38.5) |
56 (57.7) |
32 (42.7) |
61 (51.7) |
39 (39.0) |
53 (60.2) |
|||
Present |
59 (61.5) |
41 (42.3) |
43 (57.3) |
57 (48.3) |
61 (61.0) |
35 (39.8) |
|||
KRAS mutation |
1.000 |
0.103 |
1.000 |
||||||
Absent |
45(46.9) |
44 (45.8) |
29 (38.7) |
60 (51.3) |
46 (46.0) |
41 (46.6) |
|||
Present |
51 (53.1) |
52 (54.2) |
46 (61.3) |
57 (48.7) |
54 (54.0) |
47 (53.4) |
|||
PIK3CA mutation |
0.679 |
0.517 |
1.000 |
||||||
Absent |
82 (85.4) |
85 (87.6) |
63 (84.0) |
104 (88.1) |
87 (87.0) |
76 (86.4) |
|||
Present |
14 (14.6) |
12 (12.4) |
12 (16.0) |
14 (11.9) |
13 (13.0) |
12 (13.6) |
|||
BRAF mutation |
0.065 |
0.123 |
|||||||
Absent |
90 (93.8) |
96 (99.0) |
71 (94.7) |
115 (97.5) |
0.434 |
94 (94.0) |
87 (98.9) |
||
Present |
6 (6.3) |
1 (1.0) |
4 (5.3) |
3 (2.5) |
6 (6.0) |
1 (1.1) |
|||
Total |
96(100.0) |
97 (100.0) |
75 (100.0) |
118 (100.0) |
100 (100.0) |
88 (100.0) |
|||
Prognostic value of immunoscore models in advanced CRCs
The Kaplan-Meier analysis revealed that all three IS models had a prognostic association. Higher scores were significantly correlated with improved survival (p = 0.021, p < 0.001, and p < 0.001, for IS, IS-ma, and IS-M, respectively) (Figure 4). By univariate COX regression analysis, the hazard ratios of IS, IS-ma, and IS-M were 1.666, 2.165, and 2.431, respectively (Table 3). Among other clinicopathologic features, age, advanced pT and pN stage, synchronous metastasis, lymphatic invasion, and perineural invasion were correlated with poorer outcomes.
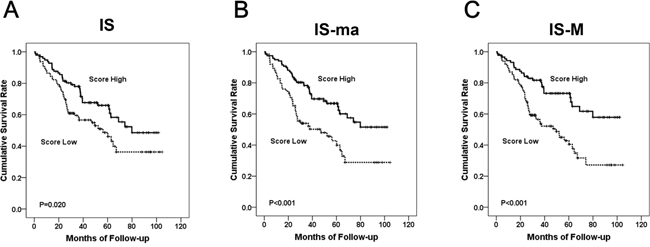
Figure 4: The Kaplan Meier survival curve according to each IS model. The IS (A), IS-ma (B), and IS-M (C).
Table 3: Univariate analysis according to clinicopathologic features including IS models
Variables |
Univariate survival analysis |
|
|---|---|---|
HR (95% CI) |
P value |
|
Age (≥65 vs. <65) |
1.680 (1.096-2.575) |
0.017 |
pT stage (T4 vs. T1-3) |
2.256 (1.468-3.466) |
<0.001 |
pN stage (N1-2 vs. N0) |
4.186 (1.919-9.131) |
<0.001 |
Metastasis (Synchronous vs. Metachronous) |
4.407 (2.421-8.023) |
<0.001 |
Differentiation (Poorly to Undifferentiated vs. Well to moderately differentiated) |
1.744 (0.998-3.049) |
0.051 |
Lymphatic invasion (Present vs. Absent) |
2.889 (1.653-5.051) |
<0.001 |
Perineural invasion (Present vs. Absent) |
2.510 (1.591-3.962) |
<0.001 |
Venous invasion (Present vs. Absent) |
1.204 (0.757-1.913) |
0.433 |
Immunoscore (Low (score 0-2) vs. High (score 3-4)) |
1.666 (1.079-2.572) |
0.021 |
Immunoscore-macrophage (Low (score 0-3) vs. High (score 4-6)) |
2.165 (1.408-3.328) |
<0.001 |
Immunoscore-metastatic (Low (score 0-3) vs. High (score 4-6)) |
2.431 (1.527-3870) |
<0.001 |
Multivariate COX regression analysis revealed that of all three IS models, only the IS-M model was an independent prognostic factor (p = 0.012) (Table 4). Older age and synchronous metastases were also independent prognostic factors. The hazard ratio of a low IS-M was 1.858, higher than that of advanced pT and pN stage (1.291 and 1.874, respectively).
Table 4: Multivariate analysis according to clinicopathologic features including IS models
Score model |
Variables |
Multivariate survival analysis |
|
|---|---|---|---|
HR (95% CI) |
P value |
||
A |
Immunoscore (Low (score 0-2) vs. High (score 3-4)) |
1.336 (0.852-2.094) |
0.206 |
Age (≥65 vs. <65) |
2.160 (1.374-3.394) |
0.001 |
|
pT stage (T4 vs. T1-3) |
1.229 (0.779-1.940) |
0.375 |
|
pN stage (N1-2 vs. N0) |
1.892 (0.849-4.219) |
0.119 |
|
Metastasis (Synchronous vs. Metachronous) |
3.677 (1.927-7.016) |
<0.001 |
|
Lymphatic invasion (Present vs. Absent) |
1.958 (1.095-3.502) |
0.023 |
|
Perineural invasion (Present vs. Absent) |
1.448 (0.896-2.339) |
0.131 |
|
B |
Immunoscore-macrophage (Low (score 0-3) vs. High (score 4-6)) |
1.525 (0.981-2.370) |
0.061 |
Age (≥65 vs. <65) |
1.031 (1.011-1.052) |
0.002 |
|
pT stage (T4 vs. T1-3) |
1.252 (0.794-1.973) |
0.333 |
|
pN stage (N1-2 vs. N0) |
2.071 (0.933-4.598) |
0.074 |
|
Metastasis (Synchronous vs. Metachronous) |
3.402 (1.796-6.447) |
<0.001 |
|
Lymphatic invasion (Present vs. Absent) |
2.021 (1.129-3.615) |
0.018 |
|
Perineural invasion (Present vs. Absent) |
1.537 (0.956-2.470) |
0.076 |
|
C |
Immunoscore-metastatic (Low (score 0-3) vs. High (score 4-6)) |
1.858 (1.144-3.018) |
0.012 |
Age (≥65 vs. <65) |
2.359 (1.477-3.766) |
<0.001 |
|
pT stage (T4 vs. T1-3) |
1.291 (0.814-2.048) |
0.278 |
|
pN stage (N1-2 vs. N0) |
1.874 (0.847-4.146) |
0.121 |
|
Metastasis (Synchronous vs. Metachronous) |
3.696 (1.935-7.060) |
<0.001 |
|
Lymphatic invasion (Present vs. Absent) |
1.744 (0.975-3.122) |
0.061 |
|
Perineural invasion (Present vs. Absent) |
1.422 (0.881-2.296) |
0.149 |
|
Relationship of mutational status with immune cell infiltration and IS
Of the 196 cases examined, 89 (45.6%) had wild-type KRAS and 106 (54.4%) had mutated KRAS. Among the tumors with mutated KRAS, mutations in codon 12 or 13 were identified in 99 (93.4%). Additionally, mutations in BRAF (V600E) were identified in 7 patients (3.6%), and those in PIK3CA were identified in 25 patients (13.1%). The two most common PIK3CA mutations were found in exon 9 (17 cases, 68.0%) and exon 20 (5 cases, 20.0%).
There was no difference in the T cell densities of tumors with KRAS or PIK3CA mutations. In BRAF-positive patients, the density of CD4+ and FOXP3+ T cells was significantly low (p = 0.011 and p < 0.001, respectively) in the CT, whereas FOXP3+ T cell density was significantly high (p < 0.001) in the IM. The density of CD163+ macrophages in the IM was significantly high in patients with KRAS mutation (p = 0.038).
Kaplan-Meier survival analysis revealed that KRAS, PIK3CA, and BRAF mutations had no significant prognostic association. In subgroup analysis, IS-M and IS-ma showed significant prognostic association regardless of the KRAS mutational status. The IS showed a prognostic association in KRAS mutation-negative group (Figure 5). IS-M and IS-ma also presented prognostic association regardless of PIK3CA mutational status. All three IS models showed prognostic significance in the BRAF mutation-negative group. None of the three IS models showed a prognostic association in the BRAF mutation-positive group (n = 7). Four of these 7 patients died during the follow-up period; all 4 had low IS, IS-M, and IS-ma.
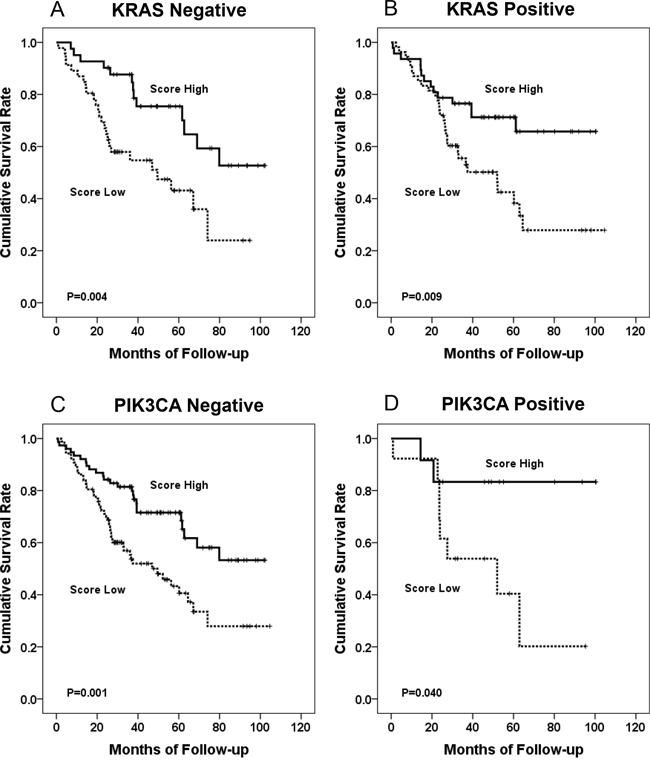
Figure 5: The Kaplan Meier survival curve according to IS-M model. KRAS mutation-negative group (A), KRAS mutation-positive group (B), PIK3CA mutation-negative group (C), and PIK3CA mutation-positive group (D).
Immunoscore models assessed by using median cut-offs
We regrouped the patients into low IS and high IS groups by the median values of the continuous data of immune infiltrates. IS, IS-M, and IS-ma were recalculated by summing the scores assessed by median cut-offs. Of 196 patients, 129 (65.8%) had low IS (IS0: 14.8%, IS1: 20.9, and IS2: 30.1) and 67 (34.2%) had high IS (IS3: 20.9% and IS4: 13.3%). One hundred and twenty-five (64.7%) patients had low IS-ma (IS-ma0: 3.1%, IS-ma1: 5.7%, IS-ma2: 29.0%, and IS-ma3: 26.9%), and 68 (35.3%) patients presented with high IS-ma (IS-ma4: 23.3%, IS-ma5: 10.4%, and IS-ma6: 1.6%). Of 188 patients, 117 (62.2%) had low IS-M (IS-M0: 4.8%, IS-M1: 14.9%, IS-M2: 23.4%, and IS-M3: 19.1%), and 71 (37.8%) had high IS-M (IS-M4: 18.1%, IS-M5: 12.8%, and IS-M6: 6.9%).
When the IS was compared to the patient’s clinicopathologic features, lower IS was associated with synchronous metastasis (p = 0.035). Lower IS-M was also correlated with aggressive clinicopathological features, including higher pT stage (p = 0.009), pN stage (p = 0.012), synchronous metastasis (p = 0.010), and perineural invasion (p = 0.016). There was no significant association between IS-ma and clinicopathologic features. The Kaplan–Meier survival analysis revealed that a high score of IS-M was significantly associated with good prognosis (p = 0.008), although IS and IS-ma models had no significant association (p = 0.113 and p = 0.328, IS and IS-ma respectively).
DISCUSSION
The present study demonstrated that TILs and TAMs show significant heterogeneity in their tumor infiltration site. The density of CD3+ and CD8+ lymphocytes was higher in the IM than in the CT. The infiltration of CD3+, CD8+, and CD163+ immune cells was significantly different between the CT and the IM as well as between the CT and DM. Although several studies have reported the density of tumor-infiltrating immune cells of CRC patients according to the tumor sites, these reports included only two or three subsets of tumor-infiltrating immune cells or did not consider the density of tumor-infiltrating immune cells in the DM [31–33]. This study compared the density of 4 T cell subsets and 2 macrophage subsets in different sites of tumors. We also compared the density of tumor-infiltrating immune cells in primary and metastatic tumors. To our knowledge, this is the first comprehensive report of the heterogeneity of tumor-infiltrating immune cells in CRCs
In several previous studies, the protective role of T cell subsets on tumor progression has been consistently reported [34–36]. Most of studies have demonstrated that dense infiltration of CD3+, CD8+ or CD45RO+ lymphocytes are associated with less aggressive clinicopathological features and a better prognosis [35, 36]. In this study, our cohort was composed of patients with metastatic disease and we demonstrated the prognostic value of the IS method. Hence, TIL of tumor microenvironmental factors and the IS system could be a robust prognostic factor that is assessable for advanced CRC patients with distant metastasis.
Our results demonstrated that the IS-M model, which includes the score of two lymphocytic markers in the DM, is superior to IS or IS-ma. The conventional model designed by Galon et al. covers lymphocytic infiltrates in only the primary tumor. However, in the present study, we confirmed that tumor-infiltrating immune cells have not only heterogeneity of quantity but also distinct clinical significance in relation to the tumor location. Therefore, the immune infiltrates in metastatic lesions as well as in the primary tumor should be assessed to validate the patient’s systemic immune reaction on whole tumors. This is supported our by results showing that the IS-M model was the only independent prognostic marker among the IS models in multivariate analysis.
In a recent report, Lea et al. described the limitations of the current TNM staging system in predicting the outcome of patients with CRC [20]. They suggested that the immune cell density in the stromal environment could be a better prognostic marker. This suggestion was also confirmed by Mlecnik et al [37]. Furthermore, the multivariate survival analysis conducted by Anitei et al. confirmed that the IS system has stronger prognostic value than the TNM staging system [38]. The present study demonstrated that the IS-M has a significant association with prognosis regardless of KRAS or PIK3CA mutational status. Hence, immune contexture, including immune cell density in primary and metastatic tumors, could be a reliable prognostic marker in CRC, regardless of patients’ mutational status.
However, it seems that there are some challenges in applying the IS system as a prognostication factor. First, the determination of an optimal cut-off value is difficult. Galon et al. illustrated that a predetermined cut-off value should be used to score high versus low values for each marker in each location. The previous study by Galon et al., as well our study, used a maximal-chi square method to set optimal cut-off values. However, other values such as the 25th percentile, median, and 75th percentile could be candidates for alternative cut-off values. We calculated three IS systems using the median cut-off, and the results of survival analysis showed a similar tendency; the patients with a higher IS-M score had significantly better outcome. However, both the cut-off values calculated by the maximal-chi square method and the median values would differ according to several factors, including cohort characteristics, quality of the sample, selected area of examination, antibodies to be used, and cell counting algorithms. Thus, to set a reliable cut-off value of the density of immune infiltrates, a multicenter prospective study for the standardization of the detailed methodology is needed.
Another challenge is the selection of optimal area for density analysis. Since the density of immune infiltrates is highly heterogeneous, selection of the analyzed area could affect the results. According to Galon et al., who first suggested the IS system, the combined analysis of immune infiltrates in the CT and IM could improve the prediction of patient survival [35]. After the initial study, several studies have evaluated the IS system [37–39]. The IS system is organized and is based on the enumeration of two lymphocyte populations in the CT and IM. We also examined the immune infiltrates in the CT and IM using TMA method, similar to the previous studies. However, it is predictable that the results could be affected by the selection of the analyzed area owing to the heterogeneity of immune infiltrates. To assess this potential limitation, we investigated the density of CD3+ T cells in 4 different portions (2 CT and 2 IM areas) of 57 cases using additional TMA blocks. The median value of CD3+ T cell density was 281.72 (IQR, 160.69 – 488.91) in CT1 and 205.5174 (IQR, 109.87 – 485.96) in CT2. In IM, the median value of IM1 and IM2 were 353.67 (IQR, 208.74 – 692.79) and 331.60 (IQR, 226.95 – 455.22), respectively. We evaluated the consistency of T cell infiltrates by calculating the Pearson’s correlation coefficient. The Pearson’s R of T cell infiltrates in between 2 areas of CT (CT1 vs. CT2) was 0.668 (p < 0.001). Between IM1 and IM2, the Pearson’s R value was 0.498 (p < 0.001). However, the statistically significant correlation of T cell densities between in CT and IM was not observed (p > 0.05). These results suggest that selection of CT and IM areas are necessary and suitable for the evaluation of immune infiltrates using TMA method. However, further studies with persuasive validation of the heterogeneity of immune infiltrates are required.
In summary, we demonstrated the regional heterogeneity of tumor-infiltrating immune cells according to the tumor location in our large cohort of advanced CRC patients with synchronous and metachronous distant metastasis. Also, the amount of immune infiltrates was also heterogeneous in relation to the metastatic organ examined. Higher infiltrates of TIL and lower infiltrates of TAM correlated with longer survival. The three IS models, IS, IS-ma, and IS-M also had prognostic significance in univariate analysis. Among the three IS methods, the IS-M model that includes TILs in the DM was an independent prognostic marker. Our results suggest that immune infiltration in the DM should be evaluated to assess the IS system for advanced CRC patients with distant metastases.
MATERIALS AND METHODS
Patient selection and tissue microarray construction
A total of 196 advanced CRC patients who presented with synchronous or metachronous metastases were enrolled in this study. They underwent surgical treatment for primary and metastatic disease at Seoul National University Bundang Hospital (Seongnam-si, South Korea) between 2003 and 2009. Of the 196 patients, none had received preoperative systemic therapy or radiation treatment. The patient’s clinical and pathological data were obtained through medical charts and pathology reports. The patient outcomes and their survival times were collected. The patients lost to follow-up or dead from causes other than CRC were assumed as censored. The follow-up period ranged from 0.8 to 104.6 months (median, 37.3 months).
All patients with synchronous metastasis underwent adjuvant chemotherapy after the surgical resection of primary and metastatic tumors. Of the 62 patients with metachronous metastasis, 56 underwent adjuvant chemotherapy, and presented with metastatic lesions during their follow-up period. Six patients with metachronous metastasis treated with curative resection of primary cancer received no adjuvant chemotherapy after the surgical resection. Since the metastatic lesion was observed during their follow-up period, they were treated with metastasectomy and chemotherapy.
Formalin-fixed paraffin-embedded tissues from the CRCs were collected. The representative core tissues (2 mm in diameter) were used. The obtained tumor tissue included the area of CT and IM of the primary tumor as well as its related DM. Each core tissue was rearranged into tissue array blocks using a trephine apparatus (Superbiochips Laboratories, Seoul, South Korea) [40].
Immunohistochemistry and image analysis of tumor-infiltrating immune cell
The presence of tumor-infiltrating immune cells was confirmed by immunohistochemistry using antibodies for CD3 (1:100, DAKO, Glostrup, Denmark), CD4 (RTU, Ventana, Tucson, AZ, USA), CD8 (1:100, Neomarkers, Fremont, CA, USA), FOXP3 (1:100, Abcam, Cambridge, UK), CD68 (1:100, DAKO), and CD163 (1:100, Novocastra, Newcastle, UK). Immunostaining for CD3, CD8, and FOXP3 was performed using a Bond polymer kit (Leica Microsystems) and Leica BOND-MAX autostainer (Leica Microsystems). CD4, CD68, and CD163 expression was detected immunohistochemically on a Ventana Bench mark XT autostainer (Ventana) with the OPTIVIEW universal DAB kit (Ventana).
All immunostained slides were scanned on an Aperio ScanScope® CS instrument (Aperio Technologies, Inc., Vista, CA, USA) at 20 x magnifications. Each immunomarker-positive tumor-infiltrating immune cells quantified by computerized image analysis system, ImageScopeTM (Aperio Technologies) (Figure1). CD3+, CD4+, CD8+, and FOXP3+ lymphocytes were counted using the Nuclear v9 algorithm and CD68+ and CD163+ macrophages were counted using the Positive pixel count v9 algorithm. The density of immune infiltrates was obtained from the entire area of the tissue core.
Determination of scoring system
The patients were divided into two groups by the density of each tumor-infiltrating immune cell according to each tumor location (high vs low). To set the best cut-off values, the maximal chi-square method was used related to the patient’s overall survival [19, 38]. In addition, we analyzed the results according to median cut-offs. The detailed cut-off values of each variable are listed in Table 1 .
The IS is defined as a quantification system based on the combination of two markers (CD3 and CD8) in two regions [18, 19]. A high density of immunomarker-positive lymphocytes in each region was recorded as a score. We established two additional scoring models. One is the IS-M, which encompasses the density of CD3+ and CD8+ TILs in metastatic tumors. It is a summation of the score of CD3+ and CD8+ TILs in the CT, IM, and DM.
Another score model, IS-ma, is calculated by adding the score of the density of CD163+ TAMs in the primary tumor (CT and IM) to the IS. Thus, IS-ma includes the score of CD3+, CD8+, and CD163+ immune infiltrates in CT and IM. Our data showed that TAMs had an opposite prognostic correlation compared to that of TILs; a high density of TILs was recorded as score 1, but a high density of TAMs was recorded as score 0 to ensure the consistency of the scoring system. The schematic definitions of each of the three IS models are described in Figure 1E.
Detection of mutations in KRAS, BRAF, and PIK3CA using real-time PCR
Hematoxylin-Eosin (HE)-stained slides of CRC tissues were reviewed by a pathologist (H.S.L). Tumor areas were identified and microscopically dissected to sections with an area of more than 1 × 1 cm and comprising more than 60% tumor cells. One or two 8-μm-thick formalin-fixed paraffin-embedded (FFPE) tumor tissue sections were de-paraffinized in xylene for 5 min at room temperature (RT), dehydrated in absolute alcohol for 5 min at RT, and air dried completely for 10 min. DNA was isolated using the Cobas DNA Sample Preparation Kit (Roche, Branchburg, NJ, USA) according to manufacturer’s instructions, and the same preparation protocol was followed for all Cobas mutation kits used in this study. The concentration of the isolated DNA was measured using a NanoDrop UV spectrophotometer (Thermo Fisher Scientific, Wilmington, DE, USA), and the DNA was diluted with DNA Specimen Diluent from the Cobas 4800 Mutation Test kit (Roche) to the optimal concentration for each gene (KRAS, 4 ng/μL; BRAF, 5 ng/μL; and PIK3CA, 2 ng/μL). Amplification and detection were performed using an Automated Cobas X480 analyzer. The real-time PCR assay was performed to detect the mutation in codons 12, 13, and 61 of KRAS; the V600E BRAF mutation; and the mutation in exons 1, 4, 7, 9, and 20 of PIK3CA.
Statistical analysis
To compare each non-continuous variable, a Wilcoxon/Mann-Whitney test or Kruskal-Wallis analysis was used. To establish the optimal cut-offs of continuous variables, the maximal chi-squared method was performed using the R program (http://cran.r-project.org/). The Kaplan-Meier method was used to examine survival outcomes and the significance of the differences between groups was compared using the log-rank test. A univariate and multivariate regression analysis was performed using Cox proportional hazards models to determine hazard ratios (HRs). P values of less than 0.05 were considered statistically significant. All statistical analysis, except for the maximal chi square test, was performed using IBM SPSS statistics 20 (Armonk, NY, USA).
CONFLICTs OF INTEREST
The authors have declared no conflicts of interest.
FUNDING
This study was supported by grant number 14-2016-014 from the Seoul National University Bundang Hospital Research Fund. The funder had no role in study design, data collection and analysis, decision to publish, or preparation of the manuscript.
REFERENCES
1. Muller-Hubenthal B, Azemar M, Lorenzen D, Huber M, Freudenberg MA, Galanos C, Unger C, Hildenbrand B. Tumour Biology: tumour-associated inflammation versus antitumor immunity. Anticancer Res. 2009; 29: 4795-805.
2. Overwijk WW. Breaking tolerance in cancer immunotherapy: time to ACT. Curr Opin Immunol. 2005; 17: 187-94. doi: 10.1016/j.coi.2005.01.011.
3. Di Caro G, Marchesi F, Laghi L, Grizzi F. Immune cells: plastic players along colorectal cancer progression. J Cell Mol Med. 2013; 17: 1088-95. doi: 10.1111/jcmm.12117.
4. Giraldo NA, Becht E, Remark R, Damotte D, Sautes-Fridman C, Fridman WH. The immune contexture of primary and metastatic human tumours. Curr Opin Immunol. 2014; 27: 8-15. doi: 10.1016/j.coi.2014.01.001.
5. Clemente CG, Mihm MC, Jr., Bufalino R, Zurrida S, Collini P, Cascinelli N. Prognostic value of tumor infiltrating lymphocytes in the vertical growth phase of primary cutaneous melanoma. Cancer. 1996; 77: 1303-10. doi: 10.1002/(sici)1097-0142(19960401)77:7<1303::aid-cncr12>3.0.co;2-5.
6. Gabrielson A, Wu Y, Wang H, Jiang J, Kallakury B, Gatalica Z, Reddy S, Kleiner D, Fishbein T, Johnson L, Island E, Satoskar R, Banovac F, et al. Intratumoral CD3 and CD8 T-cell Densities Associated with Relapse-Free Survival in HCC. Cancer Immunol Res. 2016; 4: 419-30. doi: 10.1158/2326-6066.cir-15-0110.
7. Salgado R, Denkert C, Demaria S, Sirtaine N, Klauschen F, Pruneri G, Wienert S, Van den Eynden G, Baehner FL, Penault-Llorca F, Perez EA, Thompson EA, Symmans WF, et al. The evaluation of tumor-infiltrating lymphocytes (TILs) in breast cancer: recommendations by an International TILs Working Group 2014. Ann Oncol. 2015; 26: 259-71. doi: 10.1093/annonc/mdu450.
8. Topalian SL, Taube JM, Anders RA, Pardoll DM. Mechanism-driven biomarkers to guide immune checkpoint blockade in cancer therapy. Nat Rev Cancer. 2016. doi: 10.1038/nrc.2016.36.
9. Lee WS, Park S, Lee WY, Yun SH, Chun HK. Clinical impact of tumor-infiltrating lymphocytes for survival in stage II colon cancer. Cancer. 2010; 116: 5188-99. doi: 10.1002/cncr.25293.
10. Berghoff AS, Fuchs E, Ricken G, Mlecnik B, Bindea G, Spanberger T, Hackl M, Widhalm G, Dieckmann K, Prayer D, Bilocq A, Heinzl H, Zielinski C, et al. Density of tumor-infiltrating lymphocytes correlates with extent of brain edema and overall survival time in patients with brain metastases. Oncoimmunology. 2016; 5: e1057388. doi: 10.1080/2162402x.2015.1057388.
11. Bremnes RM, Busund LT, Kilvaer TL, Andersen S, Richardsen E, Paulsen EE, Hald S, Khanehkenari MR, Cooper WA, Kao SC, Donnem T. The Role of Tumor-Infiltrating Lymphocytes in Development, Progression, and Prognosis of Non-Small Cell Lung Cancer. J Thorac Oncol. 2016; 11: 789-800. doi: 10.1016/j.jtho.2016.01.015.
12. Burugu S, Asleh-Aburaya K, Nielsen TO. Immune infiltrates in the breast cancer microenvironment: detection, characterization and clinical implication (in press). Breast Cancer. 2016. doi: 10.1007/s12282-016-0698-z.
13. Nguyen N, Bellile E, Thomas D, McHugh J, Rozek L, Virani S, Peterson L, Carey TE, Walline H, Moyer J, Spector M, Perim D, Prince M, et al. Tumor infiltrating lymphocytes and survival in patients with head and neck squamous cell carcinoma. Head Neck. 2016; 38: 1074-84. doi: 10.1002/hed.24406.
14. Zeng DQ, Yu YF, Ou QY, Li XY, Zhong RZ, Xie CM, Hu QG. Prognostic and predictive value of tumor-infiltrating lymphocytes for clinical therapeutic research in patients with non-small cell lung cancer. Oncotarget. 2016; 7: 13765-81. doi: 10.18632/oncotarget.7282.
15. Zikich D, Schachter J, Besser MJ. Predictors of tumor-infiltrating lymphocyte efficacy in melanoma. Immunotherapy. 2016; 8: 35-43. doi: 10.2217/imt.15.99.
16. Mihm MC, Jr., Mule JJ. Reflections on the Histopathology of Tumor-Infiltrating Lymphocytes in Melanoma and the Host Immune Response. Cancer Immunol Res. 2015; 3: 827-35. doi: 10.1158/2326-6066.cir-15-0143.
17. Fridman WH, Pages F, Sautes-Fridman C, Galon J. The immune contexture in human tumours: impact on clinical outcome. Nat Rev Cancer. 2012; 12: 298-306. doi: 10.1038/nrc3245.
18. Galon J, Mlecnik B, Bindea G, Angell HK, Berger A, Lagorce C, Lugli A, Zlobec I, Hartmann A, Bifulco C, Nagtegaal ID, Palmqvist R, Masucci GV, et al. Towards the introduction of the 'Immunoscore' in the classification of malignant tumours. J Pathol. 2014; 232: 199-209. doi: 10.1002/path.4287.
19. Galon J, Pages F, Marincola FM, Angell HK, Thurin M, Lugli A, Zlobec I, Berger A, Bifulco C, Botti G, Tatangelo F, Britten CM, Kreiter S, et al. Cancer classification using the Immunoscore: a worldwide task force. J Transl Med. 2012; 10: 205. doi: 10.1186/1479-5876-10-205.
20. Lea D, Haland S, Hagland HR, Soreide K. Accuracy of TNM staging in colorectal cancer: a review of current culprits, the modern role of morphology and stepping-stones for improvements in the molecular era. Scand J Gastroenterol. 2014; 49: 1153-63. doi: 10.3109/00365521.2014.950692.
21. Fridman WH, Galon J, Dieu-Nosjean MC, Cremer I, Fisson S, Damotte D, Pages F, Tartour E, Sautes-Fridman C. Immune infiltration in human cancer: prognostic significance and disease control. Curr Top Microbiol Immunol. 2011; 344: 1-24. doi: 10.1007/82_2010_46.
22. Pages F, Kirilovsky A, Mlecnik B, Asslaber M, Tosolini M, Bindea G, Lagorce C, Wind P, Marliot F, Bruneval P, Zatloukal K, Trajanoski Z, Berger A, et al. In situ cytotoxic and memory T cells predict outcome in patients with early-stage colorectal cancer. J Clin Oncol. 2009; 27: 5944-51. doi: 10.1200/JCO.2008.19.6147.
23. Mantovani A, Sozzani S, Locati M, Allavena P, Sica A. Macrophage polarization: tumor-associated macrophages as a paradigm for polarized M2 mononuclear phagocytes. Trends Immunol. 2002; 23: 549-55. doi:
24. Ostuni R, Kratochvill F, Murray PJ, Natoli G. Macrophages and cancer: from mechanisms to therapeutic implications. Trends Immunol. 2015; 36: 229-39. doi: 10.1016/j.it.2015.02.004.
25. Raggi C, Mousa HS, Correnti M, Sica A, Invernizzi P. Cancer stem cells and tumor-associated macrophages: a roadmap for multitargeting strategies. Oncogene. 2016; 35: 671-82. doi: 10.1038/onc.2015.132.
26. Bingle L, Brown NJ, Lewis CE. The role of tumour-associated macrophages in tumour progression: implications for new anticancer therapies. J Pathol. 2002; 196: 254-65. doi: 10.1002/path.1027.
27. Lackner C, Jukic Z, Tsybrovskyy O, Jatzko G, Wette V, Hoefler G, Klimpfinger M, Denk H, Zatloukal K. Prognostic relevance of tumour-associated macrophages and von Willebrand factor-positive microvessels in colorectal cancer. Virchows Arch. 2004; 445: 160-7. doi: 10.1007/s00428-004-1051-z.
28. Tan SY, Fan Y, Luo HS, Shen ZX, Guo Y, Zhao LJ. Prognostic significance of cell infiltrations of immunosurveillance in colorectal cancer. World J Gastroenterol. 2005; 11: 1210-4.
29. Kim KJ, Wen XY, Yang HK, Kim WH, Kang GH. Prognostic Implication of M2 Macrophages Are Determined by the Proportional Balance of Tumor Associated Macrophages and Tumor Infiltrating Lymphocytes in Microsatellite-Unstable Gastric Carcinoma. PLoS One. 2015; 10: e0144192. doi: 10.1371/journal.pone.0144192.
30. Edin S, Wikberg ML, Dahlin AM, Rutegard J, Oberg A, Oldenborg PA, Palmqvist R. The distribution of macrophages with a M1 or M2 phenotype in relation to prognosis and the molecular characteristics of colorectal cancer. PLoS One. 2012; 7: e47045. doi: 10.1371/journal.pone.0047045.
31. Lavotshkin S, Jalas JR, Torisu-Itakura H, Ozao-Choy J, Lee JH, Sim MS, Stojadinovic A, Wainberg Z, Bifulco CB, Fox BA, Bilchik AJ. Immunoprofiling for prognostic assessment of colon cancer: a novel complement to ultrastaging. J Gastrointest Surg. 2015; 19: 999-1006. doi: 10.1007/s11605-015-2759-6.
32. Turcotte S, Gros A, Tran E, Lee CC, Wunderlich JR, Robbins PF, Rosenberg SA. Tumor-reactive CD8+ T cells in metastatic gastrointestinal cancer refractory to chemotherapy. Clin Cancer Res. 2014; 20: 331-43. doi: 10.1158/1078-0432.ccr-13-1736.
33. Turksma AW, Coupe VM, Shamier MC, Lam KL, de Weger VA, Belien JA, van den Eertwegh AJ, Meijer GA, Meijer CJ, Hooijberg E. Extent and Location of Tumor-Infiltrating Lymphocytes in Microsatellite-Stable Colon Cancer Predict Outcome to Adjuvant Active Specific Immunotherapy. Clin Cancer Res. 2016; 22: 346-56. doi: 10.1158/1078-0432.ccr-13-2462.
34. Mei Z, Liu Y, Liu C, Cui L. Response to comment on 'Tumour-infiltrating inflammation and prognosis in colorectal cancer: systematic review and meta-analysis'. Br J Cancer. 2014; 111: 2372-3. doi: 10.1038/bjc.2014.285.
35. Galon J, Costes A, Sanchez-Cabo F, Kirilovsky A, Mlecnik B, Lagorce-Pages C, Tosolini M, Camus M, Berger A, Wind P, Zinzindohoue F, Bruneval P, Cugnenc PH, et al. Type, density, and location of immune cells within human colorectal tumors predict clinical outcome. Science. 2006; 313: 1960-4. doi: 10.1126/science.1129139.
36. Sato E, Olson SH, Ahn J, Bundy B, Nishikawa H, Qian F, Jungbluth AA, Frosina D, Gnjatic S, Ambrosone C, Kepner J, Odunsi T, Ritter G, et al. Intraepithelial CD8+ tumor-infiltrating lymphocytes and a high CD8+/regulatory T cell ratio are associated with favorable prognosis in ovarian cancer. Proc Natl Acad Sci U S A. 2005; 102: 18538-43. doi: 10.1073/pnas.0509182102.
37. Mlecnik B, Tosolini M, Kirilovsky A, Berger A, Bindea G, Meatchi T, Bruneval P, Trajanoski Z, Fridman WH, Pages F, Galon J. Histopathologic-based prognostic factors of colorectal cancers are associated with the state of the local immune reaction. J Clin Oncol. 2011; 29: 610-8. doi: 10.1200/jco.2010.30.5425.
38. Anitei MG, Zeitoun G, Mlecnik B, Marliot F, Haicheur N, Todosi AM, Kirilovsky A, Lagorce C, Bindea G, Ferariu D, Danciu M, Bruneval P, Scripcariu V, et al. Prognostic and predictive values of the immunoscore in patients with rectal cancer. Clin Cancer Res. 2014; 20: 1891-9. doi: 10.1158/1078-0432.ccr-13-2830.
39. Mlecnik B, Bindea G, Angell HK, Maby P, Angelova M, Tougeron D, Church SE, Lafontaine L, Fischer M, Fredriksen T, Sasso M, Bilocq AM, Kirilovsky A, et al. Integrative Analyses of Colorectal Cancer Show Immunoscore Is a Stronger Predictor of Patient Survival Than Microsatellite Instability. Immunity. 2016; 44: 698-711. doi: 10.1016/j.immuni.2016.02.025.
40. Lee HS, Kim WH. Tissue array methods for high-throughput clinicopathologic research. Cancer Res Treat. 2006; 38: 1-6. doi: 10.4143/crt.2006.38.1.1.