
INTRODUCTION
Warburg metabolism (enhanced glycolysis in the presence of oxygen) is a common feature of several malignant tumors and is associated with cancer aggressiveness, invasiveness and poor prognosis [1–3]. Because of this high glycolytic rate in various cancers, targeting glucose metabolism is presented as an attractive anticancer approach endowed with a high specificity and limited undesirable side effects [4, 5]. Indeed, conventional treatments rely on the rapid proliferation process present in cancer cells but also in healthy cells. Treatments targeting glycolytic metabolism should instead specifically alter metabolic adaptations that support the Warburg malignant phenotype, adaptations that are not shared by normal cells. To support drug development and assessment in clinical trials, there is a critical need for dedicated criteria evaluating tumor response to these emerging therapies. Moreover, for new cytostatic agents targeting tumor metabolism, the use of conventional anatomical imaging techniques is not optimal for treatment response assessment [4] and only functional and molecular imaging techniques may offer the possibility of an early assessment of the tumor response [6–8].
Recently, we have investigated the effects of dichloroacetate (DCA) in tumor cell lines presenting different metabolic profiles [9]. DCA is a promising molecule that promotes glucose oxidation over glycolysis by inhibiting the mitochondrial pyruvate dehydrogenase kinase (PDK) and has successfully reached clinical trials [10]. We found that 5 mM DCA was more effective in glycolytic-phenotype cancer cells, where reduction in cell proliferation was mediated by a reactivation of mitochondrial function and a decrease in glycolytic and pentose phosphate pathway fluxes. Our data suggested that DCA may benefit to patients with highly glycolytic tumors. Therefore, the objective of the present study was to assess the effect of DCA in these prototypical tumor models in vivo, namely the glycolytic MDA-MB-231 human breast cancer model and the oxidative SiHa human cervical cancer model. For this purpose, we used a multi-modality molecular imaging approach using several pharmacodynamic metabolic biomarkers. Oxygen consumption, studied by 17O magnetic resonance spectroscopy (17O MRS), glucose uptake, evaluated by 18F-fluorodeoxyglucose positron emission tomography (18F-FDG PET) and pyruvate transformation into lactate, measured during hyperpolarized 13C-magnetic resonance imaging (hyperpolarized 13C-MRI), were monitored before and after DCA treatment in tumor bearing mice. Surprisingly, in vivo models did not recapitulate the previously observed in vitro behavior.
RESULTS
To assess the impact of DCA treatment on the metabolism of the models in vivo, oxygen consumption (Figure 1), glucose uptake (Figure 2) and lactate flux (Figure 3) were measured in MDA-MB-231 and SiHa tumors before and 24 hours after DCA treatment.
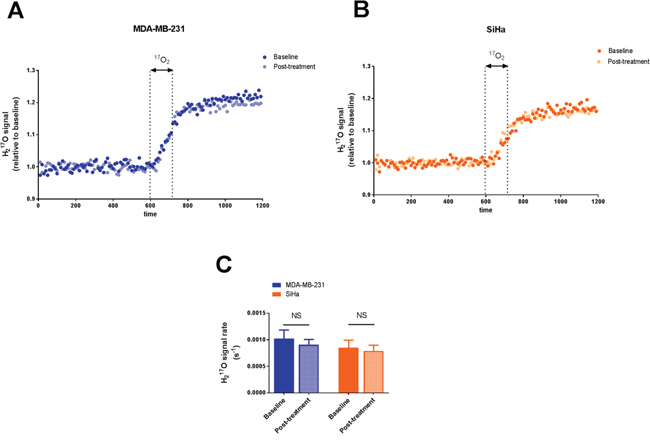
Figure 1: Effect of dichloroacetate on tumor oxygen consumption in vivo. Tumor H217O signal from representative MDA-MB-231 tumors A. and SiHa tumors B. acquired before, during and after a 2 min inhalation period of the 17O2 gas. H217O signal is expressed as relative to the mean baseline signal before 17O2 delivery. 17O2 metabolismis not modified by DCA treatment. C. Comparison of the rate of H217O signal after 17O2 delivery in tumors pre and post-treatment. Data are expressed as means ± SEM. Paired tests were two-sided.
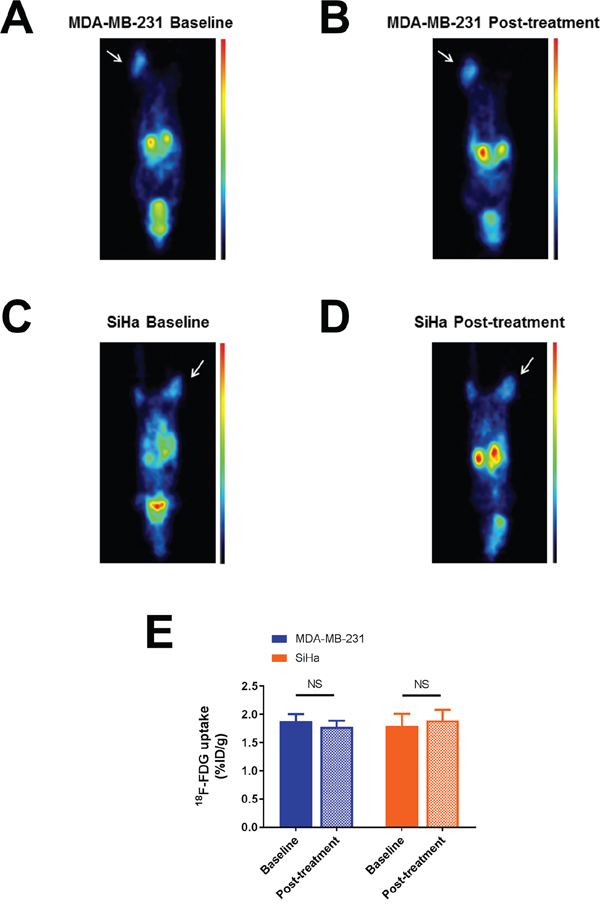
Figure 2: Effect of dichloroacetate on tumor glucose uptake in vivo. Representative 18F-FDG PET images showing MDA-MB-231 A-B. and SiHa C-D. tumor-bearing mouse imaged before and 24 hours after DCA treatment. Tumors are indicated by thin arrows. 18F-FDG uptake is expressed in %ID/g. Images were normalized. DCA does not alter 18F-FDG uptake in MDA-MB-231 and SiHa tumors. E. Comparison of 18F-FDG uptake before and after treatment. Data are expressed as means ± SEM. Paired tests were two-sided.
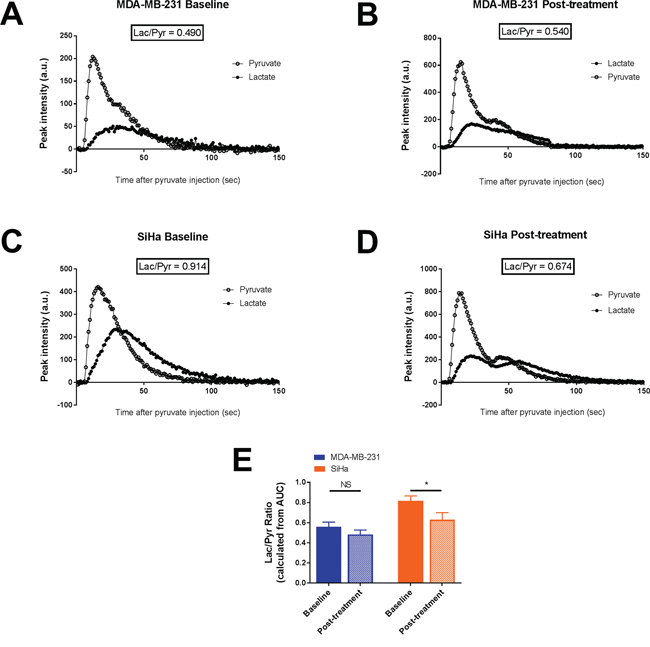
Figure 3: Effect of dichloroacetate on tumor lactate production in vivo. Tumor lactate and pyruvate peak intensities after i.v. injection of hyperpolarized 1-13C pyruvate from representative MDA-MB-231 tumors A-B. and SiHa tumors C-D. Lactate production, measured by the Lac/Pyr ratio, in MDA-MB-231 and SiHa tumors before and after treatment E. Data are expressed as means ± SEM. Paired tests were two-sided.
In Figure 1, tumor H217O spectra are presented for representative MDA-MB-231 (Figure 1A) and SiHa tumors (Figure 1B) during 17O MRS experiments. The results were highly reproducible under the same conditions tested. The evolution of H217O signal, demonstrating the 17O2 metabolism in tumors, was similar before and after DCA treatment in MDA-MB-231 tumors (Figure 1A) and in SiHa tumors (Figure 1B). In both tumors models, we found that DCA treatment did not majorly impact oxygen consumption, as assessed by the rate of increase in H217O signal (Figure 1C). MDA-MB-231 tumors exhibited a slope of 1.02 10-3 ± 0.16 10-3 s-1 and 0.91 10-3 ± 0.09 10-3 s-1 before and after treatment respectively (n=5, P=0.5366). For SiHa tumors, the slopes were 0.85 10-3 ± 0.14 10-3 s-1 under baseline condition and 0.79 10-3 ± 0.11 10-3 s-1 post-treatment (n =5, P=0.2892).
18F-FDG uptake (%ID/g) measured in both tumor models under baseline and post-treatment conditions are presented in Figure 2. In both tumor models, we found that DCA treatment did not lead to a significant change in the uptake of 18F-FDG (Figure 2A-2D), assessing a limited impact of DCA on glucose uptake (Figure 2E). %ID/g measured on PET images (mean ± SEM) were 1.88 ± 0.12 under baseline condition and 1.78 ± 0.11 after treatment for MDA-MB-231 tumors (n=7, P=0.2120) and 1.79 ± 0.21 under baseline condition and 1.89 ± 0.19 after treatment for SiHa tumors (n=7, P=0.0813).
The influence of DCA treatment on pyruvate transformation into lactate was measured after hyperpolarized 1-13C pyruvate injection during hyperpolarized 13C-MRS studies (Figure 3). Representative pyruvate and lactate peak intensities over time of MDA-MB-231 tumors and SiHa tumors captured before and 24 hours after DCA treatment are shown in Figure 3A-3D. Lactate production was reduced after DCA treatment only in SiHa tumors (Figure 3E). Lactate/pyruvate ratio (Lac/Pyr) shifted from 0.55 ± 0.05 to 0.48 ± 0.04 in MDA-MB-231 tumors (n=7, P=0.3105) and from 0.82 ± 0.05 to 0.63 ± 0.07 in SiHa tumors (n=7, P=0.0348).
We also evaluated the magnitude of response to the treatment by measuring the variation within the above biomarkers between baseline and post-treatment conditions (Figure 4). No differences in oxygen consumption and lactate flux measurements were observed between MDA-MB-231 and SiHa tumors during the treatment (P>0.05) (Figure 4A, 4C). Only a small but significant difference in behavior was observed for 18F-FDG uptake measurements (P=0.0240) (Figure 4B). MDA-MB-231 tumors decreased their 18F-FDG uptake after treatment (n=7, -5.4 ± 3.5 %) compared to SiHa tumors (n=7, +6.7 ± 3.1 %).
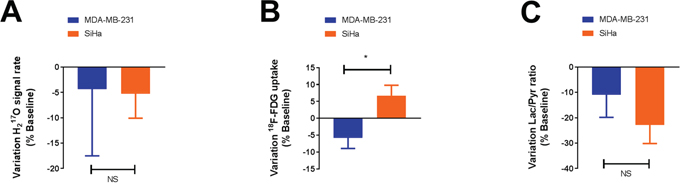
Figure 4: DCA does not significantly influence the metabolism of glycolytic tumors compared to oxidative tumors, as assessed by 17O2 metabolism A., 18F-FDG uptake B. and pyruvate transformation into lactate C. measurements in vivo. The magnitude of response to dichloroacetate (variation) is identical in both models, only a small difference in behavior is observed for 18F-FDG uptake. Data are expressed as means ± SEM. Unpaired tests were two-sided.
DISCUSSION
In this study, the impact of DCA on tumors presenting different metabolic profiles was evaluated using molecular imaging in vivo. Recent findings identified that DCA preferentially impairs glycolytic cells compared to oxidative cells. The purpose of the present study was to establish the relevance of these findings in vivo using the same prototypical tumor models as in our in vitro study [9], namely the MDA-MB-231 human breast cancer model reported as glycolytic [1, 11] and the SiHa human cervical cancer model documented as oxidative [11, 12]. The dose and administration scheme were selected based on previous reports attesting the efficacy of DCA in tumors [13–15].
In vitro, we previously identified clear effects of DCA treatment on oxygen consumption, glucose consumption and lactate uptake in glycolytic MDA-MB-231 human breast cancer cells. On the other hand, the metabolic activity of oxidative SiHa human cervical cancer cells was not altered by DCA treatment. Using a multi-modality imaging project, we were not able to recapitulate these findings in vivo. Pre-treatment, MDA-MB-231 and SiHa tumors exhibit the same metabolic profile. As MDA-MB-231 and SiHa tumors were previously described as hypoxic under baseline condition [16], we highlighted here that both tumor models exhibit a glycolytic phenotype under anaerobic condition. Post-treatment, glycolytic MDA-MB-231 tumors do not appear more impacted than oxidative SiHa tumors (Figure 1-4). Also, some marginal metabolic changes were identified such as a significant decreased lactate production in SiHa tumors (Figure 3E) or a decreased 18F-FDG uptake in MDA-MB-231 tumors (Figure 4B). Together, those findings did not highlight a clear metabolic shift in MDA-MB-231 tumors or in SiHa tumors treated with DCA during 24 hours (Supplementary Figure S1). This inability to observe any treatment response in vivo could not be attributed to any differences in growth rate between the tumor models under study (Supplementary Figure S2). Also, the measurement repeatability was formerly established using the same tumor models [16]. Our study demonstrated that the tumor metabolic response to DCA was dramatically different between in vitro and in vivo conditions.
Because of its good tolerability and safety, DCA has been universally exploited to lower lactate levels in acquired or congenital forms of lactic acidosis [17]. In 2007, Bonnet and colleagues investigated the effects of DCA in cancer and discovered that DCA was promoting apoptosis in vitro and decreasing tumor growth in vivo [18]. Since then, this orally available and cheap molecule has been further investigated in vitro, in vivo and successfully reached clinical trials. The first data available from the clinical trials indicate that DCA appears to be efficient in adults in solid and brain tumors [19, 20]. However, no firm conclusions stand out in advanced non-small cell lung cancer [21]. In another recent study of Feuerecker and co-workers, promotion of tumor growth was even observed after DCA treatment in neuroblastoma tumors [22]. These studies indicate that response to DCA treatment may drastically vary among tumor types.
The redirection of glucose metabolism from glycolysis to oxidation leading to the inhibition of proliferation and the induction of caspase-mediated apoptosis was initially proposed as the generic mechanism of action of DCA. In a recent phase I study in patients with advanced solid tumors, decreased 18F-FDG uptake was observed after DCA therapy, supporting the use of 18F-FDG uptake as a potential biomarker of response to DCA [20]. Also, hyperpolarized 13C-pyruvate MRI has already been used in several preclinical studies to monitor DCA effect in solid tumors [13–15], but also in cardiac [23, 24] and brain studies [25, 26]. In the present study, 18F-FDG uptake was unchanged after DCA treatment (Figure 2E). This suggests that DCA treatment does not impair glucose uptake and phosphorylation but could potentially impact downstream transformation of glucose. However, no effects on bicarbonate production were detected that could demonstrate changes in energy metabolism from glycolysis to oxidative phosphorylation (Supplementary Figure S3). Recent findings suggested that DCA may also act by other mechanisms. While a possible disruption of the balance between fatty acid β-oxidation and glucose oxidation has already been suggested as an additional mechanism involved in the overall effects of DCA in vivo (as reviewed by [27]), PDK inhibitors may potentially induce other compensatory mechanisms that could limit the impact of such drugs on global tumor metabolism. The anti-cancer effects of DCA appear to rely on multiple mechanisms depending on the drug concentration, drug administration scheme [28] and cell type [29]. Also, a change in PDK isoform expression between in vitro and in vivo model could also greatly influence the effect of DCA on tumor metabolism in vivo. Indeed, oncogene regulation and tumor microenvironment, like extracellular acidosis, can affect PDK isoform expression [30], possibly leading to the expression of a PDK isoform less sensitive to DCA effects. Our findings are consistent with a recent study highlighting that tumor microenvironment could be as important as the (epi) genetic profile to shape the tumor phenotype [31]. Further investigations using relevant isogenic cell clones with ability to form tumors in vivo should be considered to determine the effects of DCA on energy metabolism in vivo.
In conclusion, our multi-modality imaging study identified major discordances between in vitro and in vivo metabolic responses to DCA treatment, in cancer models presenting distinct metabolic profiles. Results suggest preferring implanted tumors and spontaneous cancer models to study DCA treatment within the milieu of the tumor microenvironment. Overall, further investigations are required to elucidate the impact of different tumor microenvironments on metabolic effects of DCA and its impact for clinical use.
MATERIALS AND METHODS
Cell culture
MDA-MB-231 (human breast cancer) and SiHa (human cervix squamous cell carcinoma) cell lines (American Type Culture Collection [ATCC]), were routinely cultured in Dulbecco’s modified Eagle’s medium containing 4.5g/l glucose supplemented with 10% fetal bovine serum and 1% penicillin-streptomycin.
Animal housing
Animal studies were undertaken in accordance with Belgian and the Université catholique de Louvain ethical committee regulations (agreements number UCL/2010/MD/001 and UCL/2014/MD/026). Hyperpolarized 13C-MRI experiments were carried out in compliance with the Guide for the Care and Use of Laboratory Animal Resources (National Research Council, 1996) and approved by the National Cancer Institute (NCI) Animal Care and Use Committee.
Tumor implantation and animal experiments
A total of 107 MDA-MB-231 cells or 107 SiHa cells, amplified in vitro, were collected by trypsinization, washed three times with Hanks balanced salt solution and resuspended in 200 μL of a 1:1 mixture of Matrigel (BD Biosciences) and Hanks balanced salt solution. For 17O MRS and PET scan experiments, the tumor cells were inoculated subcutaneously into the hind thigh of nude NMRI female mice (Janvier Le Genest-Saint-Isle, France). For hyperpolarized 13C-MRI experiments, the tumor cells were inoculated subcutaneously into the hind thigh of athymic nude female mice (Frederick Cancer Research Center, Animal Production, Frederick, MD, USA). The experiments were performed when tumors reached 7 mm (at this tumor size, necrosis was less than 5% as characterized by Hematoxylin Eosin staining).
To assess the effects of DCA on tumor metabolism using biomarkers, all animals have undergone imaging before and after treatment, with one day between each measurement. Dichloroacetate sodium (Sigma-Aldrich) was administered intraperitoneally (200 mg/kg) after baseline measurements to the mouse. Another dose was given 24 hours after the first dose injection. Post-treatment measurements were initiated 1 hour after treatment administration. This administration scheme is consistent with previous studies attesting the effects of DCA in tumors using hyperpolarized 13C-MRI [13, 15]. The imaging protocol is summarized in Figure 5.
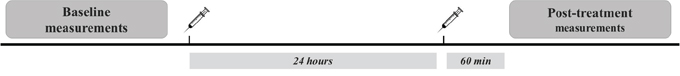
Figure 5: Experimental protocol.
Mice were anesthetized by isoflurane inhalation (Forene, Abbot, England) mixed with air in a continuous flow (2 L/min). Animals were warmed (approximately 35°C) throughout the anesthesia period.
17O MRS experiments
For oxygen consumption experiments, 17O MRS was performed on an 11.7 T (Bruker, Biospec) controlled by Paravision 6.0 (Bruker, Ettlingen, Germany). Experiments were carried out using a 1H/17O Bruker surface coil system positioned over the tumor mass. Anatomical images were firstly acquired using a T2-weighted axial turbo RARE sequence (TR = 2500ms; TE = 30ms; rare factor = 8; NA = 2; FOV = 25x25mm2; resolution: 98 x 98 μm2; 1 mm slice thickness). 17O MRS measurements were carried out using a nonlocalized, single-pulse sequence (TR = 16.5 ms; NA = 600; repetition: 120; Tacq = 20 min; Acq BW = 5000 Hz; FA = 20°). For 17O MRS sequence, the 90° reference pulse was optimized previously on natural abundance H217O samples.
To measure tumor oxygen consumption during the 17O2 delivery, a total of 120 17O-spectra were collected in about 20 min, before, during and after a 2 min inhalation period of the 17O2 mixture. The integrals of the H217O peaks over time were measured using a home-made program written in Matlab (The MathWorks Inc., Natick, MA, USA). H217O signal was then expressed as relative to the mean baseline signal before 17O2 delivery. The mean signal of the final steady state (sfinal) during the post-inhalation period was calculated between 1100 and 1200 s. We considered that the steady state was reached when the signal stood between sfinal ± 5 % of signal variation. The slope during the linear incorporation phase was measured between 600 sec and the time point when steady state was reached.
PET/CT imaging
Whole-body PET imaging was performed on a dedicated small-animal PET scanner (Mosaic, Philips Medical Systems, Cleveland, USA) with a spatial resolution of 2.5 mm (FWHM). The PET scans were followed by whole-body acquisitions using a helical CT scanner (NanoSPECT/CT Small Animal Imager, Bioscan Inc., DC, USA). For each breathing condition, anesthetized mice were injected 120 μl intraperitoneally with 11.1-14.8 MBq of 18F-FDG (Betaplus Pharma, Brussels, Belgium). A 10 min transmission scan was first obtained in a single mode using a 370 MBq 137Cs source for attenuation correction. A 10 min static PET acquisition was then performed after a 60 min resting period. After the correction with attenuation factors obtained from the transmission scan, images were reconstructed using a fully 3D iterative algorithm (3D-RAMLA) in a 128 x 128 x 120 matrix, with a voxel size of 1 mm3. After PET acquisition, anesthetized animals were transferred on the same bed from the PET scanner to the CT scanner (x-ray tube voltage: 55 kVp; number of projections: 180; exposure time 1000 ms) for anatomical reference. The CT projections were reconstructed with a voxel size of 0.221 x 0.221 x 0.221 mm3. Regions of Interest (ROIs) were delineated on PET images using PMOD software (PMODTM, version 3.403, PMOD technologies Ltd, Zurich, Switzerland). 2D ROIs were established on consecutive transversal slices using a 50% isocontour tool (ROI including the pixel values larger than 50% of the maximum pixel) that semi-automatically defined a 3D Volume of Interest (VOI) around the tissue of interest. To avoid overestimation of the uptake within the VOI, PET/CT fused images where used to discriminate hot pixels coming from the neighboring tissues like urinary bladder. Using the mean uptake within this VOI, the global tracer uptake was assessed in tumors and expressed as percentage of injected dose per gram of tissue (%ID/g).
Hyperpolarized 13C-MRI studies
1-13C pyruvic acid (30 μL), containing 15 mM OXO63 and 2.5 mM gadolinium chelate ProHance (Bracco Diagnostics, Milano, Italy), was hyperpolarized at 3.35T and 1.4K using the Hypersense DNP polarizer (Oxford Instruments, Abingdon, UK) according to the manufacturer’s instructions. After 60-90 min, the hyperpolarized sample was rapidly dissolved in 4.5 mL of a superheated alkaline buffer that consisted of 50 mM Tris(hydroxymethyl)aminomethane, 75 mM NaOH, and 100 mg/L ethylenediaminetetraacetic acid. The hyperpolarized 1-13C pyruvate solution (96 mM) was intravenously injected through a catheter placed in the tail vein of the mouse (12 μL/g body weight). Hyperpolarized 13C MRI studies were performed on a 3T scanner (MR Solutions, Guildford, UK) using a home-built 13C solenoid leg coil. After the rapid injection of hyperpolarized 1-13C pyruvate, spectra were acquired every second for 240 seconds using a single pulse sequence. Data were analyzed in a model free approach using the lactate/pyruvate ratio, calculated from the areas under the curves of the 1-13C lactate peak and the 1-13C pyruvate peak [15].
Statistical analysis
Analysis was performed using the GraphPad Prism 7 software. Results are expressed as means value of parameter ± SEM. All statistical tests were two-sided. Paired t-test was used to compare mean changes between groups (baseline vs. post-treatment) for each tumor model, and unpaired t-test was used to compare mean changes between the two tumor models. Results with P < 0.05 (*), <0.01 (**), or <0.001 (***) were considered to be statistically significant.
ACKNOWLEDGMENTS
This work was supported by grants from the Belgian National Fund for Scientific Research (F.S.R.-FNRS; PDR T.0107.13); the Action de Recherches Concertées ARC 14/19-058; Belgian Science Policy Office Interuniversity Attraction Pole IUAP #P7/03; and intramural National Institute of Health (NIH) funds.
CONFLICTS OF INTEREST
The authors have no conflicts of interest to declare.
REFERENCES
1. Gatenby RA, Gillies RJ. Why do cancers have high aerobic glycolysis? Nature reviews Cancer. 2004; 4:891-899.
2. López-Lázaro M. The Warburg Effect: why and how do cancer cells activate glycolysis in the presence of oxygen? Anticancer Agents Med Chem. 2008; 8:305-312.
3. Upadhyay M, Samal J, Kandpal M, Singh OV, Vivekanandan P. The Warburg effect: insights from the past decade. Pharmacology & therapeutics. 2013; 137:318-330.
4. Tennant DA, Duran RV, Gottlieb E. Targeting metabolic transformation for cancer therapy. Nature reviews Cancer. 2010; 10:267-277.
5. Porporato PE, Dhup S, Dadhich RK, Copetti T, Sonveaux P. Anticancer targets in the glycolytic metabolism of tumors: a comprehensive review. Frontiers in pharmacology. 2011; 2:49.
6. Figueiras RG, Padhani AR, Goh VJ, Vilanova JC, Gonzalez SB, Martin CV, Caamano AG, Naveira AB, Choyke PL. Novel oncologic drugs: what they do and how they affect images. Radiographics: a review publication of the Radiological Society of North America, Inc. 2011; 31:2059-2091.
7. Serkova NJ. Translational imaging endpoints to predict treatment response to novel targeted anticancer agents. Drug resistance updates: reviews and commentaries in antimicrobial and anticancer chemotherapy. 2011; 14:224-235.
8. Vander Heiden MG. Targeting cancer metabolism: a therapeutic window opens. Nature reviews Drug discovery. 2011; 10:671-684.
9. De Preter G, Neveu MA, Danhier P, Brisson L, Payen VL, Porporato PE, Jordan BF, Sonveaux P, Gallez B. Inhibition of the pentose phosphate pathway by dichloroacetate unravels a missing link between aerobic glycolysis and cancer cell proliferation. Oncotarget. 2016; 7:2910-2920. doi: 10.18632/oncotarget.6272.
10. Kankotia S, Stacpoole PW. Dichloroacetate and cancer: new home for an orphan drug? Biochimica et biophysica acta. 2014; 1846:617-629.
11. De Preter G, Danhier P, Porporato PE, Payen VL, Jordan BF, Sonveaux P, Gallez B. Direct Evidence of the Link Between Energetic Metabolism and Proliferation Capacity of Cancer Cells In Vitro. Advances in experimental medicine and biology. 2016; 876:209-214.
12. Sonveaux P, Vegran F, Schroeder T, Wergin MC, Verrax J, Rabbani ZN, De Saedeleer CJ, Kennedy KM, Diepart C, Jordan BF, Kelley MJ, Gallez B, Wahl ML, Feron O, Dewhirst MW. Targeting lactate-fueled respiration selectively kills hypoxic tumor cells in mice. The Journal of clinical investigation. 2008; 118:3930-3942.
13. Seth P, Grant A, Tang J, Vinogradov E, Wang X, Lenkinski R, Sukhatme VP. On-target Inhibition of Tumor Fermentative Glycolysis as Visualized by Hyperpolarized Pyruvate. Neoplasia. 2011; 13:60-71.
14. Park JM, Recht LD, Josan S, Merchant M, Jang T, Yen YF, Hurd RE, Spielman DM, Mayer D. Metabolic response of glioma to dichloroacetate measured in vivo by hyperpolarized (13)C magnetic resonance spectroscopic imaging. Neuro-oncology. 2013; 15:433-441.
15. Hill DK, Orton MR, Mariotti E, Boult JK, Panek R, Jafar M, Parkes HG, Jamin Y, Miniotis MF, Al-Saffar NM, Beloueche-Babari M, Robinson SP, Leach MO, Chung YL, Eykyn TR. Model Free Approach to Kinetic Analysis of Real-Time Hyperpolarized 13C Magnetic Resonance Spectroscopy Data. PLoS ONE. 2013; 8:e71996.
16. Neveu MA, Bol V, Bol A, Bouzin C, Gregoire V, Feron O, Jordan BF, Gallez B. The increase in tumor oxygenation under carbogen breathing induces a decrease in the uptake of [(18)F]-fluoro-deoxy-glucose. Radiotherapy and oncology: journal of the European Society for Therapeutic Radiology and Oncology. 2015; 116:400-403.
17. Stacpoole PW, Nagaraja NV, Hutson AD. Efficacy of Dichloroacetate as a Lactate-Lowering Drug. The Journal of Clinical Pharmacology. 2003; 43:683-691.
18. Bonnet S, Archer SL, Allalunis-Turner J, Haromy A, Beaulieu C, Thompson R, Lee CT, Lopaschuk GD, Puttagunta L, Bonnet S, Harry G, Hashimoto K, Porter CJ, Andrade MA, Thebaud B, Michelakis ED. A mitochondria-K+ channel axis is suppressed in cancer and its normalization promotes apoptosis and inhibits cancer growth. Cancer cell. 2007; 11:37-51.
19. Dunbar EM, Coats BS, Shroads AL, Langaee T, Lew A, Forder JR, Shuster JJ, Wagner DA, Stacpoole PW. Phase 1 trial of dichloroacetate (DCA) in adults with recurrent malignant brain tumors. Investigational new drugs. 2014; 32:452-464.
20. Chu QS, Sangha R, Spratlin J, Vos LJ, Mackey JR, McEwan AJ, Venner P, Michelakis ED. A phase I open-labeled, single-arm, dose-escalation, study of dichloroacetate (DCA) in patients with advanced solid tumors. Investigational new drugs. 2015; 33:603-610.
21. Garon EB, Christofk HR, Hosmer W, Britten CD, Bahng A, Crabtree MJ, Hong CS, Kamranpour N, Pitts S, Kabbinavar F, Patel C, von Euw E, Black A, Michelakis ED, Dubinett SM, Slamon DJ. Dichloroacetate should be considered with platinum-based chemotherapy in hypoxic tumors rather than as a single agent in advanced non-small cell lung cancer. Journal of cancer research and clinical oncology. 2014; 140:443-452.
22. Feuerecker B, Seidl C, Pirsig S, Bruchelt G, Senekowitsch-Schmidtke R. DCA promotes progression of neuroblastoma tumors in nude mice. Am J Cancer Res. 2015; 5:812-820.
23. Josan S, Park JM, Hurd R, Yen YF, Pfefferbaum A, Spielman D, Mayer D. In vivo investigation of cardiac metabolism in the rat using MRS of hyperpolarized [1-13C] and [2-13C]pyruvate. NMR in biomedicine. 2013; 26:1680-1687.
24. Dodd MS, Ball V, Bray R, Ashrafian H, Watkins H, Clarke K, Tyler DJ. In vivo mouse cardiac hyperpolarized magnetic resonance spectroscopy. Journal of cardiovascular magnetic resonance: official journal of the Society for Cardiovascular Magnetic Resonance. 2013; 15:19.
25. Hu S, Yoshihara HA, Bok R, Zhou J, Zhu M, Kurhanewicz J, Vigneron DB. Use of hyperpolarized [1-13C]pyruvate and [2-13C]pyruvate to probe the effects of the anticancer agent dichloroacetate on mitochondrial metabolism in vivo in the normal rat. Magnetic resonance imaging. 2012; 30:1367-1372.
26. Park JM, Josan S, Grafendorfer T, Yen YF, Hurd RE, Spielman DM, Mayer D. Measuring mitochondrial metabolism in rat brain in vivo using MR Spectroscopy of hyperpolarized [2-(1)(3)C]pyruvate. NMR in biomedicine. 2013; 26:1197-1203.
27. Sutendra G, Michelakis ED. Pyruvate dehydrogenase kinase as a novel therapeutic target in oncology. Frontiers in oncology. 2013; 3:38.
28. Fedorchuk AG, Pyaskovskaya ON, Gorbik GV, Prokhorova IV, Kolesnik DL, Solyanik GI. Effectiveness of sodium dichloroacetate against glioma C6 depends on administration schedule and dosage. Exp Oncol. 2016; 38:80-83.
29. Stockwin LH, Yu SX, Borgel S, Hancock C, Wolfe TL, Phillips LR, Hollingshead MG, Newton DL. Sodium dichloroacetate selectively targets cells with defects in the mitochondrial ETC. International Journal of Cancer. 2010; 127:2510-2519.
30. Papandreou I, Goliasova T, Denko NC. Anticancer drugs that target metabolism: Is dichloroacetate the new paradigm? International journal of cancer. 2011; 128:1001-1008.
31. Neveu MA, De Preter G, Marchand V, Bol A, Brender JR, Saito K, Kishimoto S, Porporato PE, Sonveaux P, Grégoire V, Feron O, Jordan BF, Krishna MC, Gallez B. Multimodality imaging identifies distinct metabolic profiles in vitro and in vivo. Neoplasia. In press.