
INTRODUCTION
Hepatocellular carcinoma (HCC) is the fifth most common type of cancer and the third leading cause of cancer-related deaths worldwide [1]. Understanding the molecular mechanism involved in the development and progression of HCC is imperative for the development of more efficacious therapeutic strategies, given that the worldwide incidence of HCC, a type of cancer with a poor 5-year survival rate (at the late stage) and high rate of recurrence (after surgical resection) [2], stands at over one million. The development and progression of HCC is a long-term multistep process, comprising chronic liver injury, necro-inflammation and regeneration, small cell dysplasia, and the appearance of low- and high-grade dysplastic nodules [3, 4].
Early research studies concluded that HCC is a result of the stepwise accumulation of genetic alterations in oncogenes and tumor suppressor genes, which in turn led to the regulation of cell proliferation, growth, survival, apoptosis, adhesion, and metabolism [5]. However, growing evidence has indicated the added involvement of DNA methylation and regulation of miRNA in the development of HCC [6]. Presently, HCC is recognized as a genetic and epigenetic disease; that is, both genetic and epigenetic components are believed to be involved in all stages of liver carcinogenesis [7].
DNA promoter methylation, an important process for transcriptional regulation and cellular differentiation, is a common mechanism of gene silencing in cancer cells [8]. Recent studies have specifically focused on cancer-linked gene-specific DNA hypermethylation or hypomethylation. According to the report in [7], several studies have indicated that some tumor suppressors, involved in the regulation of vital biological processes such as cell-cycle, apoptosis, and cell proliferation, are frequently methylated in HCC. On the other hand, tumor-promoting genes that play a critical role in cell growth, communication, adhesion and mobility, signal transduction, and drug resistance have also been shown to be significantly hypomethylated.
miRNAs are small, evolutionarily conserved, single-stranded molecules that are approximately 22 nucleotides in length, which regulate gene expression by binding to complementary sequences in the 3′ untranslated region (UTR) of target messenger RNA (mRNA); this generally results in their degradation or translational inhibition [9, 10]. More than 1000 miRNAs have been discovered in humans, each of which could target, on average, more than 200 genes [11, 12]. Recent reports suggest that miRNA play critical roles in HCC progression: for example, deregulation of miRNA could lead to irregular cell proliferation, evasion of apoptotic cell death, angiogenesis, and invasion and metastasis, by targeting a large number of protein-coding genes [13, 14]. In addition, detection of the level of miRNA in the blood plasma and serum could allow for earlier cancer diagnosis, accurate prediction of prognosis, and better response to therapy [15]. Despite recognizing their importance in regulating the expression of protein-coding genes, the precise functions of miRNA remain elusive [12].
A number of studies conducted over the past few years have implicated both genetic and epigenetic events in the development and progression of HCC; however, the results of most of these studies do not reach a consensus, given that cancer is a complex system. In fact, a recent review has suggested that many of these studies focus narrowly on the specific effect of a given miRNA on a specific mRNA, rather than the panoramic view of an extensive network [10].
In order to construct GRN or PPIN, correlation coefficients of expressions between genes remain the most used method to investigate hepatocarcinogenesis [16–18]. However, the correlation networks have undirected edges and no causality among whole genes. In this study, we applied a system identification method and a system order detection scheme to network models, which could characterize molecular mechanisms in gene regulatory network (GRN) and protein-protein interaction network (PPIN), to identify the real genetic and epigenetic network (GEN) using candidate GEN, NGS data, and DNA methylation profiles in normal liver cells and HCC.
Since the further analysis of a large-scale network is complex, the core network should be extracted from the real GEN to analyze the core mechanism of hepatocarcinogenesis. Up to now, the core network was still identified by the network hubs to investigate the core mechanism of carcinogenesis [18, 19]. Because we could identify the connection weights of the real GEN using genome-side expression data, we applied a principal network projection (PNP) method based on principal component analysis (PCA) to the real GEN to extract the core network from the viewpoint of significant large-scale network structure. By comparing two core networks from a perspective of signal transduction pathways, we suggested that the differences in epigenetic miRNA regulation and methylation may be the major factor involved in the mechanism of HCC progression. We have also suggested drug molecules specific for multiple target genes that are aberrantly methylated, or miRNA that are deregulated, in HCC, to prevent disease progression. Therefore, the proposed GEN construction and PNP method could be used to propose novel drug targets for HCC therapy, in addition to providing insight into the mechanism of HCC progression.
RESULTS
The flowchart of the construction of GENs to analyze the mechanism of hepatocarcinogenesis progression and multiple-drug design is summarized in Figure 1. GENs of the various stages of HCC were constructed as shown in Figures S1–S4. PNP led to the extraction of four core GENs for each stage of HCC (Figure 2A–2D). In order to validate the results in this study, we used the validation set from a published microarray data set in [20] that included 102, 100, and 38 tissue samples from subjects with HCC stage I, II, and III, respectively. Because, in order to validate the real GRN by applying the model in (1), simultaneous measurement of gene expression and DNA methylation profiles in each tissue sample were required, we only validated the PPINs of the real GENs in HCC stage I, II, and III using the validation set. By comparing the real PPINs in Figures S1–S3 identified by using the data from TCGA with the real PPINs identified by using the validation set from [20], the results show 74.44%, 72.6%, and 71.08% polarity consistency of network edges, which were not pruned by AIC model order detection and have unchanged signs, in HCC stage I, II, and III, respectively. By also applying PNP to the real PPINs identified by the validation set in HCC stage I, II, and III, the projection distance in the PPINs identified by using validation set was highly correlated with the results in this study in HCC stage I (R2 = 0.909), II (R2 = 0.928), and III (R2 = 0.902) (Figure S5). Although the sample size of HCC stage III in the validation set, and HCC stage II and III in this study is smaller than 100, the proposed methods apply the system identification and system order detection to the system models of GEN in (1)–(2) to identify the real GEN and then apply PNP to the real GEN to provide robust results to extract the core GEN. These results support the notion that projection distance, as evaluation tools for the core GEN of the integrated genetic and epigenetic network, can achieve acceptable reliability in performance.
Furthermore, we plot p-value (log10) versus projection distance (log2) of each component (Figure S6) in HCC stage 1–4 (Figures S1–S4). Although the result in Figure S6 shows that the relationship between p-value (log10) and projection distance (log2) is not linear, the core GENs of HCC stages 1–4 (Figure 2A–2D) only have 13, 10, 5, and 41 components with insignificant p-value (> 0.05). It means that by applying the projection distance in (15) to the GEN of each HCC stage we can obtain the core GEN with a high proportion of differentially expressed genes (> 90%).
The pathways involved in the core PPIs of GENs were investigated using the DAVID (https://david.ncifcrf.gov/) and PANTHER tools, which were used to identify the pathways of the core proteins at each stage and to identify the biological processes of the target genes at each stage, respectively. From these results, pathways containing TFs in core proteins, which simultaneously have target genes in core genes, were selected to investigate the progression of HCC.
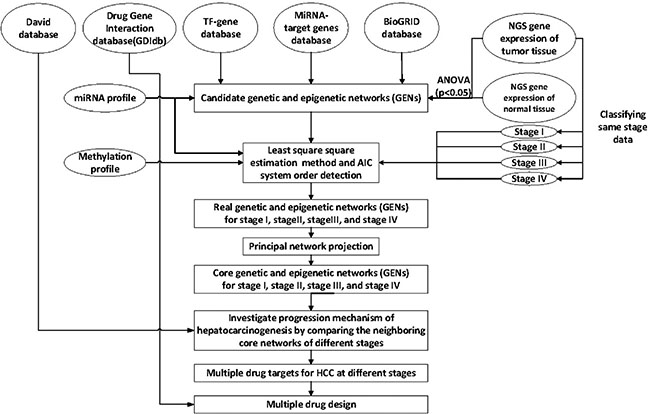
Figure 1: Overview of the construction of genetic and epigenetic networks (GENs) and core GEN to analyze the mechanism of hepatocarcinogenesis progression and multiple-drug design, via big database mining and system identification. NGS profiles of HCC and normal tissue samples, miRNA and DNA methylation data, and the miRNA, TF-gene, and BioGRID databases were searched to construct candidate GENs, including candidate GRN, PPIN, and miRNA-gene regulatory networks. The false positive candidate GENs were pruned by system modeling and least square estimation, wherein the insignificant components were deleted from the system order based on AIC. The core GENs for each stage were obtained by extracting the principal structure of GENs through PNP. By mapping the core GENs to pathways retrieved using DAVID, and by comparing core GENs among the different stages, we investigated the mechanism of HCC progression. We also proposed potential therapeutic drugs against genes encoding significant epigenetic changes, in order to arrest the progression of HCC, by mining the DGIdb.
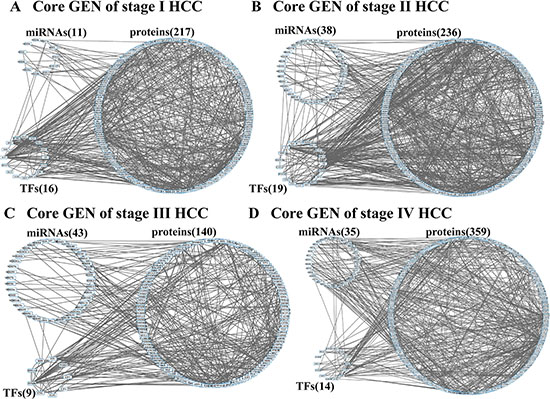
Figure 2: Core GENs of stage I (A), stage II (B), stage III (C), and stage IV (D) HCCs extracted by PNP method.
Pathway analysis of core proteins and the impact of epigenetic miRNA and DNA methylation on core GEN of stage I HCC
The PNP method was used to isolate the core GEN of stage 1 HCC. The pathways regulated by the core proteins were identified and analyzed using the bioinformatics database DAVID, which analyzed the proteins and retrieved relevant results from the Kyoto Encyclopedia of Genes and Genomes (KEGG) database. By applying the criteria p-value ≤ 0.05 and the number of proteins ≥ 5, we can obtain the enriched pathways of core proteins in the GEN of each HCC stage. The results of this analysis are summarized in Table 1; the neurotrophin signaling, B cell receptor signaling, ErbB signaling, T cell receptor signaling, Wnt signaling, MAPK signaling, and chemokine signaling pathways and cancer-related pathways were found to be enriched.
Some of these pathways, however, could influence downstream genes regulated by TFs. Therefore, we focused on pathways containing TFs in core proteins that have target genes in core genes. Figure 3 showed that both the ErbB and MAPK pathways contain MYC, a TF, which is encoded by target areas in core genes. This allowed us to analyze the effect of miRNA and DNA methylation on these pathways; we determined that dysfunctions in these processes might cause an aberration in the function of downstream target genes. This will be discussed in further detail in the Discussion section.
Table 1: Pathway analysis of core proteins in the GEN of stage I HCC
Pathway analysis |
||
|---|---|---|
KEGG pathway |
Numbers |
p-value |
Pathways in cancer |
16 |
1.4E-3 |
MAPK signaling pathway |
12 |
9.0E-3 |
Neurotrophin signaling pathway |
11 |
1.4E-4 |
Wnt signaling pathway |
9 |
5.0E-3 |
Chemokine signaling pathway |
9 |
3.0E-2 |
ErbB signaling pathway |
8 |
3.5E-3 |
B cell receptor signaling pathway |
8 |
6.1E-4 |
T cell receptor signaling pathway |
8 |
1.7E-3 |
The enriched KEGG pathways in this GEN are the neurotrophin signaling pathway, B cell receptor signaling pathway, ErbB signaling pathway, pathways in cancer, T cell receptor signaling pathway, Wnt signaling pathway, MAPK signaling pathway, and chemokine signaling pathway.
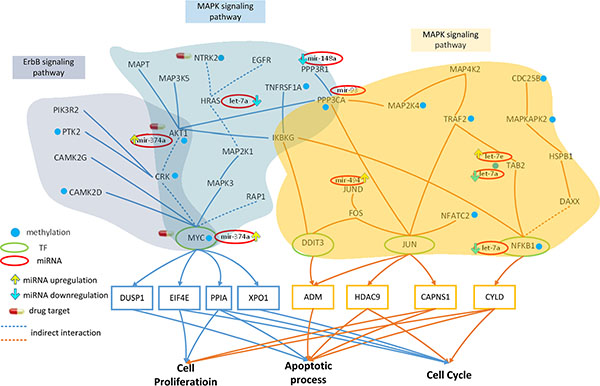
Figure 3: Effect of miRNA regulation and DNA methylation on the mechanism of progression of HCC from stage I to stage II. The blue frames and lines represent stage I HCC, while the yellow frames and lines represent stage II HCC. Blue nodes represent DNA methylation. The green and red ovals represent transcription factors (TFs) and miRNAs, respectively. The upward yellow arrowhead represents miRNA upregulation during stage II HCC, compared to that in stage I. The downward blue arrowhead represents miRNA downregulation in stage II compared to that in stage I. AKT1, RTK2, HRAS, CAMK2G, CAMK2D, PI3KR2, CRK, and MYC are involved in the ErbB signaling pathway and AKT1, TNFRSF1A, HRAS, MAP3K5, MAPT, IKBKG, NTRK2, PPP3R1, RAP1A, PPP3CA, CRK, and MYC are involved in the MAPK signaling pathway during HCC stage I. The transcription factor MYC is activated by a number of stress signals, including the ErbB pathway and MAPK signaling pathway, which induce various cellular responses, including cell proliferation, apoptosis, and cell cycle. TRAF2, MAP2K4, MAP4K2, NFKB1, MAPKAPK2, DAXX, TAB2, DIT3, CDC25B, FOS, JUN, JUND, IKBKG, HSPB1, PPP3CA, and NFATC2 regulate the MAPK signaling pathway during HCC stage II. The transcription factors DDIT3, JUN, and NFKB1 are activated by a number of stress signals including the MAPK signaling pathway, which induces cell proliferation, apoptosis, and cell cycle. miRNA and DNA methylation induced dysregulation may contribute to the perturbation of the MAPK and ErbB pathway, resulting in aberrant cellular responses and HCC progression from stage I to stage II. Obviously, the shift from the ErbB pathway to the MAPK pathway, owing to the differences in epigenetic miRNA regulation and methylation could be responsible for disease progression. In this study, NTRK2, CDC25B, and HRAS were selected as potential drug targets to prevent the progression of HCC from stage I to stage II.
Pathway analysis of core proteins and the impact of epigenetic miRNA and DNA methylation on core GEN of stage II HCC
The same analysis procedure as above was also applied to identify the core GEN of stage II HCC, and the results of pathway analysis are summarized in Table 2. The enriched KEGG pathways of stage II HCC included the MAPK signaling, B cell receptor signaling, and toll-like receptor signaling pathways, and cancer-related pathways.
We further identified the TFs DDIT3, JUN, and NFKB1 in the MAPK pathway, encoded by target regions in core genes (Figure 4). This allowed for the analysis of the effect of miRNA and DNA methylation on the MAPK pathway; moreover, we determined that dysfunctions in these processes might contribute to aberrant downstream target gene function.
Table 2: Pathway analysis of core proteins in the GEN of stage II HCC
Pathway analysis |
||
|---|---|---|
KEGG pathway |
Numbers |
p-value |
MAPK signaling pathway |
17 |
2.75E-5 |
Pathways in cancer |
16 |
9.8E-4 |
B cell receptor signaling pathway |
7 |
3.0E-3 |
Toll-like receptor signaling pathway |
7 |
1.1E-2 |
The enriched KEGG pathways of this GEN included the MAPK signaling pathway, pathways in cancer, B cell receptor signaling pathway, and Toll-like receptor signaling pathway.
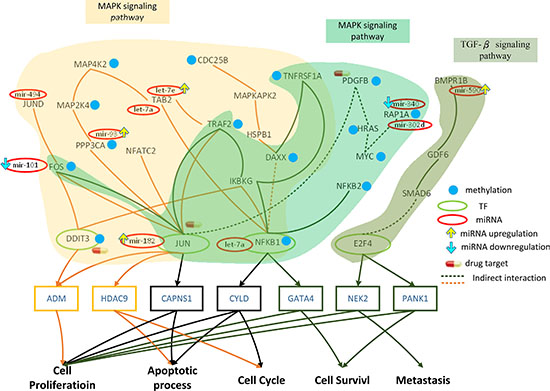
Figure 4: Role of miRNA regulation and DNA methylation on the mechanism of progression of HCC from stage II to stage III. The yellow frames and lines represent stage II HCC, while the dark green frames and lines represent stage III HCC. Blue nodes represent DNA methylation. Dark lines and frames represent components observed in both stage II and stage III. The green and red ovals represent transcription factors (TFs) and miRNAs, respectively. The upward yellow arrowhead represents miRNA upregulation during stage III HCC, compared to that in stage II. The downward blue arrowhead represents miRNA downregulation in stage III compared to that in stage II. TRAF2, MAP2K4, MAP4K2, NFKB1, MAPKAPK2, DAXX, TAB2, DIT3, CDC25B, FOS, JUN, JUND, IKBKG, HSPB1, PPP3CA, and NFATC2 are involved in the MAPK signaling pathway during stage II HCC. The transcription factors DDIT3, JUN, and NFKB1 are activated by a number of stress signals including the MAPK signaling pathway, which induces cell proliferation, apoptosis, and cell cycle. TRAF2, TNFRSF1A, FOS, HRAS, PDGFB, JUN, IKBKG, RAP1A, NFKB1, NFKB2, and DAXX are involved in the MAPK signaling pathway, whereas E2F4, GDF6, SMAD6, PPP2CB, and BMPR1B regulate the TGF-β pathway during stage III HCC. The transcription factors JUN, NFKB1, and E2F4 are activated by stress signals, including the MAPK signaling and TGF-β pathways, inducing cellular responses such as cell proliferation, apoptosis, cell cycle, cell survival, and metastasis. miRNA and DNA methylation dysregulation may contribute to the perturbation of the MAPK and TGF-β pathway, resulting in aberrant cellular responses and HCC progression from stage II to stage III. Obviously, the perturbation of the MAPK pathway and the activation of the TGF-β pathway owing to the differences in epigenetic miRNA regulation and DNA methylation may be the major mechanism of HCC progression from stage II to stage III. DDIT3, PDGFB, and JUN were selected as potential drug targets to prevent the progression of HCC from stage II to stage III.
Pathway analysis of core proteins and impact of epigenetic miRNA and DNA methylation on core GEN of stage III HCC
The PNP method was used to identify the core GEN of stage III HCC, and the pathways regulated by the core proteins were identified using the DAVID tool. The results of pathway analysis are summarized in Table 3. The enriched KEGG pathways of stage III HCC were the adipocytokine signaling, neurotrophin signaling, MAPK signaling, B cell receptor signaling, and the TGF-β signaling pathways.
We further identified the TFs in various signaling pathways, encoded by target regions in core genes (Figure 4), as follows: JUN and NFKB1 in the MAPK pathway, and E2F4 in the TGF-β. This allowed us to analyze the effect of miRNA and DNA methylation on the MAPK and TGF-β pathways; we determined that dysfunctions in these processed might cause an aberration in the function of downstream target genes.
Table 3: Pathway analysis of core proteins in the GEN of stage III HCC
Pathway analysis |
||
|---|---|---|
KEGG pathway |
Numbers |
p-value |
MAPK signaling pathway |
12 |
1.6E-3 |
Neurotrophin signaling pathway |
10 |
7.4E-5 |
Adipocytokine signaling pathway |
8 |
4.9E-5 |
B cell receptor signaling pathway |
6 |
4.7E-3 |
TGF-β signaling pathway |
6 |
8.8E-3 |
The enriched KEGG pathways included the adipocytokine signaling pathway, neurotrophin signaling pathway, MAPK signaling pathway, B cell receptor signaling pathway, and TGF-β signaling pathway.
Pathway analysis of core proteins and impact of epigenetic miRNA and DNA methylation on core GEN of stage IV HCC
The PNP method was used to identify the core GEN of stage IV HCC, and the pathways regulated by the core proteins were identified using the DAVID tool. The results of pathway analysis are summarized in Table 4. The enriched KEGG pathways included the adipocytokine signaling, toll-like receptor signaling, Jak-STAT signaling, and the MAPK signaling pathways.
We further identified the TFs NFKB1 and STAT3 in the MAPK and Jak-STAT pathways, encoded by target regions in core genes (Figure 4). This allowed for the analysis of the effect of miRNA and DNA methylation on the MAPK and Jak-STAT pathways; moreover, we determined that dysfunctions in these processes might contribute to aberrant downstream target gene function.
Table 4: Pathway analysis of core proteins in the GEN of stage IV HCC
Pathway analysis |
||
|---|---|---|
KEGG pathway |
Numbers |
p-value |
MAPK signaling pathway |
9 |
3.0E-3 |
Jak-STAT signaling pathway |
7 |
1.6E-3 |
Toll-like receptor signaling pathway |
6 |
7.4E-5 |
Adipocytokine signaling pathway |
5 |
4.9E-5 |
The enriched KEGG pathways identified in this GEN are the adipocytokine signaling pathway, Toll-like receptor signaling pathway, Jak-STAT signaling pathway, and MAPK signaling pathway.
Comparison between the results with the Ingenuity Pathway Analysis and GeneGO Meta-Core software
The Ingenuity Pathway Analysis (IPA 7.0) has been used to identify the core genes, including TF, APOA1, FLNA, and HNF4A, which are associated with HCC by comparing the mRNA expressions of normal liver cells and HCC [21]. APOA1 has also been identified in the real GENs at four stages of HCC (Figures S1–S4) and in the core GEN of stage III HCC (Figure 2C).
Moreover, the core genes, including DAPK1, BCL2, TP53, and CCND2, have also been identified using GeneGO Meta-Core software (Encinitas, CA) to compare the mRNA expressions of normal liver cells and HCC [22]. DAPK1, BCL2-like 12 (BLC2L12) and p53- inducible gene 3 (TP53I3) have also been identified in the real GENs at four stages of HCC (Figures S1–S4). DAPK1 has been identified in the core GEN of stage I HCC (Figure 2A).
Because we applied PNP to the real GENs at four stages of HCC, which contain the identified connection weights using genome-side expression data, to extract the core genes based on the principal structure of GENs, the identified core genes. The purpose of the identification of the core GENs in Figure 2A–2D is to integrate the transcriptionally and epigenetically impaired mechanisms of HCC progression from stage I to II, from stage II to III, and from stage III to IV from a perspective of signal transduction pathways. Thus, we compared the networks between Figure 2A–2B, Figure 2B–2C, and Figure 2C–2D, and extract the genes with the most different connections and top D(k) involved in significant network structure in (15) from receptors to TFs and their connected miRNAs and genes as the core proteins/genes/miRNAs to consist the core pathways in Figures 3–5. The core pathways from receptors to TFs (Figures 3–5) were obviously different from the core genes identified by high degree of interactions (hub genes) using IPA or GeneGO Meta-Core software.
DISCUSSION
Role of epigenetic miRNA regulation and DNA methylation on HCC progression from stage I to stage II
The core GEN in stage I HCC (Figure 2A) were mapped to KEGG pathways, and pathways containing TFs targeting core genes as shown in Figure 3. AKT1, PTK2, HRAS, CAMK2G, CAMK2D, PI3KR2, CRK, and MYC were found to be involved in the ErbB signaling pathway. Receptors of ErbB trigger a rich network of signaling pathways, culminating in responses ranging from cell division to death and motility to adhesion, which are often dysregulated in cancer [23]. Additionally, AKT1, TNFRSF1A, HRAS, MAP3K5, MAPT, IKBKG, NTRK2, PPP3R1, RAP1A, PPP3CA, CRK, and MYC were found to be involved in the MAPK signaling pathway. The MAPK signaling pathway regulates a number of cellular activities, including proliferation, differentiation, survival, and death. Dysregulation of the MAPK signaling pathway has been implicated in the development of many human diseases, including various types of cancers [24].
AKT1, HRAS, and MYC are inhibited by the miRNA mir-374a, let-7a, and mir-374a, respectively, in the ErbB signaling pathway (Figure 3). These genes are also inhibited by the same miRNA in the MAPK pathway; additionally, PPP3R1 and PPP3CA are inhibited by mir-148a and mir-93, respectively. Therefore, the dysregulation of these miRNA may interrupt these pathways, inducing aberrant target gene (MYC) function.
A comparison of the methylation level between stage I and stage II HCC (Figure 3) revealed that 5 and 2 genes were differentially methylated in the ErbB (ATK1, PTK2, CAMK2D, CRK, and MYC) and MAPK pathways (TNFRSF1A and NTRK2), respectively. AKT1 is involved in cell proliferation and survival [25], while CAMK2D, a member of the CAMK family, activates cancer cell proliferarion [26]. In fact, CRK proteins have been reported to be dysregulated in several human malignancies [27]. MYC, a proto-oncogene, is frequently dysregulated, and is therefore responsible for tumorigenesis in many types of cancer [28].
Extracellular and intracellular stimuli pass through the MAPK and ErbB signaling pathways to MYC, and regulates the cellular process via negative transcriptional regulation of its target genes, including DUSP1, EIF4E, PPIA, and XPO1 (Figure 3). DUSP1 is involved in apoptosis, while EIF4E regulates the cell proliferation and cell cycle. PPIA is involved in cell proliferation, apoptosis, and the cell cycle.
The core GEN of stage II HCC (Figure 2B) were mapped to the KEGG pathways, and pathways containing core TFs as well as the target genes were selected (Figure 3). TRAF2, MAP2K4, MAP4K2, NFKB1, MAPKAPK2, DAXX, TAB2, DIT3, CDC25B, FOS, JUN, JUND, IKBKG, HSPB1, PPP3CA, and NFATC2 were found to be involved in the MAPK signaling pathway. The MAPK pathway has been described previously.
Moreover, NFKB1, JUND, TAB, and PPP3CA were inhibited by the miRNA let-7a, mir-494, let-7a and let-7e, and mir-93, respectively. Dysregulation of these miRNA may induce changes in these pathways, resulting in aberrant function of the target genes DDIT3, JUN, and NFKB1.
We also found that 6 genes in stage II HCC were differentially methylated compared to that seen in stage I HCC (TRAF2, MAP2K4, NFATC2, MAPKAPK2, CDC25B, and PPP3CA; Figure 3). TRAF2 is a member of the TRAF protein family, which regulates cell death and cellular response to stress [29]. MAP2K4, and MAPKAPK2 belong to the MAPK family, which is involved in cell proliferation, differentiation, and apoptosis [30] , while CDC25B plays an important role in cell cycle, and is deregulated in several types of cancer [31].
Interestingly, although the MAPK signaling pathway also appears in stage II HCC, different TFs are involved in the cellular process. Extracellular and intracellular stimuli pass through the MAPK signaling pathway to DDIT3, JUN, and NFKB1, and thereby regulate the cellular process via negative transcriptional regulation of their target genes, ADM, HDAC9, CAPNS1, and CYLD (Figure 3). ADM, a reported tumor growth factor, regulates the apoptotic process [32]. HDAC9, a member of HDAC family, is linked to tumor development and regulates cell cycle and apoptosis [33]. CAPNS1 has been reported to play a role in tumor growth and metastasis, and regulates the apoptotic process and proliferation [34]. CYLD, a tumor suppressor, regulates the apoptotic process, proliferation, and cell cycle.
In conclusion, we identified several genes (AKT1, PTK2, CAMK2D, CRK and MYC in the ErbB pathway and TNFRSF1A, NTRK2, and MYC in the MAPK pathway) and miRNAs (mir-374a, let-7a, mir-148a, and mir-93) that were differentially methylated or dysregulated, causing the perturbation of the MAPK and ErbB pathways, resulting in the aberrant regulation of MYC on DUSP1, EIF4E, PPIA, and XPO1, and subsequent dysfunction in cellular processes, including cell proliferation, apoptosis, and cell cycle (Figure 3). In addition, the genes TRAF2, MAP2K4, NFATC2, MAPKAPK2, and CDC25B were differentially methylated and the miRNA let-7a, mir-494, let-7e, and mir-93 were dysregulated during stage II HCC, inducing MAPK pathway perturbation, which in turn resulted in the aberrant regulation of DDIT3, JUN, NFKB1 on their corresponding target genes, ADM, HDAC9, CAPNS1, and CYLD, and subsequent dysfunction in cell proliferation, apoptosis, and cell cycle. Obviously, the shift from the ErbB pathway to MAPK pathway (due to different epigenetic miRNA regulation and methylation), triggering changes in the cell responses via different TFs, may be the main mechanism of progression from stage I to stage II HCC.
Multiple drug molecules to prevent the progression of HCC from stage I to stage II based on the target genes of dysregulated miRNA and genes with methylation changes, as shown in Figure 3; moreover, the selected drug molecules should induce minimal side effects on other genes highlighted in Figure 3. The strategy to identify multiple drug molecules to prevent the progression of HCC from stage I to stage II is that we used the Drug-Gene Interaction database (DGIdb) to search drugs, which specifically interact one gene in Figure 3. According to the DGIdb [35] , lestaurtinib, dinaciclib, and perifosine specifically interact with NTRK2, MYC, and AKT1, respectively, and have a minimal side effect on the other genes. Additionally, the proposed drug molecules have proven anti-cancer effects [36–38]. Therefore, we designed a drug, comprising lestaurtinib, dinaciclib, and perifosine, to prevent the progression of HCC from stage I to stage II (Table 5).
The US Food and Drug Administration (FDA) approved orphan drug status for lestaurtinib and dinaciclib in the treatment of acute myeloid leukemia (AML) and chronic lymphoid leukemia (CLL), respectively. The FDA has approved Fast Track designation for perifosine in the treatment of refractory advanced colorectal cancer.
Table 5: Multi-drug design for the prevention of HCC progression from stage I to stage II, based on the progression mechanism elucidated in Figure 6
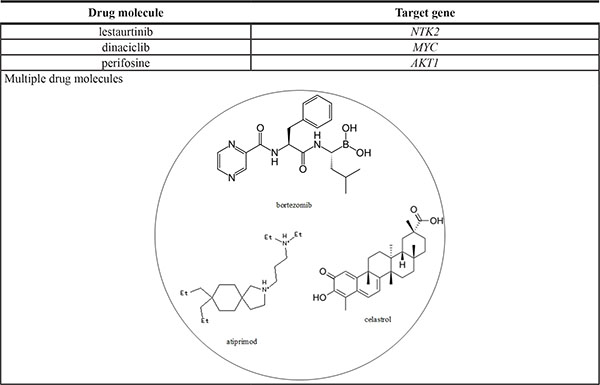
Lestaurtinib, dinaciclib, and perifosine were proposed to prevent HCC progression from stage I to stage II. The structures of these drug molecules (obtained from the ZINC database) are illustrated in the accompanying figure.
Role of epigenetic miRNA regulation and DNA methylation on HCC progression from stage II to stage III
The core genes in the GEN of stage II HCC (Figure 2B) were mapped to the KEGG pathways, and signaling pathways containing core TFs as well as core target genes were selected (Figure 4). TRAF2, MAP2K4, MAP4K2, NFKB1, MAPKAPK2, DAXX, TAB2, DIT3, CDC25B, FOS, JUN, JUND, IKBKG, HSPB1, PPP3CA, and NFATC2 have been found to be involved in the MAPK signaling pathway. The MAPK pathway and the impact of miRNA and DNA methylation on stage II HCC have been detailed in the previous section. In this section, we will focus the effect of miRNA regulation and DNA methylation on the signaling pathway, their corresponding TFs, and target genes of these TFs in stage III HCC.
By comparing the methylation levels between stage II and stage III (Figure 4), we identified 6 genes that were differentially methylated in stage III (TRAF2, MAP2K4, DAXX, DDIT3, CDC25B, and PPP3CA). DAXX is a multifunctional protein that regulates a wide range of cellular signaling pathways for cell survival and apoptosis [39], while DDIT3 plays a central role in endoplasmic reticulum stress and DNA damage response, by inducing cell cycle arrest and apoptosis [40].
The core GEN of stage III HCC (Figure 2C) was mapped to KEGG pathways, and pathways containing core TFs along with their target genes were selected (Figure 4). TRAF2, TNFRSF1A, FOS, HRAS, PDGFB, JUN, IKBKG, RAP1A, NFKB1, NFKB2, and DAXX were found to be involved in the MAPK signaling pathway. The MAPK signaling pathway has been detailed in the previous section. Moreover, E2F4, GDF6, SMAD6, PPP2CB, and BMPR1B were found to be involved in the TGF-β signaling pathway. The transforming growth factor β (TGF-β) superfamily signaling pathways are ubiquitous and essential regulators of cellular processes, including proliferation, differentiation, migration, and survival, as well as physiological pathways [41].
In the MAPK pathway, FOS, JUN, PAP1A, and NFKB1 are inhibited by mir-101, mir-182, mir-340, let-7a, and BMPR1B in the TGF-β pathway is inhibited by the miRNA mir-590. Therefore, deregulations of these miRNA may cause changes in these pathways, resulting in aberrant function of the target genes of JUN, NFKB1, and E2F4.
In addition, 8 genes were differentially methylated between stage II and III of HCC (TRAF2, TNFRSF1A, HRAS, PDGFB, NFKB1, DAXX and MYC in the MAPK pathway, and MYC in TGF-β pathway). TRAF2, DAXX, and TNFRSF1A have been described previously. NFKB1 is being increasingly considered as an important TF in cancer progression [42]. HRAS is an essential component of signaling networks controlling cellular proliferation, differentiation, or survival [43].
Extracellular and intracellular stimuli can pass through the MAPK signaling pathway to JUN and NFKB1, thereby influencing the cellular process through negative transcriptional regulation of their target genes, CAPNS1, CYLD, and GATA4 (Figure 4). The functions of CAPNS1 and CYLD have been mentioned in the previous section. GATA4, a GATA factor coordinating cellular maturation with proliferation arrest and cell survival, uniquely appears in stage III HCC and is involved in proliferation and cell survival [44]. Moreover, extracellular and intracellular stimuli pass through the TGF-β signaling pathway to E2F4, thereby influencing the cellular process through transcriptional regulation of its target genes NEK2 and PANK1. Uncontrolled NEK2 activity has been reported to activate several oncogenic pathways, thereby inducing cancer cell proliferation and metastasis [45]. PANK1 regulates cell survival and proliferation.
In conclusion, the methylation of MAP2K4, and DDIT3 and the deregulation of let-7a, mir-494, let-7e, and mir-93 may induce changes in the MAPK pathway in stage II, resulting in aberrant regulation of the target genes of DDIT3, JUN, and NFKB1 (ADM, HDAC9, CAPNS1, CYLD) and subsequent dysfunction of cell proliferation, apoptosis, cell cycle, and cell survival (Figure 4). Moreover, the changes in the methylation of TNFRSF1A, HRAS, PDGFB, and MYC and the deregulation of mir-101, mir-182, mir-340, mir-302d, let-7a, mir-421, and mir-590 during stage III HCC may induce changes in the MAPK and TGF-β pathways, resulting in the aberrant regulation of the target genes of TFs NFKB1 in the MAPK pathway andE2F4 in the TGF-β pathway (CAPNS1, CYLD, GATA4, NEK2, PANK1), and subsequent dysfunction in cell proliferation, apoptosis, cell cycle, cell survival, and metastasis (Figure 4). The differences in epigenetic miRNA regulation and methylation causes a the shift from the MAPK to the TGF-β pathway, leading to the dysregulation of the target genes of TFs, resulting in favorable conditions for the progression of HCC from stage II to stage III (such as cell proliferation, anti-apoptosis, aberrant cell cycle, cell survival, and metastasis).
Multiple-drug molecules were designed to prevent the progression of HCC from stage II to stage III, based on the target genes of deregulated miRNA and genes with methylation changes (Figure 4); moreover, as described in the previous section, the selected drugs should have a minimal side effect on the other genes highlighted in Figure 4. DGIdb mining identified celecoxib, axitinib, and vinblastine, which interact with DDIT3, PDGFB, and JUN, respectively, with minimal interactions with other genes and proven anti-cancer effects [46–48]. Therefore, we designed a drug molecule comprising celecoxib, axitinib, and vinblastine to prevent the progression of HCC from stage II to stage III (Table 6).
The US FDA approved celecoxib and axitinib for the relief of the signs and symptoms of Juvenile Rheumatoid Arthritis (JRA) and for the treatment of advanced renal cell carcinoma, respectively. Vinblastine is FDA approved for the treatment of advanced Hodgkin’s disease, lymphocytic lymphoma, histiocytic lymphoma, advanced Mycosis fungoides, advanced testicular cancer, Kaposi’s sarcoma, and choriocarcinoma.
Table 6: The multiple drug design for preventing the progression of HCC from stage II and stage III based on the progression mechanism in Figure 7
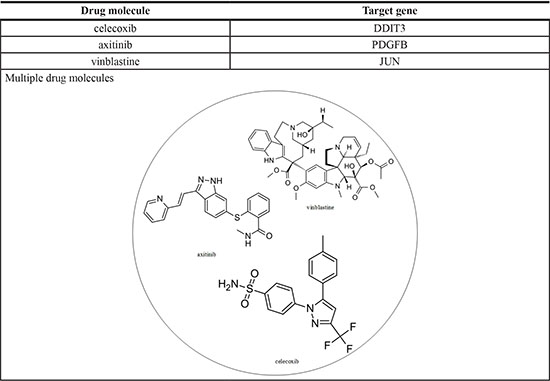
The multiple drug molecules comprise celecoxib, axitinib, and vinblastine for preventing HCC from stage II to stage III. The structure of these drug molecules based on ZINC database is shown in the following figure.
Role of epigenetic miRNA regulation and DNA methylation on HCC progression from stage III to stage IV
In stage III of HCC, we map core GEN in Figure 2C to the KEGG pathways and select the pathways containing core TFs simultaneously having core target genes as shown in Figure 5. We found TRAF2, TNFRSF1A, FOS, HRAS, PDGFB, JUN, IKBKG, RAP1A, NFKB1, NFKB2, and DAXX are involved in the MAPK signaling pathway. In addition, E2F4, GDF6, SMAD6, PPP2CB, and BMPR1B are involved in TGF-β pathway. Details of the MAPK pathway and the TGF-β signaling pathway have been described in the previous section. The impact of miRNAs and some DNA methylations on stage III of HCC has also been detailed in the previous section. In this section, we focus on how miRNA regulation and DNA methylation influence the signaling pathways, their corresponding TFs, and target genes of TFs in stage IV of HCC.
By comparing the methylation level between stage III and stage IV of HCC as shown in Figure 5, we found that 8 genes expressed in stage III have differential methylation, i.e. TRAF2, HRAS, PDGFB, NFKB2, DAXX, MYC, GDF6, and BMPR1B.
In stage IV of HCC, we map core GEN as shown in Figure 2D to the KEGG pathways and select the pathways containing core TFs simultaneously having core target genes as shown in Figure 5. We found AKT1, TRAF2, IL1R1, PDGFB, MAP3K2, GNA12, IL1B, NFKB1, and CDC25B are involved in the MAPK signaling pathway, which is detailed in the above section. We also found AKT1, CNTFR, IL7R, IL3RA, STAT3, and IFNAR1 involved in JAK-STAT signaling pathway. The JAK-STAT signaling pathway is involved in response to cell proliferation, differentiation, cell migration, and apoptosis [49].
In the MAPK pathway of HCC at stage IV, AKT1, IL1R1, IL1B, and NFKB1 are inhibited by mir-374a, mir-135b, mir-21, and let-7a, respectively. In the JAK-STAT pathway, AKT1 is also inhibited by mir-374a and IL7R is inhibited by mir-135b. We consider that the deregulation of these miRNAs may lead to the perturbation of these pathways, resulting in the aberrant function of the target genes coding NFKB1 and STAT3.
By comparing the methylation level between stage III and stage IV of HCC, we found that in stage IV, 8 genes have differential methylation, i.e. TRAF2, IL1R1, MAP3K2, GNA12, IL1B, CNTFR, IL7R, and STAT3 as shown in Figure 5. PDGFB can stimulate growth, survival, and motility of mesenchymal cells [50], which may confer migration ability on tumors. IL7R, a receptor of interleukin 7, can influence the malignancy proliferation by the tumor microenvironment [51]. STAT3 can increase tumor cell proliferation, survival, and invasion, while suppressing anti-tumor immunity [52]. Moreover, IL1R1, MAP3K2, GNA12, IL1B, CNTFR, IL7R, and STAT3 are specific to stage IV of HCC.
Extracellular and intracellular stimuli can pass through the MAPK signaling pathway to NFKB1, and have an impact on the cellular process through the transcriptional regulation of its target gene, including GADD45D. GADD45 is involved in the cell cycle and apoptotic process. Furthermore, extracellular and intracellular stimuli can pass through Jak-STAT signaling pathway to STAT3, and further influence its target genes, including FOSB and BIRC5. Although BIRC5 is mainly involved in cell survival, reportedly, it may provide a beneficial source to fuel tumor cell-invasion and metastasis [53]. FOSB can form a transcription factor complex, AP-1, which can control invasion of tumors [54] and has been reported to promote metastasis in other cancers [55]. Therefore, the deregulation of miRNAs and methylation of target genes would influence the perturbation of these pathways and the subsequent cellular dysfunctions consequently promoting the progression of HCC from stage III to stage IV, as shown in Figure 5.
In conclusion, at stage III of HCC, we found that the methylation of 6 genes (i.e. HRAS, NFKB2, DAXX, MYC, GDF6, and BMPR1B) and downregulation of 7 miRNAs (i.e. mir-101, mir-182, mir-340, mir-302d, let-7a, mir-421, and mir-590) to their target genes may contribute to perturbation of the MAPK pathway and the TGF-β pathway, resulting in the aberrant regulation of TFs (i.e. NFKB1 in MAPK pathway and E2F4 in TGF-β pathway) on their corresponding target genes (i.e. CAPNS1, CYLD, GATA4, NEK2, and PANK1) and subsequent dysfunctions in cell proliferation, apoptosis, cell cycle, cell survival, and metastasis, as shown in Figure 5. In addition, in stage IV, we found that the methylation of 7 genes (i.e. IL1R1,MAP3K2, GNA12, IL1B, CNTFR, IL7R, and STAT3) and deregulation of 5 miRNAs (i.e. mir-374a, mir135b, mir-21, let-7a, and mir-135a) to their target genes may contribute to perturbation of the MAPK pathway and the JAK-STAT pathway, resulting in the aberrant regulation of TFs (i.e. NFKB1 in MAPK pathway and STAT3 in JAK-STAT pathway) on their corresponding target genes (i.e. GADD45B, FOSB, and BIRC5) and the subsequent dysfunctions in cell proliferation, apoptosis, cell cycle, cell survival, and metastasis as shown in Figure 5. Owing to different epigenetic miRNA regulation and DNA methylation, there is a shift from the TGF-β pathway to the JAK-STAT pathway and different proteins involved in the MAPK pathway cause the downsregulation of TFs to their respective target genes, thus regulating cellular responses (i.e. cell proliferation, apoptotic process, cell cycle, cell survival, and metastasis) and subsequently causing the progression of HCC from stage III to stage IV, as shown in Figure 5.
Multiple-drug molecules were designed based on the target genes of dysregulating miRNAs and genes exhibiting differential methylation, to prevent the progression of HCC from stage III to stage IV, as shown in Figure 5. The selection of drugs should have a minimal side effect on other genes. According to DGIdb, atiprimod, celastrol, and bortezomib interact with STAT3, IL1B, and NFKB1, respectively, and have minimal interaction with other genes. Additionally, the proposed multiple-drug molecules have exhibited anti-cancer effects [56–58]. Therefore, we have designed a multiple-drug molecule comprising atiprimod, celastrol, and bortezomib, to prevent the progression of HCC from stage III to stage IV. The multiple-drug design is shown in Table 7.
Atiprimod was granted orphan drug designation by FDA for the treatment of multiple myeloma. FDA approved bortezomib for initial treatment of patients with multiple myeloma.
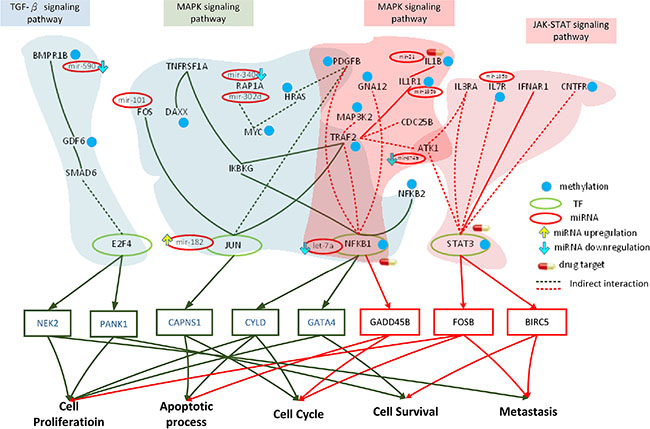
Figure 5: Role of miRNA regulation and DNA methylation on the mechanism of progression of HCC from stage III to stage IV. The dark green frames and lines represent stage III HCC. The purple frames and lines represent stage IV HCC. Blue node represents DNA methylation of gene. The green and red ovals represent transcription factors (TFs) and miRNAs, respectively. The upward yellow arrowhead represents miRNA upregulation during stage IV HCC, compared to that in stage III. The downward blue arrowhead represents miRNA downregulation in stage IV compared to that in stage III. TRAF2, TNFRSF1A, FOS, HRAS, PDGFB, JUN, IKBKG, RAP1A, NFKB1, NFKB2, and DAXX are involved in the MAPK signaling pathway, while E2F4, GDF6, SMAD6, PPP2CB, and BMPR1B regulate the TGF-β pathway during stage III HCC. The transcription factors JUN, NFKB1, and E2F4 are activated by stress signals, including the MAPK signaling and TGF-β pathways, inducing cellular responses such as cell proliferation, apoptosis, cell cycle, cell survival, and metastasis. AKT1, TRAF2, IL1R1, PDGFB, MAP3K2, GNA12, IL1B, NFKB1, and CDC25B are involved in the MAPK signaling pathway, while AKT1, CNTFR, IL7R, IL3RA, STAT3, and IFNAR1 regulate the JAK-STAT signaling pathway during stage IV HCC. The transcription factors NFKB1 and STAT3 are activated by a number of stress signals, including the MAPK signaling and JAK-STAT pathways, inducing cellular responses, including cell proliferation, apoptosis, cell cycle, cell survival, and metastasis. miRNA and DNA methylation dysregulation may contribute to the perturbation of the MAPK and TGF-β pathways, resulting in aberrant cellular responses and HCC progression from stage III to stage IV. Obviously, the perturbation of the MAPK pathway and the shift from the TGF-β to JAK-STAT pathways caused by epigenetic miRNA regulation and DNA methylation may be the major mechanism of HCC progression from stage III to stage IV. STAT3, ILB, and NFKB1 were selected as potential drug targets to prevent the progression of HCC from stage III to stage IV.
Table 7: The multiple drug design for preventing the progression of HCC from stage III and stage IV based on the progression mechanism in Figure 8
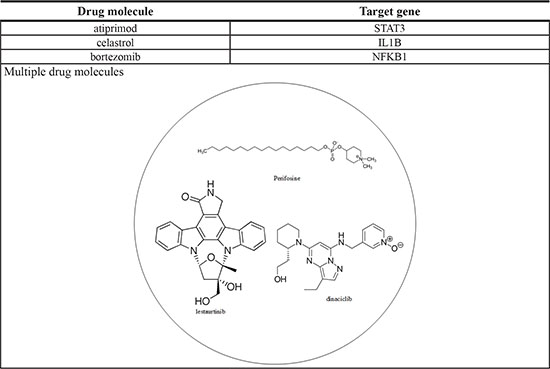
The multiple drug molecules comprise atiprimod, celastrol, and bortezomib for preventing HCC from stage III to stage IV. The structure of these drug molecules based on ZINC database is shown in the following figure.
Overall mechanism of HCC progression and identified HCC-specific drugs
The overall progression (summarized from Figure 3 to Figure 5) is shown in Figure 6. Signaling pathways are perturbed by the dysregulation of miRNA and methylation changes in the transduction process. Signal transduction of extracellular and intracellular stimuli is distorted by the perturbed signaling pathways, which result in HCC progression. Most of miRNA-regulated or methylated genes and miRNAs including AKT1 [59, 60], BMPR1B [61], FOS [62], GDF6 [63], HRAS [59, 62], IL1R1 [63], IL7R [61], JUND [60], MAP2K4 [61], MYC [62, 63], NFATC2 [59], NFKB1 [63], NTRK2 [63], PDGFB [59], PPP3CA [63], PTK2 [62], STAT3 [64], let-7e [65], mir-148a [65], mir-494 [66], mir-182 [65], mir-590 [67], mir-340 [65], and mir-93 [65] in Figure 6 can be supported by large-scale analysis studies of DNA methylation data or gene/miRNA expression data in HCC.
According to the results, we identified the MAPK signaling pathway involved in the core GENs of the 4 stages of HCC (Figures 3–5). It has been reported that the MAPK pathway could play an important role in HCC tumor progression and apoptosis [68, 69]. We found 6 specific proteins (NTRK2, MAPKAPK2, JUND, CRK, PPP3R1, and NFATC2) of the MAPK pathway, which participate in the progression of HCC from stage I to stage II. It has been shown that NTRK2 [70], MAPKAPK2 [71], and JUND [72] were associated with the impaired proliferation and CRK [73] was involved in cell adhesion and migration during early HCC. PPP3R1 has been also identified as a diagnostic marker, which mediates the dysregulations of 10 different pathways (natural killer cell mediated cytotoxicity, B cell receptor signaling pathway, T cell receptor signaling pathway, long-term potentiation, calcium signaling pathway, apoptosis, axon guidance, Wnt signaling pathway, and vascular endothelial growth factor (VEGF) signaling pathway), to affect liver immune system, and liver cell proliferation, adhesion and migration in liver carcinogenesis [74]. The dysregulated NFATC2 was involved in the immune cell infiltration to HCC [65]. The nature and localization of immune cells infiltrating the tumor cells have an important impact on tumor progression [75]. Therefore, the differentially methylated specific genes (NTRK2, MAPKAPK2, CRK, and NFATC2) and the dysregulated miRNAs (mir-148a, mir-374a and mir-494) in the MAPK and ErbB pathways cause cell proliferation, adhesions and migration and the immune cell infiltration to cancer cells during early HCC.
We found 3 specific proteins (MAP4K2, FOS, and DDIT3) of the MAPK pathway, which participate in the progression of HCC from stage II to stage III. It has been proposed that the proteins MAP4K2 and FOS [76] and the protein DDIT3 [77] mediated the transcriptionally and epigenetically dysregulated proliferation of HCC, respectively. Therefore, the differentially methylated specific genes (MAP4K2, FOS, and DDIT3) and the dysregulated miRNAs (mir-101, and mir-590) in the MAPK and TGF-β pathways cause the transcriptionally and epigenetically impaired signal transduction leading to liver carcinogenesis.
We found 3 specific proteins (GNA12, IL1R1, and MAP3K2) of the MAPK pathway, which participate in the progression of HCC from stage III to stage IV. It has been shown that GNA12 [78], and IL1R1 [79] mediated metastasis of HCC through cytoskeletal changes and autocrine and paracrine mechanisms, respectively. MAP3K2 mediated the methylation-induced tumorigenesis of HCC [80]. Therefore, the differentially methylated specific genes (GNA12, IL1R1, and MAP3K2) and the dysregulated miRNAs (mir-135b, mir-374a, and mir-590) in the MAPK, JAK-STAT, and TGF-β pathways cause the methylation-induced liver tumor growth, HCC cell migration and metastatic spread.
In summary, The differentially expressed miRNAs, mir-148a, mir-374a, mir-497, let-7a and let-7e, and the differentially methylated genes, AKT1, CAMK2D, CDC25B, CRK, HRAS, JUND, MAP2K4, MAPKAPK2, MYC, NFATC2, NFKB1, NTRK2, PPP3CA, PPP3R1, TAB2, TNFRSF1A and TRAF2, regulate cell proliferation, apoptotic process and cell cycle through ErbB and MAPK pathways in the switch between stage I HCC and stage II HCC.
The differentially expressed miRNAs, mir-93, mir-101, mir-182, mir-340, mir-590 and let-7e, and the differentially methylated genes, BMPR1B, CDC25B, DAXX, DDIT3, FOS, JUN, MAP2K4, MAP4K2, MYC, NFKB1, NFKB2, PDGFB, PPP3CA, RAP1A, TAB2, TNFRSF1A and TRAF2, regulate cell proliferation, apoptotic process, cell cycle, cell survival and metastasis through TGF-beta and MAPK pathways in the switch between stage II HCC and stage III HCC.
The differentially expressed miRNAs, mir-182, mir-340, mir-374a, mir-590 and let-7a, and the differentially methylated genes, AKT1, BMPR1B, CNTFR, DAXX, GDF6, GNA12, HRAS, IL1B, IL1R1, IL7R, JUN, MAP3K2, MYC, NFKB1, NFKB2, PDGFB, RAP1A, STAT3 and TRAF2, regulate cell proliferation, apoptotic process, cell cycle, cell survival and metastasis through TGF-beta, MAPK and JAK-STAT pathways in the switch between stage III HCC and stage IV HCC.. We have also proposed potential multi-drug molecules for targeted therapy of HCC: multi-drug molecules comprising lestaurtinib, dinaciclib, and perifosine; axitinib, vinblastine, and celecoxib; and atiprimod, celastrol, and bortezomib were designed to target NTRK2, MYC, and AKT1; DDIT3, PDGFB,and JUN; and DDIT3, PDGFB, and JUN, to prevent HCC progression from stage I to II, II to III, and III to IV, respectively.
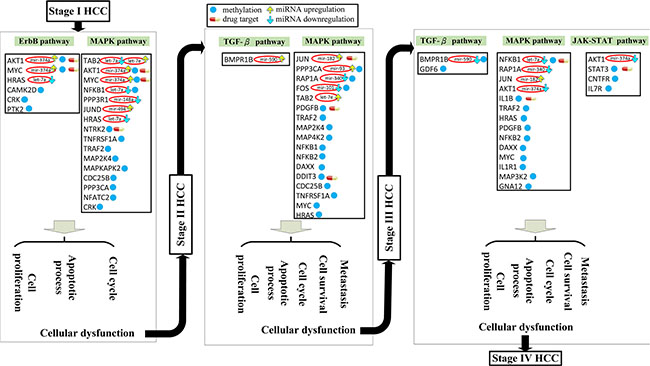
Figure 6: Overall mechanism of HCC progression from stage I to stage IV via miRNA deregulation and DNA methylation. Figures 3 to 5 summarize the overall mechanism of HCC progression from stage I to stage IV. The pathway members are all influenced by miRNA regulation and/or epigenetic DNA methylation; the members in brown were only affected by miRNA. miRNA deregulation and DNA methylation lead to distortion of the ErbB and MAPK signaling pathways, inducing distortions in the cell cycle, apoptosis, and cell proliferation processes, resulting in the progression of HCC from stage I to stage II. Similarly, induced distortions in the MAPK and TGF-β signaling pathway caused metastasis and cell cycle, apoptosis, and cell proliferation dysfunction, resulting in HCC progression from stage II to stage III. miRNA dysregulation and DNA methylation changes were also responsible for distortions in the MAPK, TGF-β, and JAK-STAT signaling pathways, resulting in metastasis and cell cycle, apoptosis, and cell proliferation dysfunction, which in turn induces HCC progression from stage III to stage IV. As a whole, miRNA and DNA methylation dysregulation of the various downstream genes in tumor cells could induce changes in the various signaling pathways, resulting in aberrant cell response, which favors HCC progression.
MATERIALS AND METHODS
Overview of the construction of core GENs involved in HCC
The construction of core GENs regulating the 4 stages of HCC is summarized in Figure 1. The NGS profiles of HCC and normal tissue samples, and the miRNA and DNA methylation data were mined from the miRNA, TF-gene, and BioGRID databases to construct candidate GENs composed of interactive candidate GRN, PPIN, and miRNA-gene regulatory networks. The false positive candidate GENs were pruned to construct real GENs affecting the 4 stages of HCC by system modeling and least square estimation method; furthermore, the cancer profiles were classified according to the stages to obtain the GENs for each stage, using the corresponding NGS data. The core GENs for each stage were obtained by PNP; the PNP method was used to extract the significant structure of GENs to investigate the mechanism of progression of HCC. The core GENs were mapped to pathways in the DAVID database and compared to those of the neighboring stages to investigate the mechanism of progression of hepatocarcinogenesis. We also propose potential drugs against genes responsible for significant epigenetic changes to prevent hepatocarcinogenesis using the Drug Gene Interaction database (DGIdb).
Data selection and processing
The original data from the Cancer Genome Atlas (TCGA) was downloaded to, and processed in, the user-friendly UCSC Cancer Genomics browser [81] . In this study, the level-3 gene expression, miRNA expression, and DNA methylation profiles were used to construct GRNs and PPINs. One American Indian, 148 Asian, 15 African American, 156 Caucasian, and 18 patients of undefined ethnicity were included in this study. The disease stage was classified according to the TNM (T: size of tumors, ranging from T1 to T4; N: nearby lymph node metastasis, with N0 and N1 representing no lymph node metastasis and lymph node metastasis, respectively; M: distant metastasis, with M0 and M1 representing distant and no metastasis, respectively) staging system into stages I, II, IIIA, IIIB, IIIC, IVA, and IVB. Patients classified into stages IIIA, IIIB, and IIIC were combined into a single stage III group, and those in stage IVA and IVB were combined into a group named stage IV. The patients were divided into stages based on the available clinical data. In addition to the 50 samples from normal subjects, the dataset comprised 163, 83, 80, and 6 tissue samples from subjects with HCC stage I, II, III, and IV, respectively.
Candidate GENs were enriched using information from the starBase [82] and miRTarBase [83] (for miRNA-gene regulatory associations), Gene Set Enrichment Analysis (GSEA) [84], Human Transcription Regulation Interaction database (HTRIdb) [85] and integrated transcription factor platform (ITFP) [86] (for TF-gene regulatory associations), and Biological General Repository for Interaction Datasets (BioGRID) [87] (for protein-protein interactions) databases, in order to construct candidate GENs.
Database mining leads to the enrichment of candidate GENs with a large number of false positives; these were pruned in the candidate GENs by deleting insignificant components in the system order (the number of interactions at each node in the GEN).
Modeling GENs
The regulation of each gene combines transcriptional and epigenetic regulation, and includes the negative regulation of miRNA and the effect of promoter methylation on the target gene i in the candidate GRN; the gene expression of the i-th gene in the candidate GRN is described as follows:

where the subscript n represents the n-th sample; xi,n represents the expression level of the i-th target gene; yj,n represents the expression level of the j-th TF binding to target gene i; sm,n denotes the expression of the m-th miRNA; ki represents the basal level of the target gene i; βi,n represents the methylation level of the i-th target gene (range: 0 to 1, with the value close to zero indicating a low level of methylation, and a value closer to 1 indicating a high level of methylation); h(βi,n) represents the effect of methylation level βi,n on the gene expression of target gene i, wherein a higher value decreases the binding affinity aij of Ji transcription factors with the target gene i; and vi,n represents the stochastic noise caused by other factors and model uncertainty. The biological meaning of equation (1) is described as follows: the mRNA expression of target gene i is regulated by Ji transcription factors binding to the target gene i, wherein methylation modification h(βi,n) decreases the binding effectiveness of TF (aij); mRNA expression is also negatively regulated by the partial or perfect binding bim of miRNA sm,n to the mRNA of target gene i. Moreover, the basal level ki of mRNA expression could also be affected by the methylation modification h(βi,n). Some stochastic noise was employed to model the measurement noise and random fluctuations of expression in target gene i.
The level of expression of the protein p in the candidate GEN was described using the following equation in the candidate PPIN:
where the subscript n represents the n-th sample; yp,n represents the protein expression of protein p; yq,n represents the q-th protein interacting with protein p; ep denotes the translation rate of the corresponding mRNA of the p-th protein; hp represents the basal level of protein p; cpq represents the interaction ability between q-th and q-th protein; and wp,n represents the stochastic noise caused by other factors or model uncertainty. The interaction ability of PPI is proportional to the product of concentrations of both proteins, that I, it is proportional to the probability of molecular collisions between them. Biologically, equation (2) indicates that the protein expression level of protein p is determined by complex protein interactions with Qp proteins, in addition to the basal level of protein p and some stochastic noise.
Construction of GEN using the system identification method and system order detection
The candidate GEN obtained by big database mining includes all possible associations under various environmental conditions; therefore, their actual associations must be further confirmed by applying the gene expression, miRNA expression, and methylation profiles in the NGS data to the identification of the following regression models. The false-positive candidate GENs were pruned by deleting the insignificant components from the system order through system identification and system order detection in (1) and (2).
The equation (1) can be rewritten as the following regression form

where ϕi,n is the regression vector which can be obtained from the corresponding data in NGS and θiGRN is the parameter vector to be estimated for target gene i.
The equation (3) with L patients can be arranged as the following form

where L is the number of corresponding patients. For convenience, we define the notation Χi, Φi, and Vi to represent (4)

The constrained least square estimation of  is formulated as

Similarly, equation (2) can be rewritten as the following form
where ψp,n denotes regression vector with the corresponding data and θpPPI is parameter vector to be estimated. The equation (7) with L patients can be arranged as the following form

and equation (8) also can be simplified by defining Υp, Ψp, and Wp as the following equation

The constrained least square parameter identification problem is formulated below

We then applied the function lsqlin in MATLAB optimization toolbox to the constrained least square parameter identification problems of GRN in (6) and PPI in (10) to solve the binding affinity of TF j to gene i, aij, the repression ability of miRNA m to gene i, −bim, and the interaction ability between protein p and protein q, cpq, subject to −bim ≤ 0, ki ≥ 0, and hp ≥ 0 to meet the practical situation. Akaike information criterion (AIC) is accompanied with the parameter identification procedures for determining system model orders (i.e. Ji, Mi and Qp) in (1) and (2) for each protein in candidate PPIN, each gene in candidate GRN and each miRNA in candidate miRNA regulatory network in candidate GENs at 4 stages of HCC [88]. Then we prune the false-positive gene and miRNA regulations (i.e. aij and bim) and protein interactions (i.e. cpq) out of true system model orders determined by AIC, and hence the real gene transcription regulations, miRNA regulations and protein interactions are obtained through real NGS data for real GENs at different stages of HCC as shown in Figure S1 to Figure S4.
Remark
According to the formulated problem in (3), (6), (7), and (10), if we want to identify the general models of GRN in (1) and PPIN in (2) with the consideration of translation process from mRNA to protein, the simultaneously measured expressions of the genome-wide mRNAs and proteins at four stages of HCC were required. Since genome-wide expression measurement of protein behaviors at four stages of HCC have not been realized yet and mRNA expressions are proportional to their corresponding proteins, in which 73% variance of protein abundance can be explained by mRNA abundance [89], the mRNA expressions can replace protein expressions for the above constrained least square parameter estimation problems in (6), and (10). In the parameter estimation problem of PPIN in (2), if we replace protein expression yp,n by its corresponding mRNA expression xp,n, it is impossible to identify the translation rate ep (if time-course microarray data is used, this kind of problem can be avoided.). In this situation, the parameter estimation of PPIN in (10) is with the modified  and the modified
  in (9) and (10). It means that if we did not have the simultaneously measured expressions of the genome-wide mRNAs and proteins at four stages of HCC, the translation rate of the corresponding mRNA to the p-th protein, ep, can not be identified by solving the problem in (10). In future, if the genome-wide expressions of mRNAs and proteins are available, we could construct a more complete integrated network, including translation paths in hepatocarcinogenesis.
Extracting core GENs of different stages of HCC using Principal Network Projection
The actual GENs of each stage are very complex; therefore, it is not easy to gain insights into the most significant mechanisms of tumor development and progression from these GENs during different stages of HCC. Therefore, the core GENs at the different stages of HCC were extracted using PNP based on PCA. Although SVD has been a popular tool for a dimensionality reduction method by performing a PCA on the given network matrix, it can not guarantee parameter polarity, i.e. the miRNA repressions −bim ≤ 0, in the network matrix. Therefore, we only applied PCA to the identified network matrix to determine the core nodes in the network based on the projection distance, which only deleted the insignificant nodes and did not change the connection weights between core nodes. The dimensionality reduction of the network matrix is called PNP method.
Let the combined network matrix of GEN
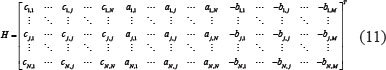
where Ci,j is the interaction ability between protein i and j protein in (2), ai,j is the regulatory ability of TF j on gene i in (1), and -bi,j is the epigenetic regulation of miRNA j on gene i in (1). The combined network matrix of GEN can be decomposed by singular value decomposition (SVD) as follows [88, 90–94]

where  denotes the k-th row vector of H for
  , and v:,m denote the m-th column vector of V, for m = 1, …, N, which are right singular vectors of H. The diagonal entries di, i=1,2,…,N of the diagonal matrix,
  , are the N singular values of H in descent order, i.e.
  . The eigenexpression fraction (Em) is defined as

We selected the top M singular vectors of V such that  with the minimal M, so that the M principal components contain 85% of the combined network matrix from an energy point of view. The projections of H onto the M singular vectors of V are defined as follows

We further defined the 2-norm distance from each gene to the top M singular vectors.

If D(k) is close to zero, it implies that the k-th gene is independent of the top M singular vectors. Hence, we define three thresholds, th1, th2, th3 to respectively identify the core proteins D(k) ≥ th1 for k=1,…,N, and the core genes D(k) ≥ th2 for k = N + 1,…,2N, and the core miRNAs D(k) ≥ th3 for k = 2N,…,2N + L, in the core GEN of the integrated genetic and epigenetic network, which has the principal network structure of the GEN.
CONCLUSIONS
In this study, we constructed GENs specific for the various stages (I–IV) of HCC, based on their corresponding mRNA, miRNA, and methylation profiles in NGS data, in order to elucidate the mechanism of disease progression, through big database mining via least square estimation and AIC model order detection. Core GRNs were obtained to identify core network markers by PNP method, based on PCA. The involvement of the pathways utilized by the PPIs of core GENs at each stage in the mechanism of progression was identified using DAVID. The core network markers of pathways were compared among the neighboring stages to identify the impact of the changes in DNA methylation and miRNA regulation of the ErbB, MAPK, TGF-β, and JAK-STAT signaling pathways on hepatocarcinogenesis. We discovered that these signals were further transduced to different TFs to aberrantly regulate their target genes, resulting in the development of favorable factors (cell proliferation, anti-apoptosis, cell cycle, cell survival and, especially in stage III and stage IV, metastasis) for the progression and development of HCC. Moreover, we proposed multi-drug molecules targeting multiple drug target genes with aberrant methylation and deregulating miRNA, to prevent the progression of HCC from a systematic perspective. Multi-drug molecules comprising lestaurtinib, dinaciclib, and perifosine; axitinib, vinblastine, and celecoxib; and atiprimod, celastrol, and bortezomib were designed to target NTRK2, MYC, and AKT1; DDIT3, PDGFB, and JUN; and DDIT3, PDGFB, and JUN, to prevent HCC progression from stage I to II, II to III, and III to IV, respectively
ACKNOWLEDGMENTS AND FUNDING
The work was supported by the Ministry of Science and Technology of Taiwan under grant No. MOST 104-2221-E-007 -124 -MY3.
CONFLICTS OF INTEREST
The authors declare that there is no conflicts of interests regarding the publication of this paper.
REFERENCES
1. Yang JD, Roberts LR. Epidemiology and Management of Hepatocellular Carcinoma. Infect Dis Clin N Am. 2010; 24:899–919.
2. Waly Raphael S, Yangde Z, Yuxiang C. Hepatocellular carcinoma: focus on different aspects of management. ISRN Oncol. 2012; 2012:421673.
3. Venook AP, Papandreou C, Furuse J and de Guevara LL. The Incidence and Epidemiology of Hepatocellular Carcinoma: A Global and Regional Perspective. Oncologist. 2010; 15:5–13.
4. Libbrecht L, Desmet V, Roskams T. Preneoplastic lesions in human hepatocarcinogenesis. Liver Int. 2005; 25:16–27.
5. Liu M, Jiang LX, Guan XY. The genetic and epigenetic alterations in human hepatocellular carcinoma: a recent update. Protein Cell. 2014; 5:673–691.
6. Scaggiante B, Kazemi M, Pozzato G, Dapas B, Farra R, Grassi M, Zanconati F, Grassi G. Novel hepatocellular carcinoma molecules with prognostic and therapeutic potentials. World J. Gastroenterol. 2014; 20:1268–1288.
7. Pogribny IP, Rusyn I. Role of epigenetic aberrations in the development and progression of human hepatocellular carcinoma. Cancer Lett. 2014; 342:223–230.
8. Shibata T, Aburatani H. Exploration of liver cancer genomes. Nat Rev Gastroenterol Hepatol. 2014; 11:10.
9. Papaconstantinou I, Karakatsanis A, Gazouli M, Polymeneas G, Voros D. The role of microRNAs in liver cancer. Eur J Gastroenterol Hepatol. 2012; 24:223–228.
10. Hayes J, Peruzzi PP, Lawler S. MicroRNAs in cancer: biomarkers, functions and therapy. Trends Mol Med. 2014; 20:460–469.
11. Kozomara A, Griffiths-Jones S. miRBase: annotating high confidence microRNAs using deep sequencing data. Nucleic Acids Res. 2014; 42:D68–D73.
12. Morishita A, Masaki T. miRNA in hepatocellular carcinoma. Hepatol Res. 2015; 45:128–141.
13. Chu R, Mo GQ, Duan ZJ, Huang M, Chang JY, Li XD, Liu PX. miRNAs affect the development of hepatocellular carcinoma via dysregulation of their biogenesis and expression. Cell Commun Signal. 2014; 12:12.
14. Huang S, He X. The role of microRNAs in liver cancer progression. Br J Cancer 2011; 104:235–240.
15. Schwarzenbach H, Nishida N, Calin GA, Pantel K. Clinical relevance of circulating cell-free microRNAs in cancer. Nat Rev Clin Oncol. 2014; 11:145–156.
16. Berger E, Vega N, Weiss-Gayet M, Geloen A. Gene Network Analysis of Glucose Linked Signaling Pathways and Their Role in Human Hepatocellular Carcinoma Cell Growth and Survival in HuH7 and HepG2 Cell Lines. Biomed Res Int. 2015.
17. Steinway SN, Zanudo JGT, Ding W, Rountree CB, Feith DJ, Loughran TP, Albert R. Network Modeling of TGF beta Signaling in Hepatocellular Carcinoma Epithelial-to-Mesenchymal Transition Reveals Joint Sonic Hedgehog and Wnt Pathway Activation. Cancer Res. 2014; 74:5963–5977.
18. Zhang YQ, Guo XD, Yang M, Yu LX, Li ZW, Lin N. Identification of AKT kinases as unfavorable prognostic factors for hepatocellular carcinoma by a combination of expression profile, interaction network analysis and clinical validation. Mol Biosyst. 2014; 10:215–222.
19. Jiang M, Chen YK, Zhang YC, Chen L, Zhang N, Huang T, Cai YD, Kong XY. Identification of hepatocellular carcinoma related genes with k-th shortest paths in a protein-protein interaction network. Mol Biosyst. 2013; 9:2720–2728.
20. Lim HY, Sohn I, Deng S, Lee J, Jung SH, Mao M, Xu J, Wang K, Shi S, Joh JW, Choi YL, Park CK. Prediction of disease-free survival in hepatocellular carcinoma by gene expression profiling. Ann Surg Oncol. 2013; 20:3747–3753.
21. Dillon ST, Bhasin MK, Feng X, Koh DW, Daoud SS. Quantitative proteomic analysis in HCV-induced HCC reveals sets of proteins with potential significance for racial disparity. J Transl Med. 2013; 11:239.
22. Zhang Y, Wang S, Li D, Zhnag J, Gu D, Zhu Y, He F. A systems biology-based classifier for hepatocellular carcinoma diagnosis. PLoS One. 2011; 6:e22426.
23. Yarden Y, Sliwkowski MX. Untangling the ErbB signalling network. Nat Rev Mol Cell Bio. 2001; 2:127–137.
24. Kim EK, Choi EJ. Pathological roles of MAPK signaling pathways in human diseases. Bba-Mol Basis Dis. 2010; 1802:396–405.
25. Vivanco I, Chen ZC, Tanos B, Oldrini B, Hsieh WY, Yannuzzi N, Campos C, Mellinghoff IK. A kinase-independent function of AKT promotes cancer cell survival. Elife. 2014; 3:35.
26. Wang Y-y, Zhao R, Zhe H. The emerging role of CaMKII in cancer. Oncotarget. 2015; 6:11725–11734. doi: 10.18632/oncotarget.3955.
27. Sriram G, Birge RB. Emerging Roles for Crk in Human Cancer. Genes Cancer. 2010; 1:1132–1139. doi: 10.1177/1947601910397188.
28. Dang CV. MYC, Metabolism, Cell Growth, and Tumorigenesis. Cold Spring Harb Perspect Med. 2013; 3:15.
29. Bradley JR, Pober JS. Tumor necrosis factor receptor-associated factors (TRAFs). Oncogene. 2001; 20:6482–6491.
30. Zhang W, Liu HT. MAPK signal pathways in the regulation of cell proliferation in mammalian cells. Cell Res. 2002; 12:9–18.
31. Kristjánsdóttir K, Rudolph J. Cdc25 Phosphatases and Cancer. Chem Biol. 11:1043–1051.
32. Zhang ZL, Huang SX, Lin S, Chai L. Plasma adrenomedullin levels and nasopharyngeal carcinoma prognosis. Clin Chim Acta. 2015; 440:172–176.
33. Ropero S, Esteller M. The role of histone deacetylases (HDACs) in human cancer. Mol Oncol. 2007; 1:19–25.
34. Dai Z, Zhou SL, Zhou ZJ, Bai DS, Xu XY, Fu XT, Chen Q, Zhao YM, Zhu K, Yu L, Yang GH, Wang Z, Wu WZ, et al. Capn4 contributes to tumour growth and metastasis of hepatocellular carcinoma by activation of the FAK-Src signalling pathways. Journal of Pathology. 2014; 234:316–328.
35. Wagner AH, Coffman AC, Ainscough BJ, Spies NC, Skidmore ZL, Campbell KM, Krysiak K, Pan D, McMichael JF, Eldred JM, Walker JR, Wilson RK, Mardis ER, et al. DGIdb 2.0: mining clinically relevant drug–gene interactions. Nucleic Acids Res. 2015.
36. Vazquez-Ortiz G, Chisholm C, Xu XL, Lahusen TJ, Li CL, Sakamuru S, Huang RL, Thomas CJ, Xia MH, Deng CX. Drug repurposing screen identifies lestaurtinib amplifies the ability of the poly (ADP-ribose) polymerase 1 inhibitor AG14361 to kill breast cancer associated gene-1 mutant and wild type breast cancer cells. Breast Cancer Res. 2014; 16:14.
37. Richardson PG, Eng C, Kolesar J, Hideshima T, Anderson KC. Perifosine, an oral, anti-cancer agent and inhibitor of the Akt pathway: mechanistic actions, pharmacodynamics, pharmacokinetics, and clinical activity. Expert Opin Drug Metab Toxicol. 2012; 8:623–633.
38. Mita MM, Joy AA, Mita A, Sankhala K, Jou YM, Zhang D, Statkevich P, Zhu YL, Yao SL, Small K, Bannerji R, Shapiro CL. Randomized Phase II Trial of the Cyclin-Dependent Kinase Inhibitor Dinaciclib (MK-7965) Versus Capecitabine in Patients With Advanced Breast Cancer. Clin Breast Cancer. 2014; 14:169–176.
39. Li J, Gu L, Zhang H, Liu T, Tian D, Zhou M, Zhou S. Berberine represses DAXX gene transcription and induces cancer cell apoptosis. Lab Invest. 2013; 93:354–364.
40. Bento C, Andersson MK, Aman P. DDIT3/CHOP and the sarcoma fusion oncoprotein FUS-DDIT3/TLS-CHOP bind cyclin-dependent kinase 2. BMC Cell Biol. 2009; 10:7.
41. Gordon KJ, Blobe GC. Role of transforming growth factor-beta superfamily signaling pathways in human disease. Bba-Mol Basis Dis. 2008; 1782:197–228.
42. Hoesel B, Schmid JA. The complexity of NF-kappa B signaling in inflammation and cancer. Mol Cancer. 2013; 12:15.
43. Fernández-Medarde A, Santos E. Ras in Cancer and Developmental Diseases. Genes Cancer. 2011; 2:344–358. doi: 10.1177/1947601911411084.
44. Zheng R, Blobel GA. GATA Transcription Factors and Cancer. Genes Cancer. 2010; 1:1178–1188. doi: 10.1177/1947601911404223.
45. Xia JL, Machin RF, Gu ZM, Zhan FH. Role of NEK2A in Human Cancer and Its Therapeutic Potentials. Biomed Res Int. 2015.
46. King JW, Lee SM. Axitinib for the treatment of advanced non-small-cell lung cancer. Expert Opin Investig Drugs. 2013; 22:765–773.
47. Gigant B, Wang CG, Ravelli RBG, Roussi F, Steinmetz MO, Curmi PA, Sobel A, Knossow M. Structural basis for the regulation of tubulin by vinblastine. Nature. 2005; 435:519–522.
48. Jendrossek V. Targeting apoptosis pathways by Celecoxib in cancer. Cancer Lett. 2013; 332:313–324.
49. Rawlings JS, Rosler KM, Harrison DA. The JAK/STAT signaling pathway. J Cell Sci. 2004; 117:1281–1283.
50. Heldin CH. Targeting the PDGF signaling pathway in tumor treatment. Cell Commun Signal. 2013; 11:18.
51. Zarogoulidis P, Lampaki S, Yarmus L, Kioumis I, Pitsiou G, Katsikogiannis N, Hohenforst-Schmidt W, Li Q, Huang HD, Sakkas A, Organtzis J, Sakkas L, Mpoukovinas I, et al. Interleukin-7 and Interleukin-15 for Cancer. J Cancer. 2014; 5:765–773.
52. Yu H, Pardoll D, Jove R. STATs in cancer inflammation and immunity: a leading role for STAT3. Nat Rev Cancer. 2009; 9:798–809.
53. Rivadeneira DB, Caino MC, Seo JH, Angelin A, Wallace DC, Languino LR, Altieri DC. Survivin promotes oxidative phosphorylation, subcellular mitochondrial repositioning, and tumor cell invasion. Sci Signal. 2015; 8:12.
54. Ozanne BW, Spence HJ, McGarry LC, Hennigan RF. Transcription factors control invasion: AP-1 the first among equals. Oncogene. 2007; 26:1–10.
55. Ding XM, Pan HY, Li J, Zhong Q, Chen XH, Dry SM, Wang CY. Epigenetic Activation of AP1 Promotes Squamous Cell Carcinoma Metastasis. Sci Signal. 2013; 6:13.
56. Amit-Vazina M, Shishodia S, Harris D, Van Q, Wang M, Weber D, Alexanian R, Talpaz M, Aggarwal BB, Estrov Z. Atiprimod blocks STAT3 phosphorylation and induces apoptosis in multiple myeloma cells. Br J Cancer 2005; 93:70–80.
57. Roccaro AM, Vacca A, Ribatti D. Bortezomib in the treatment of cancer. Recent Patents Anti-Canc Drug Discov. 2006; 1:397–403.
58. Lee HW, Jang KSB, Choi HJ, Jo A, Cheong JH, Chun KH. Celastrol inhibits gastric cancer growth by induction of apoptosis and autophagy. BMB Rep. 2014; 47:697–702.
59. Stefanska B, Huang J, Bhattacharyya B, Suderman M, Hallett M, Han ZG, Szyf M. Definition of the landscape of promoter DNA hypomethylation in liver cancer. Cancer Res. 2011; 71:5891–5903.
60. Anwar SL, Lehmann U. DNA methylation, microRNAs, and their crosstalk as potential biomarkers in hepatocellular carcinoma. World J Gastroenterol. 2014; 20:7894–7913.
61. Song MA, Tiirikainen M, Kwee S, Okimoto G, Yu H, Wong LL. Elucidating the landscape of aberrant DNA methylation in hepatocellular carcinoma. PLoS One. 2013; 8:e55761.
62. Wang J, Huo K, Ma L, Tang L, Li D, Huang X, Yuan Y, Li C, Wang W, Guan W, Chen H, Jin C, Wei J, et al. Toward an understanding of the protein interaction network of the human liver. Mol Syst Biol. 2011; 7:536.
63. Jhunjhunwala S, Jiang Z, Stawiski EW, Gnad F, Liu J, Mayba O, Du P, Diao J, Johnson S, Wong KF, Gao Z, Li Y, Wu TD, et al. Diverse modes of genomic alteration in hepatocellular carcinoma. Genome Biol. 2014; 15:436.
64. Choi J, Corder NL, Koduru B, Wang Y. Oxidative stress and hepatic Nox proteins in chronic hepatitis C and hepatocellular carcinoma. Free Radic Biol Med. 2014; 72:267–284.
65. Murakami Y, Yasuda T, Saigo K, Urashima T, Toyoda H, Okanoue T, Shimotohno K. Comprehensive analysis of microRNA expression patterns in hepatocellular carcinoma and non-tumorous tissues. Oncogene. 2006; 25:2537–2545.
66. Liu K, Liu S, Zhang W, Jia B, Tan L, Jin Z, Liu Y. miR-494 promotes cell proliferation, migration and invasion, and increased sorafenib resistance in hepatocellular carcinoma by targeting PTEN. Oncol Rep. 2015; 34:1003–1010.
67. Jiang X, Xiang G, Wang Y, Zhang L, Yang X, Cao L, Peng H, Xue P, Chen D. MicroRNA-590–5p regulates proliferation and invasion in human hepatocellular carcinoma cells by targeting TGF-beta RII. Mol Cells. 2012; 33:545–551.
68. Huynh H, Nguyen TT, Chow KH, Tan PH, Soo KC, Tran E. Over-expression of the mitogen-activated protein kinase (MAPK) kinase (MEK)-MAPK in hepatocellular carcinoma: its role in tumor progression and apoptosis. BMC Gastroenterol. 2003; 3:19.
69. Inamura K, Matsuzaki Y, Uematsu N, Honda A, Tanaka N, Uchida K. Rapid inhibition of MAPK signaling and anti-proliferation effect via JAK/STAT signaling by interferon-alpha in hepatocellular carcinoma cell lines. Biochim Biophys Acta. 2005; 1745:401–410.
70. Paterlini-Brechot P, Saigo K, Murakami Y, Chami M, Gozuacik D, Mugnier C, Lagorce D, Brechot C. Hepatitis B virus-related insertional mutagenesis occurs frequently in human liver cancers and recurrently targets human telomerase gene. Oncogene. 2003; 22:3911–3916.
71. Nguyen Ho-Bouldoires TH, Claperon A, Mergey M, Wendum D, Desbois-Mouthon C, Tahraoui S, Fartoux L, Chettouh H, Merabtene F, Scatton O, Gaestel M, Praz F, Housset C, et al. Mitogen-activated protein kinase-activated protein kinase 2 mediates resistance to hydrogen peroxide-induced oxidative stress in human hepatobiliary cancer cells. Free Radic Biol Med. 2015; 89:34–46.
72. Liu P, Kimmoun E, Legrand A, Sauvanet A, Degott C, Lardeux B, Bernuau D. Activation of NF-kappaB, AP-1 and STAT transcription factors is a frequent and early event in human hepatocellular carcinomas. J Hepatol. 2002; 37:63–71.
73. Lin Q, Sun MZ, Guo C, Shi J, Chen X, Liu S. CRKL overexpression suppresses in vitro proliferation, invasion and migration of murine hepatocarcinoma Hca-P cells. Biomed Pharmacother. 2015; 69:11–17.
74. Zekri AR, Hafez MM, Bahnassy AA, Hassan ZK, Mansour T, Kamal MM, Khaled HM. Genetic profile of Egyptian hepatocellular-carcinoma associated with hepatitis C virus Genotype 4 by 15 K cDNA microarray: preliminary study. BMC Res Notes. 2008; 1:106.
75. Mossanen JC, Tacke F. Role of lymphocytes in liver cancer. Oncoimmunology. 2013; 2:e26468.
76. Ito Y, Sasaki Y, Horimoto M, Wada S, Tanaka Y, Kasahara A, Ueki T, Hirano T, Yamamoto H, Fujimoto J, Okamoto E, Hayashi N, Hori M. Activation of mitogen-activated protein kinases/extracellular signal-regulated kinases in human hepatocellular carcinoma. Hepatology. 1998; 27:951–958.
77. He XX, Kuang SZ, Liao JZ, Xu CR, Chang Y, Wu YL, Gong J, Tian DA, Guo AY, Lin JS. The regulation of microRNA expression by DNA methylation in hepatocellular carcinoma. Mol Biosyst. 2015; 11:532–539.
78. O’Hayre M, Vazquez-Prado J, Kufareva I, Stawiski EW, Handel TM, Seshagiri S, Gutkind JS. The emerging mutational landscape of G proteins and G-protein-coupled receptors in cancer. Nat Rev Cancer. 2013; 13:412–424.
79. Xu X, Huang P, Yang B, Wang X, Xia J. Roles of CXCL5 on migration and invasion of liver cancer cells. J Transl Med. 2014; 12:193.
80. Mazur PK, Reynoird N, Khatri P, Jansen PW, Wilkinson AW, Liu S, Barbash O, Van Aller GS, Huddleston M, Dhanak D, Tummino PJ, Kruger RG, Garcia BA, et al. SMYD3 links lysine methylation of MAP3K2 to Ras-driven cancer. Nature. 2014; 510:283–287.
81. Goldman M, Craft B, Swatloski T, Cline M, Morozova O, Diekhans M, Haussler D, Zhu JC. The UCSC Cancer Genomics Browser: update 2015. Nucleic Acids Res. 2015; 43:D812-D817.
82. Li JH, Liu S, Zhou H, Qu LH, Yang JH. starBase v2.0: decoding miRNA-ceRNA, miRNA-ncRNA and protein-RNA interaction networks from large-scale CLIP-Seq data. Nucleic Acids Res. 2014; 42:D92-D97.
83. Hsu SD, Tseng YT, Shrestha S, Lin YL, Khaleel A, Chou CH, Chu CF, Huang HY, Lin CM, Ho SY, Jian TY, Lin FM, Chang TH, et al. miRTarBase update 2014: an information resource for experimentally validated miRNA-target interactions. Nucleic Acids Res. 2014; 42:D78-D85.
84. Subramanian A, Tamayo P, Mootha VK, Mukherjee S, Ebert BL, Gillette MA, Paulovich A, Pomeroy SL, Golub TR, Lander ES, Mesirov JP. Gene set enrichment analysis: A knowledge-based approach for interpreting genome-wide expression profiles. Proc Natl Acad Sci USA. 2005; 102:15545–15550.
85. Bovolenta LA, Acencio ML, Lemke N. HTRIdb: an open-access database for experimentally verified human transcriptional regulation interactions. Bmc Genomics. 2012; 13:10.
86. Zheng GY, Tu K, Yang Q, Xiong Y, Wei CC, Xie L, Zhu YY, Li YX. ITFP: an integrated platform of mammalian transcription factors. Bioinformatics. 2008; 24:2416–2417.
87. Chatr-aryamontri A, Breitkreutz BJ, Oughtred R, Boucher L, Heinicke S, Chen DC, Stark C, Breitkreutz A, Kolas N, O’Donnell L, Reguly T, Nixon J, Ramage L, et al. The BioGRID interaction database: 2015 update. Nucleic Acids Res. 2015; 43:D470-D478.
88. Chen BS, Li CW. Big Mechanisms in Systems Biology: Big Data Mining, Network Modeling, and Genome-Wide Data Identification. Academic Press. 2016.
89. Lu P, Vogel C, Wang R, Yao X, Marcotte EM. Absolute protein expression profiling estimates the relative contributions of transcriptional and translational regulation. Nat Biotechnol. 2007; 25:117–124.
90. Chen BS, Li CW. Constructing an integrated genetic and epigenetic cellular network for whole cellular mechanism using high-throughput next-generation sequencing data. BMC Syst Biol. 2016; 10.
91. Li CW, Chen BS. Investigating core genetic-and-epigenetic cell cycle networks for stemness and carcinogenic mechanisms, and cancer drug design using big database mining and genome-wide next-generation sequencing data. Cell Cycle. 2016; 15:2593–2607.
92. Li CW, Chen BS. Network Biomarkers of Bladder Cancer Based on a Genome-Wide Genetic and Epigenetic Network Derived from Next-Generation Sequencing Data. Dis Markers. 2016; 2016:4149608.
93. Li CW, Wang WH, Chen BS. Investigating the specific core genetic-and-epigenetic networks of cellular mechanisms involved in human aging in peripheral blood mononuclear cells. Oncotarget. 2016; 7:8556–8579. doi: 10.18632/oncotarget.7388.
94. Li CW, Lee YL, Chen BS. Genetic-and-Epigenetic Interspecies Networks for Cross-Talk Mechanisms in Human Macrophages and Dendritic Cells during MTB Infection. Front Cell Infect Microbiol. 2016; 6.