
INTRODUCTION
Neuroblastoma is a neuroectodermal tumor that originates from precursor cells of the sympathetic nervous system. It represents the third leading cause of cancer-related deaths in childhood [1]. Its heterogeneous clinical phenotype, ranging from rapid progression to spontaneous regression, is due to the biological and genetic features of the tumor. The prognosis of stage I-III neuroblastoma (with a tumor confined to the originating organ or its surrounding tissues) is quite favorable, whereas that of metastatic stage IV is dismal. Stage IV-S neuroblastoma is a metastatic disease seen exclusively in infants: its metastases spread out very rapidly, but surprisingly it regresses spontaneously with a high survival rate [2]. The most frequently characterized cytogenetic alterations in neuroblastoma include: (i) amplification of the gene encoding MYCN (a protooncogenic transcription factor), localized at 2p24; (ii) loss of heterozygosity (LOH) or rearrangements of the distal portion of 1p31-ter, 3p22, 11q23; (iii) gain of chromosome arms 1q or 17q. Besides these abnormalities, gain of chromosomes 4q, 6p, 7q, 11q and 18q, amplification of MDM2 and MYC genes, and LOH at 14q, 10q, 19q13 have also been described [3, 4]. More recently, the involvement of miRNAs in neuroblastoma pathogenesis has been assessed [5, 6]. Deregulation of miRNAs expression in malignant neuroblastomas may be due to several factors, as MYCN amplification, chromosomal deletions, or abnormal epigenetic regulation [7]. Promoters of tumor suppressor miRNAs are commonly hypermethylated in cancer [8–12]. It is known that reversion of this hypermethylation status could lead to reactivation of their tumor suppressor function in cancer cells [13–15]. The well-known demethylating agent 5’-Aza-2 deoxycytidine (5’-AZA) and its deoxy derivative (Decitabine) are currently used in the treatment of myelodysplastic syndrome (FDA approved) [16] and have been suggested for therapy of diffuse large B-cell lymphoma [10]. Apart from a published study [17], to date neither the therapeutic role of 5’-AZA nor its effects on miRNAome modulation have been appropriately investigated in neuroblastoma. To clarify the role of miRNAs in neuroblastoma, we sought to: (1) investigate the effects of 5’-AZA on the global expression of miRNAs in five commonly used neuroblastoma cell line models; (2) analyze the relationship between the expression of four prioritized miRNAs and the methylation status of their encoding gene promoters; (3) identify and characterize the expression of the most interesting among their targets; (4) assay their involvement in neuroblastoma cell viability; (5) analyze the prognostic value of altered expression of miRNAs and their targets.
RESULTS
MiRNAome expression in neuroblastoma cells after treatment with 5’-AZA
Treatment with 5’-AZA caused remarkable alterations of miRNAome expression in all neuroblastoma cell lines: more than 60% differentially expressed (DE) miRNAs were upregulated (Supplementary Table S1). We focused our analysis on 12 miRNAs (miR-22, miR-29a-3p, miR-34a, miR-126, miR-140-3p, miR-141, miR-181c-5p, miR-202, miR-455-5p, miR-508-3p, miR-517a-3p and miR-576-3p). This choice was based on: (i) their differential expression; (ii) their inclusion in hypermethylated CpG islands in neuroblastoma or other neoplasias; (iii) known overexpression after treatment with demethylating agents in various types of cancers; (iv) known downregulation in neuroblastoma; (v) functional relationship with MYCN. These miRNAs were identified as DE and upregulated in at least three neuroblastoma cell lines (Supplementary Table S2). The promoter of the genes encoding seven of them (miR-29a-3p, miR-34a, miR-126, miR-141, miR-181c-5p, miR-202 and miR-517a-3p) contained CpG islands, whose methylation significantly decreased after treatment with 5’-AZA (see later). Apart from intronic miR-126, all other miRNAs are intergenic. A previous report by Watanabe K et al. demonstrates that miR-126 expression may be regulated by the methylation status of an upstream CpG island, located within an intron of its host gene EGFL7 [18]. Single TaqMan expression assays (STAs), extended to miR-34b (another member of the miR-34 cluster), revealed that miR-29a-3p, 34b-3p, 181-c-5p and 517a-3p are upregulated in at least three different neuroblastoma cell lines (Table 1).
Table 1: DE miRNAs after treatment with 5’-AZA
DE miRNA |
Cell line |
RQ vs miR-24 |
RQ vs U6 |
|---|---|---|---|
miR-29a-3p |
ACN |
1.91 |
1.82 |
GIMEN |
1.34 |
2.45 |
|
SH-SY5Y |
1.7 |
1.8 |
|
SK-N-BE(2)-C |
2.3 |
2.25 |
|
SK-N-SH |
2.91 |
2.78 |
|
miR-34a |
ACN |
2.65 |
2.52 |
GIMEN |
2.17 |
3.98 |
|
SH-SY5Y |
0.32 |
0.88 |
|
SK-N-BE(2)-C |
0.55 |
0.54 |
|
SK-N-SH |
0.56 |
0.54 |
|
miR-34b-3p |
ACN |
5.21 |
4.97 |
GIMEN |
1.43 |
2.61 |
|
SH-SY5Y |
0.17 |
0.47 |
|
SK-N-BE(2)-C |
5.68 |
5.56 |
|
SK-N-SH |
1.75 |
0.72 |
|
miR-126 |
ACN |
12.47 |
11.9 |
GIMEN |
3.23 |
5.91 |
|
SH-SY5Y |
0.97 |
2.67 |
|
SK-N-BE(2)-C |
0.18 |
0.18 |
|
SK-N-SH |
1.17 |
1.12 |
|
miR-141 |
ACN |
2.24 |
2.13 |
GIMEN |
3.51 |
6.44 |
|
SH-SY5Y |
0.15 |
0.41 |
|
SK-N-BE(2)-C |
0.87 |
0.85 |
|
SK-N-SH |
1.07 |
1.03 |
|
miR-181c-5p |
ACN |
2.11 |
2.01 |
GIMEN |
2.08 |
3.81 |
|
SH-SY5Y |
1.79 |
4.9 |
|
SK-N-BE(2)-C |
1.64 |
1.61 |
|
SK-N-SH |
1.19 |
1.14 |
|
miR-202 |
ACN |
1.46 |
1.39 |
GIMEN |
4.82 |
8.84 |
|
SH-SY5Y |
0.59 |
1.61 |
|
SK-N-BE(2)-C |
1.46 |
1.43 |
|
SK-N-SH |
1.3 |
1.25 |
|
miR-517a-3p |
ACN |
1.06 |
1.01 |
GIMEN |
1.54 |
1.5 |
|
SH-SY5Y |
1.99 |
2.71 |
|
SK-N-BE(2)-C |
1.77 |
1.73 |
|
SK-N-SH |
2.06 |
1.97 |
CpG island methylation status of DE miRNAs encoding genes following 5’-AZA treatment
Treatment with 5’-AZA determined a statistically significant decrease of the methylation of specific CpG islands, located upstream to the promoter of the genes encoding miR-29a, miR-34b/c, miR-126, miR-181c/d, miR-200c/141, miR-202 and miR-517a (Table 2). Detailed data on the methylation status within the CpG islands analyzed, before and after 5’-AZA treatment, are reported in Supplementary Table S3.
Table 2: Percentage of methylation of CpG islands, before (control) and after 5’-AZA treatment
miR-29a |
miR-34b/c |
miR-126 |
miR-181c/d |
miR-200c/141 |
miR-202 |
miR-517a |
||||||||
|---|---|---|---|---|---|---|---|---|---|---|---|---|---|---|
NB cell lines |
Control (%) |
5’Aza (%) |
Control (%) |
5’Aza (%) |
Control (%) |
5’Aza (%) |
Control (%) |
5’Aza (%) |
Control (%) |
5’Aza (%) |
Control (%) |
5’Aza (%) |
Control (%) |
5’Aza (%) |
ACN |
85 |
80 |
44 |
38 |
46 |
43 |
59 |
47 |
84 |
70 |
34 |
35 |
80 |
78 |
GI-ME-N |
90 |
73 |
88 |
79 |
84 |
66 |
94 |
62 |
86 |
65 |
88 |
66 |
96 |
77 |
SK-N-BE(2)-C |
89 |
73 |
93 |
76 |
48 |
39 |
88 |
60 |
89 |
60 |
88 |
73 |
90 |
80 |
SK-N-SH |
85 |
60 |
56 |
44 |
34 |
25 |
87 |
52 |
86 |
54 |
85 |
53 |
88 |
66 |
SH-SY5Y |
84 |
58 |
13 |
10 |
86 |
53 |
92 |
49 |
96 |
54 |
74 |
60 |
95 |
72 |
p-value |
0.009 |
0.02 |
0.05 |
0.004 |
0.004 |
0.04 |
0.02 |
|||||||
Expression of candidate miRNAs in murine neuroblastoma biopsies
Sequences of miR-29a-3p, 34b-3p and 181c-5p are perfectly conserved between humans and rodents. The data reported by Beckers et al., following R2 microarray and visualization platform analyses (see Materials and Methods), showed a marked downregulation of miRNAs 29a-3p and 34b-3p in mouse neuroblastoma samples with respect to controls in a neuroblastoma progression model (Supplementary Figure S1) [19]. The same dataset did not show any significant variation in the expression of miR-181c-5p. Data on the expression of miR-517a-3p are not available due to the absence of the gene encoding this miRNA in the mouse genome.
Expression of candidate miRNAs in neuroblastoma cell lines
Expression profiling of candidate miRNAs in GI-ME-N, SK-N-BE(2)-C, SK-N-SH and SH-SY5Y revealed a statistically significant downregulation of miR-181c-5p and 517a-3p in all cell lines. MiR-29a-3p was downregulated in SK-N-BE(2)-C, SK-N-SH and SH-SY5Y. MiR-34b-3p was significantly downregulated in SK-N-BE(2)-C and GI-ME-N (Supplementary Figure S2A). In all these experiments, adrenal gland was used as calibrator tissue.
Selection of DE miRNAs targets
In silico analysis of DE miRNAs targets allowed to select four validated targets for both miR-29a-3p (CDK6, DNMT3A, DNMT3B, RAN) and miR-181c-5p (BCL2, GATA6, KIT, SIRT); five validated targets for miR-34b-3p (BCL2, CCNE2, CDK4, E2F3, MYB); four predicted targets for miR-517a-3p (IFNAR1, OLFM3, TNIP1, WEE1) (Supplementary Table S4). Expression of these 16 targets was assayed in SH-SY5Y and SK-N-BE(2)-C after treatment with 5’-AZA. Eight targets resulted significantly downregulated after treatment with 5’-AZA: CDK6 and DNMT3B (validated targets of miR-29a-3p), E2F3 (validated target of miR-34b-3p), and OLFM3 and IFNAR1 (predicted targets of miR-517a-3p) were downregulated in both cell lines. DNMT3A (validated target of miR-29a-3p), BCL2 (validated target of both miR-34b-3p and miR-181c-5p), CCNE2 (validated target of miR-34b-3p) were downregulated only in SH-SY5Y (Figure 1).
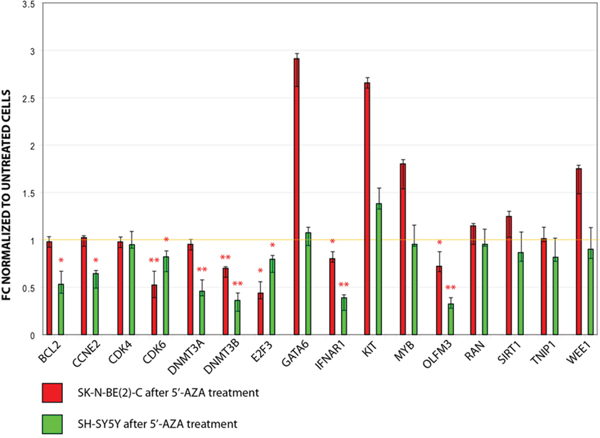
Figure 1: Expression of candidate miRNAs targets in SH-SY5Y and SK-N-BE(2)-C after treatment with 5’-AZA. Values are reported as fold change (FC) versus untreated cells (controls). * p-value < 0.05; ** p-value < 0.01 (Student’s t-test, n = 3).
Targets expression in SK-N-BE(2)-C and SH-SY5Y transfected with miRNAs mimics
Efficiency of SK-N-BE(2)-C and SH-SY5Y transfection with miRNAs mimics is shown in Supplementary Figure S3. Only replicates with a transfection efficiency > 80% were considered for downstream assays. CDK6, DNMT3A, DNMT3B (targets of miR-29a-3p) and CCNE2, E2F3 (targets of miR-34b-3p) were downregulated in both cell lines after transfection with the respective miRNAs mimics, compared to matched scramble-transfected cells in at least one time point (Figure 2). CDK6, DNMT3A and DNMT3B show conserved miR-29a-3p binding sites as retrieved through TargetScan (Supplementary Table S5). Alignments among miRNAs and their targets revealed by microRNA.org are shown in Supplementary Figure S4.
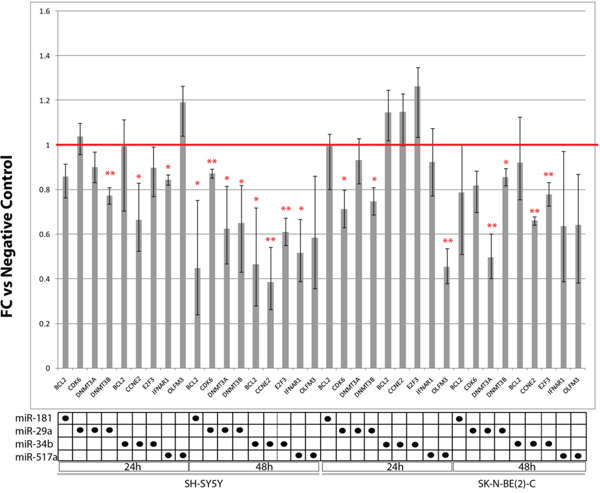
Figure 2: Expression of candidate miRNAs targets in SH-SY5Y and SK-N-BE(2)-C transfected with miRNAs mimics for 24 h and 48 h. Values are reported as fold change (FC) versus scramble-transfected cells (negative controls). * p-value < 0.05; ** p-value < 0.01 (Student’s t-test, n = 3).
Expression of candidate miRNAs targets in neuroblastoma cell lines
CCNE2, CDK6, DNMT3B and E2F3 resulted overexpressed in SK-N-BE(2)-C, SK-N-SH and SH-SY5Y cell lines with respect to adrenal gland; DNMT3A was underexpressed in GIMEN, SK-N-BE(2)-C, SK-N-SH and SH-SY5Y cell lines (Supplementary Figure S2B). A negative correlation (even though statistically not significant) among miR-29a-3p, DNMT3A (r = -0.48) and DNMT3B (r = -0.60), as well as among miR-34b-3p and its candidate targets CCNE2 (r = -0.14) and E2F3 (r = -0.19) was observed. Analysis of Tumor Neuroblastoma - SEQC - 498 - RPM - seqcnb1 dataset showed a significant negative correlation between miR-29a and its candidate targets DNMT3A (r = -0.110, p-value=0.01) and CDK6 (r = -0.129, p-value=4.1e-03).
MiR-29a-3p, miR-34b-3p, miR-181c-5p and miR-517a-3p regulate neuroblastoma cell viability
Transfection with miR-29a-3p, miR-34b-3p, miR-181c-5p and miR-517a-3p mimics determined a significant decrease of cell viability, both in SK-N-BE(2)-C and in SH-SY5Y. The more pronounced decrease of cell viability was observed in SH-SY5Y, 48h after transfection with miR-517a-3p mimics (Figure 3). Interestingly, Tumor Neuroblastoma - SEQC - 498 - RPM - seqcnb1 dataset analysis revealed that a decreased expression of miR-181c in neuroblastoma is linked to a worse overall survival (OS), either considering all neuroblastoma patients (χ2 = 11.34, df = 1, p-value = 7.6e-04, n = 498) or selecting only cases with no MYCN amplification (χ2 = 16.51, df = 1, p-value = 4.8e-05, n = 401) (Figure 4A, 4B). Moreover, by considering only neuroblastoma patients who showed relapse or progression of the disease and no MYCN amplification, lower expression of miR-181c was significantly associated with a worse prognosis (χ2 = 8.29, df = 1, p-value = 4.0e-03, n = 120) (Figure 4C). The latter association was not significant when considering the whole cohort of patients that undergoes progression or relapse of the disease (χ2 = 2.2, df = 1, p-value = 0.138, n = 180) (Figure 4D). The analysis performed for different neuroblastoma stages showed a significant association between decreased expression of miR-181c and a worse overall survival of stage 4 neuroblastoma cases with no MYCN amplification (χ2 = 7.17, df = 1, p-value = 7.4e-03, n = 116), but not with amplified MYCN (χ2 = 1.7, df = 1, p-value = 0.192, n = 65) (Supplementary Figure S5). Any significant association was lost when considering all the other neuroblastoma stages (1, 2, 3, 4s). By using the aforementioned dataset, we further observed a relationship between neuroblastoma progression and increased expression of CDK6 (χ2 = 27.50, df = 1, p-value = 1.6e-07), DNMT3A (χ2 = 14.56, df =1, p-value = 1.4e-04), DNMT3B (χ2 = 12.21, df = 1, p-value =4.8e-04), and E2F3 (χ2 = 161.81, df = 1, p-value =4.5e-37).
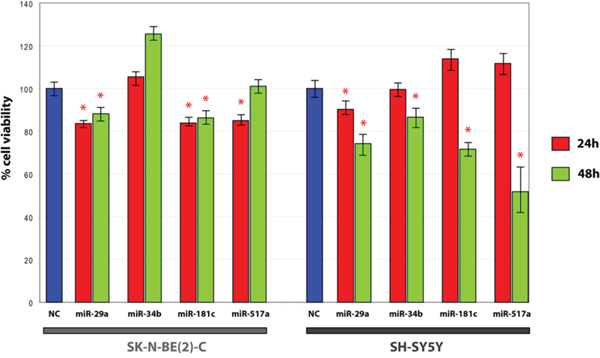
Figure 3: MTT assay in SH-SY5Y and SK-N-BE(2)-C transfected with candidate miRNAs mimics. * p-value < 0.05 (Student’s t-test, n = 6).
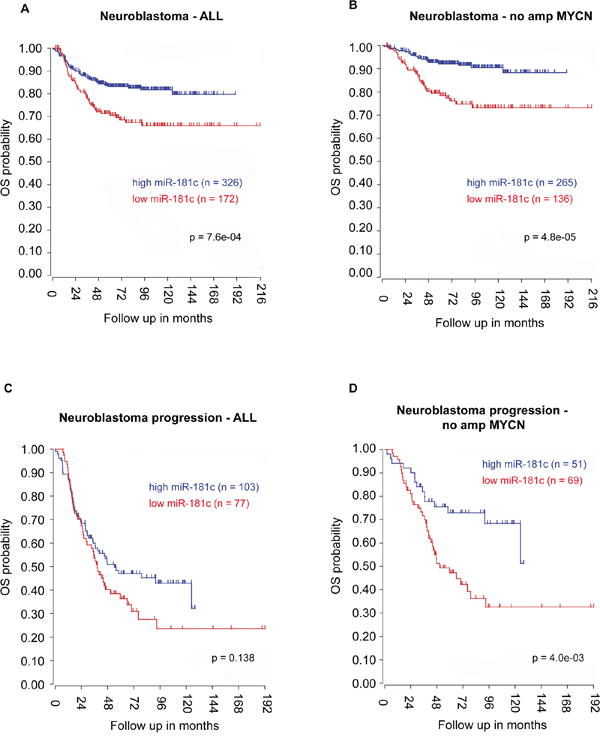
Figure 4: miR-181c expression and neuroblastoma patients’ overall survival (OS). Lower expression of miR-181c is related with a worse OS, either A. in the whole cohort of neuroblastoma samples or B. in only no amplified MYCN cases. Reduced expression of miR-181c is not significantly associated to a worse prognosis when considering the whole cohort of patients who undergo tumor progression event C. this relationship is significant when considering only the cases that progress and have no amplification of MYCN D. The cut off modus for miR-181c expression to draw Kaplan-Meier curves derives from the scan setting.
Network analysis
A network of protein-protein interactions was generated from nodes CDK6, DNMT3A, DNMT3B (targets of miR-29a-3p) and CCNE2 and E2F3 (targets of miR-34b-3p) and extended to their first neighbor interactants. This network comprises 120 nodes and 726 edges and it is centered on 21 hub nodes (See Materials and Methods). DNMT3A, DNMT3B and E2F3 are hubs of the network (Supplementary Table S6). Overall, the network is enriched in biological functions such as cell cycle, DNA methylation, neurogenesis (Hypergeometric test; Benjamini & Hochberg FDR Correction; p ≤ 0.01) (Figure 5).
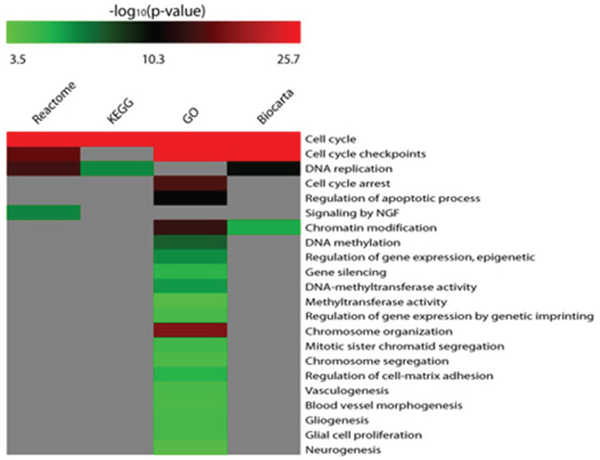
Figure 5: Matrix of enriched biological functions within the biological networks of DE miRNAs targets. The higher is the p-value, the more significant is the enrichment in a specific pathway or Gene ontology (GO).
DISCUSSION
We investigated the involvement of miRNAs encoding genes and the role of their promoter methylation in neuroblastoma. Expression profiling of 754 miRNAs, combined with methylation assays of specific CpG islands and in silico analyses, allowed us to focus on miR-29a-3p, miR-34b-3p, miR-181c-5p and miR-517a-3p. MiR-29a-3p is known to be downregulated in neuroblastoma [20, 21] and several miR-29 family members are known to play a leading role in cancer etiology and pathogenesis [22]. According to public databases, our data strongly suggest CDK6, DNMT3A and DNMT3B as direct targets of miR-29a-3p: disallowed tumor-suppressive function of this miRNA may stimulate tumorigenesis by promoting cell cycle progression and altering de novo methylation of the genome. On the contrary, an experimental increase of miR-29a-3p levels is linked to decreased viability of neuroblastoma cells. Expression of miR-34b-3p is known to be epigenetically regulated by 5’-AZA [23], but to date its altered expression has not been associated with neuroblastoma. MiR-34a (another member of the miR-34 family) is a known tumor suppressor in neuroblastoma; it has been suggested as an epigenetic target for treatment of diffuse large B-cell lymphoma by 5’-AZA [10, 24, 25]. Our data suggest tumor-suppressor properties also for miR-34b-3p in neuroblastoma: its increased expression is linked to decreased levels of neuroblastoma cell viability. Based on our data and according to public databases, we suggest that CCNE2 and E2F3 are two candidate targets: interestingly, both genes are known to be involved in cell cycle progression. MiR-181c-5p is a known tumor suppressor in neuroblastoma: it belongs to the miR-181 family, whose members are known to be upregulated after MYCN silencing [26, 27]. Expression of miR-181c-5p and miR-517a-3p is known to be reactivated by 5’-AZA in gastric and bladder cancer, respectively [28, 29]. The link between miR-181c underexpression and poor outcome of neuroblastoma patients (found by querying public databases) suggests a potential prognostic value of this miRNA. Interestingly, this prognostic value seems to be restricted to stage 4 neuroblastoma patients and to be independent of MYCN amplification status, which alone is a known negative prognostic factor. A similar consideration may be made for CDK6, DNMT3A, DNMT3B and E2F3, which we propose as targets for miR-29a-3p and miR-34b-3p: their increased expression is related to poor prognosis. No links between miR-517a-3p and neuroblastoma have been published to date, notwithstanding it has been proposed as a tumor suppressor in several cancers [30, 31]. Our data convincingly suggest that this miRNA is a new tumor suppressor in neuroblastoma. Involvement of our candidate miRNAs in neuroblastoma pathways is also suggested by our in silico network analysis: nodes within the network were found to be enriched in several cancer-related biological functions, as well as in neurodevelopment. In conclusion, our experimental data demonstrate that miR-29a-3p, miR-34b-3p, miR-181c-5p and miR-517a-3p are involved in neuroblastoma and are potential new therapeutic targets in neuroblastoma.
MATERIALS AND METHODS
Cell cultures and treatments
Neuroblastoma cell lines ACN, GI-ME-N, SH-SY5Y, SK-N-BE(2)-C and SK-N-SH were provided by the Biologic Bank and Cell Factory of the IRCCS AOU San Martino-IST, Genova, Italy. Authenticity of cell lines was confirmed with Short Tandem Repeat (STR) analysis; cell lines were routinely tested and found free of mycoplasm contamination. ACN, GI-ME-N, SK-N-BE(2)-C and SK-N-SH were grown in RPMI 1640 medium (Sigma, S. Louis, MO, USA), whereas for SH-SY5Y cells DMEM medium (GIBCO) was used; tissue culture media were supplemented with 10% FBS (Sigma) and 2mM L-Glutamine (Lonza, Basel, Switzerland), 50 IU/mL sodium penicillin G, 50 μg/mL steptomycin sulphate (Cambrex, East Rutherford, NJ, USA), at 37 °C under a water saturated 95% air- 5% CO2 atmosphere. SK-N-BE(2)-C, GI-ME-N, ACN and SH-SY5Y were treated in the presence or absence of 5μM 5’-AZA (Sigma) for 144 h, while SK-N-SH was treated for 72 h. Both medium and drug were refreshed daily.
RNA isolation, reverse transcription and miRNAome profiling by TaqMan low density array
Total RNA was extracted by using TriZol (Lifetechnologies™, Carlsbad, CA, USA) and tested by Qubit (Lifetechnologies™) and spectrophotometry to assess its quantity and quality, respectively [32]. Total RNA from the adrenal gland was purchased from Takara Clontech® (Mountain View, CA, USA): normal adrenal glands were pooled from 62 Caucasian males/females (15-61 years old), who had died of sudden death. We reverse transcribed 100 ng of total RNA with pools of miRNAs-specific primers; there were then pre-amplified [32]. Amplified products were loaded on TaqMan® Low Density Arrays (TaqMan® Human MicroRNA Array v3.0 A and B, Lifetechnologies™). To profile the expression of 754 miRNAs, Real-Time PCR was performed on a 7900HT Fast Real-Time PCR System (Lifetechnologies™).
MiRNA expression data analysis
High-throughput real-time PCR data were quantitatively normalized by using the global median normalization method: Ct values from each sample were normalized to the median Ct of the array representing the sample. By performing Pearson’s correlation between Ct values of each miRNA and median and mean Ct values of each array, we identified three RNAs (miR-24, RNU6 and RNU48), whose r-values were higher than 0.9. These RNAs were among the most stable within TLDAs by applying two different algorithms: DataAssist v.3 (Lifetechnologies™) and geNorm [33]. Accordingly, miR-24, RNU6 and RNU48 were selected as endogenous controls for downstream real-time PCR analysis. Relative quantities of miRNAs in treated and control samples were calculated by 2-ΔΔCT method [34]. Statistically significant DE miRNAs were identified by SAM (Significance of Microarrays Analysis) algorithm (http://www.tm4.org), applying a two-class paired test on ΔCt values of treated and control samples. P-values were based on permutation (100 permutations), imputation engine used K-nearest neighbors (10 neighbors); false discovery rate (FDR) was tuned to < 0.15. We considered DE miRNAs those that: (1) were significantly DE by using all three endogenous controls; (2) had fold-changes (FC) <0.5 (underexpression) or >1.9 (overexpression); (3) whose raw data passed a quality check. Relative quantities (RQ) < 1 were converted to negative FC by the formula: FC = -1/RQ. Matrixes of miRNAome profiles were obtained by using ΔCt in MeV04 (http://www.tm4.org/mev.html) [32].
Human and mouse datasets and survival analysis
By using R2 platform (http://r2.amc.nl), we analyzed the expression of miRNAs and their targets. We specifically used the following datasets: Neuroblastoma Ghent (Array Express: E-MTAB-2618) [19] and Neuroblastoma SEQC (GEO: GSE62564). Kaplan Mier curves were obtained through R2 as described by Matas-Rico E et al. [35].
mRNA target expression analysis
MiRNA target expression was assayed by SYBR Green RT-PCR, according to the manufacturer’s instructions (Lifetechnologies™). RQs and FCs of miRNA targets were calculated as reported above. HPRT was used as endogenous control. Primers to amplify miRNA targets were designed through Primer-BLAST (http://www.ncbi.nlm.nih.gov/tools/primer-blast/): their sequences are available upon request.
DNA extraction and sodium bisulfite modification
Genomic DNA was extracted from 5’-AZA-treated and untreated (control) neuroblastoma cell lines through QIAamp DNA Mini Kit (Qiagen, Milan, Italy), according to the manufacturer’s instructions. DNA was chemically modified with sodium bisulfite using the Epitect Bisulfite kit (Qiagen), according to the manufacturer’s instructions [36].
CpG island retrieval
EMBOSS Cpgplot (http://www.ebi.ac.uk/Tools/seqstats/emboss_cpgplot/) was used to retrieve CpG islands within a window of 10 Kbps upstream each miRNA genomic locus (considered criteria: Observed/Expected ratio > 0.60;Percent C + Percent G > 50.00; Length > 200).
Pyrosequencing assay
PCR and sequencing primers were designed with the Pyrosequencing Assay Design Software (Qiagen) to recognize part of the CpG islands in the putative regulatory regions of the miRNAs analyzed. These primers were used to amplify and sequence the bisulfite-modified DNA from neuroblastoma cell lines. Pyrosequencing assays were performed with a SPQ 96MA instrument (Qiagen) and sequencing reactions were performed with the Pyro Gold reagent kit SPQ 96MA, according to manufacturer’s instructions. Sequencing data were analyzed using the Pyro Q-CpG software (version 1.0.9).
Selection of candidate miRNAs
Selection of candidate DE miRNAs, to be investigated through functional assays, was based on the following criteria: (i) RQ values (the more they are upregulated, the more they are considered as involved in the effectiveness of 5’-AZA treatment); (ii) their (or their validated or predicted targets) known involvement in cancer, as suggested by specialized databases (http://bioinfo.au.tsinghua.edu.cn/member/jgu/oncomirdb/) and literature; (iii) presence of CpG islands (validated or predicted, see later) within their promoter region; (iv) regulatory and functional interaction with the oncogene MYCN.
Transfection with miRNA mimics
SK-N-BE(2)-C and SH-SY5Y cells were grown in 12- and 24-well plates, respectively, at a density of 1.2 x 10⁵ and 6 x 10⁴ cells per well. Cells were transiently reverse-transfected with 30 pmoles of miR-29a-3p, miR-34b-3p, miR-181c-5p and miR-517a-3p mimics or equal amounts of scrambled molecules for 24h and 48h, by using siPORTNeoFX Transfection Agent (Ambion®, Austin, TX), according to the manufacturer’s instruction. All experiments were performed in biological triplicates.
MTT assay
Cell viability was evaluated in miRNA mimics-transfected as well as in scramble-transfected cells through MTT assay, as previously described [37]. Briefly, 1.2 x 10⁴ cells / well were reverse-transfected with miR-29a-3p, miR-34b-3p, miR-181c-5p and miR-517a-3p mimics or equal amounts of scrambled molecules and were grown for 24h and 48h. Cell viability was evaluated at the end of each time point. All MTT experiments were performed in six biological replicates; statistical analysis was performed by unpaired T-test (<0.05).
MiRNA target prediction
MiRecords (http://mirecords.biolead.org) and starBase (http://starbase.sysu.edu.cn) were initially queried to retrieve experimentally validated and predicted targets of DE miRNAs, by interpolating 11 different prediction tools. The list of predicted targets, common to miRecords and starBase, was further filtered based on negative correlation between their expression and that of miRNA: data of correlation were retrieved from MiRGator v3.0 (http://mirgator.kobic.re.kr). Evolutionarily conserved miRNA binding sites and miRNA/target alignments were retrieved using TargetScan release 7.1 (http://www.targetscan.org/vert_71/) and microrna.org (http://www.microrna.org/microrna/home.do), respectively.
Functional enrichment of miRNAs’ targets
Biological function of miRNA targets was investigated by the tools DAVID (https://david.ncifcrf.gov/home.jsp) and Fatigo (http://babelomics.bioinfo.cipf.es/): this approach led us to focus on targets specifically involved in cancer-related biological processes.
Network generation and analysis
The biological network of protein-protein interactions was generated through MiMI plug-in [38] and visualized through Cytoscape v3.2.0 [39]. CDK6, DNMT3A, DNMT3B (targets of miR-29a-3p), CCNE2 and E2F3 (targets of miR-34b-3p) were given as input and interactions among them and their first interactants were automatically retrieved. Network centrality analysis was performed as previously described [37].
ACKNOWLEDGMENTS
We thank Prof. M Libra for his interest in our work and Prof. V D’Agata and her Collaborators for allowing us to use their microplate reader. We also acknowledge the kind cooperation of Dr. A Scacciante (CO.DI.SAN Spa). We wish to thank the Scientific Bureau of the University of Catania for language support.
CONFLICTS OF INTEREST
The authors declare no conflicts of interest.
GRANT SUPPORT
This project was supported by: PON HIPPOCRATES, PON02 00355 2964193, Sviluppo di Micro e Nano-tecnologie e Sistemi Avanzati per la Salute dell’uomo to Prof Michele Purrello; Bando Giovani Ricercatori 2008, Ministero della Salute (Italy), Methylome profiling and clinical correlations in Neuroblastoma to Dr Barbara Banelli (IST, Genova); LILT (Lega Italiana Lotta ai Tumori) to Dr Davide Barbagallo.
REFERENCES
1. Hoehner JC, Gestblom C, Hedborg F, Sandstedt B, Olsen L, Påhlman S. A developmental model of neuroblastoma: differentiating stroma-poor tumors’ progress along an extra-adrenal chromaffin lineage. Lab Invest. 1996; 75: 659-675.
2. Cohn SL, Pearson AD, London WB, Monclair T, Ambros PF, Brodeur GM, Faldum A, Hero B, Iehara T, Machin D, Mosseri V, Simon T, Garaventa A et al. The International Neuroblastoma Risk Group (INRG) classification system: an INRG Task Force report. J Clin Oncol. 2009; 27: 289-297.
3. Brodeur GM. Neuroblastoma: biological insights into a clinical enigma. Nat Rev Cancer. 2003; 3: 203-216.
4. Purrello M, Di Pietro C, Viola A, Rapisarda A, Stevens S, Guermah M, Tao Y, Bonaiuto C, Arcidiacono A, Messina A, Sichel G, Grzeschik KH, Roeder R. Genomics and transcription analysis of human TFIID. Oncogene. 1998; 16: 1633-1638.
5. Stallings RL. MicroRNA involvement in the pathogenesis of neuroblastoma: potential for microRNA mediated therapeutics. Curr Pharm Des. 2009; 15: 456-462.
6. Ragusa M, Majorana A, Banelli B, Barbagallo D, Statello L, Casciano I, Guglielmino MR, Duro LR, Scalia M, Magro G, Di Pietro C, Romani M, Purrello M. MIR152, MIR200B, and MIR338, human positional and functional neuroblastoma candidates, are involved in neuroblast differentiation and apoptosis. J Mol Med (Berl). 2010; 88: 1041-1053.
7. Louis CU, Shohet JM. Neuroblastoma: molecular pathogenesis and therapy. Annu Rev Med. 2015; 66: 49-63.
8. Croce CM. Causes and consequences of miRNA dysregulation in cancer. Nat Rev Genet. 2009; 10: 704-714.
9. Sayed D, Abdellatif M. MiRNAs in development and disease. Physiol Rev. 2011; 91: 827-887.
10. Asmar F, Hother C, Kulosman G, Treppendahl MB, Nielsen HM, Ralfkiaer U, Pedersen A, Møller MB, Ralfkiaer E, de Nully Brown P, Grønbæk K. Diffuse large B-cell lymphoma with combined TP53 mutation and MIR34A methylation: Another “double hit” lymphoma with very poor outcome? Oncotarget. 2014; 5: 1912-1925. doi: 10.18632/oncotarget.1877.
11. Donzelli S, Mori F, Bellissimo T, Sacconi A, Casini B, Frixa T, Roscilli G, Aurisicchio L, Facciolo F, Pompili A, Carosi MA, Pescarmona E, Segatto O et al. Epigenetic silencing of miR-145-5p contributes to brain metastasis. Oncotarget. 2015; 6 :35183-35201. doi: 10.18632/oncotarget.5930.
12. Li HP, Huang HY, Lai YR, Huang JX, Chang KP, Hsueh C, Chang YS. Silencing of miRNA-148a by hypermethylation activates the integrin-mediated signaling pathway in nasopharyngeal carcinoma. Oncotarget; 5 : 7610-7624. doi: 10.18632/oncotarget.2282.
13. Starlard-Davenport A, Kutanzi K, Tryndyak V, Word B, Lyn-Cook B. Restoration of the methylation status of hypermethylated gene promoters by miRNA-29b in human breast cancer: A novel epigenetic therapeutic approach. J Carcinog. 2013; 12: 15.
14. Resende C, Ristimäki A, Machado JC. Genetic and epigenetic alteration in gastric carcinogenesis. Helicobacter. 2010; 15: 34-39.
15. Domingo-Fernandez R, Watters K, Piskareva O, Stallings RL, Bray I. The role of genetic and epigenetic alterations in neuroblastoma disease pathogenesis. Pediatr Surg Int. 2013; 29: 101-119.
16. Krawczyk J, Keane N, Freeman CL, Swords R, O’Dwyer M, Giles FJ 5-Azacytidine for the treatment of myelodysplastic syndromes. Expert Opin Pharmacother. 2013; 14: 1255-1268.
17. Das S, Bryan K, Buckley PG, Piskareva O, Bray IM, Foley N, Ryan J, Lynch J, Creevey L, Fay J, Prenter S, Koster J, van Sluis P et al. Modulation of neuroblastoma disease pathogenesis by an extensive network of epigenetically regulated microRNAs. Oncogene. 2013; 32: 2927-2936.
18. Watanabe K, Emoto N, Hamano E, Sunohara M, Kawakami M, Kage H, Kitano K, Nakajima J, Goto A, Fukayama M, Nagase T, Yatomi Y, Ohishi N et al. Genome structure-based screening identified epigenetically silenced microRNA associated with invasiveness in non-small-cell lung cancer. Int J Cancer. 2012; 130: 2580-2590.
19. Beckers A, Van Peer G, Carter DR, Mets E, Althoff K, Cheung BB, Schulte JH, Mestdagh P, Vandesompele J, Marshall GM, De Preter K, Speleman F. MYCN-targeting miRNAs are predominantly downregulated during MYCN-driven neuroblastoma tumor formation. Oncotarget. 2015; 6: 5204-5216. doi: 10.18632/oncotarget.2477.
20. Xu H, Cheung IY, Guo HF, Cheung NK. MicroRNA miR-29 modulates expression of immunoinhibitory molecule B7-H3: potential implications for immune based therapy of human solid tumors. Cancer Res. 2009; 69: 6275-6281.
21. Cheung IY, Farazi TA, Ostrovnaya I, Xu H, Tran H, Mihailovic A, Tuschl T, Cheung NK. Deep MicroRNA sequencing reveals downregulation of miR-29a in neuroblastoma central nervous system metastasis. Genes Chromosomes Cancer. 2014; 53: 803-814.
22. Spizzo R, Nicoloso MS, Croce CM, Calin GA. SnapShot: MicroRNAs in Cancer. Cell. 2009; 137: 586-586.e1.
23. Wang LQ, Kwong YL, Wong KF, Kho CS, Jin DY, Tse E, Rosèn A, Chim CS. Epigenetic inactivation of mir-34b/c in addition to mir-34a and DAPK1 in chronic lymphocytic leukemia. J Transl Med. 2014; 12: 52.
24. Cole KA, Attiyeh EF, Mosse YP, Laquaglia MJ, Diskin SJ, Brodeur GM, Maris JM. A functional screen identifies miR-34a as a candidate neuroblastoma tumor suppressor gene. Mol Cancer Res. 2008; 6: 735-742.
25. Welch C, Chen Y, Stallings RL. MicroRNA-34a functions as a potential tumor suppressor by inducing apoptosis in neuroblastoma cells. Oncogene. 2007; 26: 5017-5022.
26. Schulte JH, Marschall T, Martin M, Rosenstiel P, Mestdagh P, Schlierf S, Thor T, Vandesompele J, Eggert A, Schreiber S, Rahmann S, Schramm A. Deep sequencing reveals differential expression of microRNAs in favorable versus unfavorable neuroblastoma. Nucleic Acids Res. 2010; 38: 5919-5928.
27. Li Y, Wang H, Li J, Yue W. MiR-181c-5p modulates the proliferation, migration, and invasion of neuroblastoma cells by targeting Smad7. Acta Biochim Biophys Sin (Shanghai). 2014; 46: 48-55.
28. Hashimoto Y, Akiyama Y, Otsubo T, Shimada S, Yuasa Y. Involvement of epigenetically silenced microRNA-181c in gastric carcinogenesis. Carcinogenesis. 2010; 31: 777-784.
29. Yoshitomi T, Kawakami K, Enokida H, Chiyomaru T, Kagara I, Tatarano S, Yoshino H, Arimura H, Nishiyama K, Seki N, Nakagawa M. Restoration of miR-517a-3p expression induces cell apoptosis in bladder cancer cell lines. Oncol Rep. 2011; 25: 1661-1668.
30. Ma W, Yu Q, Jiang J, DU X, Huang L, Zhao L, Zhou QI. miR-517a is an independent prognostic marker and contributes to cell migration and invasion in human colorectal cancer. Oncol Lett. 2016; 11: 2583-2589.
31. Yoshitomi T, Kawakami K, Enokida H, Chiyomaru T, Kagara I, Tatarano S, Yoshino H, Arimura H, Nishiyama K, Seki N, Nakagawa M. Restoration of miR-517a expression induces cell apoptosis in bladder cancer cell lines. Oncol Rep. 2011; 25: 1661-1668.
32. Ragusa M, Statello L, Maugeri M, Barbagallo C, Passanisi R, Alhamdani MS, Li Destri G, Cappellani A, Barbagallo D, Scalia M, Valadi H, Hoheisel JD, Di Pietro C et al. Highly skewed distribution of miRNAs and proteins between colorectal cancer cells and their exosomes following Cetuximab treatment: biomolecular, genetic and translational implications. Oncoscience. 2014; 1: 132-157. doi: 10.18632/oncoscience.19.
33. Vandesompele J, De Preter K, Pattyn F, Poppe B, Van Roy N, De Paepe A, Speleman F. Accurate normalization of real-time quantitative RT-PCR data by geometric averaging of multiple internal control genes. Genome Biol. 2002; 3: RESEARCH0034.
34. Livak KJ, Schmittgen TD. Analysis of relative gene expression data using real-time quantitative PCR and the 2(-Delta Delta C(T)) Method. Methods. 2001; 25: 402-408.
35. Matas-Rico E, van Veen M, Leyton-Puig D, van den Berg J, Koster J, Kedziora KM, Molenaar B, Weerts MJ, de Rink I, Medema RH, Giepmans BN, Perrakis A, Jalink K et al. Glycerophosphodiesterase GDE2 Promotes Neuroblastoma Differentiation through Glypican Release and Is a Marker of Clinical Outcome. Cancer Cell. 2016; 30: 548-562.
36. Banelli B, Bonassi S, Casciano I, Mazzocco K, Di Vinci A, Scaruffi P, Brigati C, Allemanni G, Borzì L, Tonini GP, Romani M. Outcome prediction and risk assessment by quantitative pyrosequencing methylation analysis of the SFN gene in advanced stage, high-risk, neuroblastic tumor patients. Int J Cancer. 2010; 126: 656-668.
37. Barbagallo D, Condorelli AG, Ragusa M, Salito L, Sammito M, Banelli B, Caltabiano R, Barbagallo GM, Zappalà A, Battaglia R, Cirnigliaro M, Lanzafame S, Vasquez E et al. Dysregulated miR-671-5p / CDR1-AS / CDR1 / VSNL1 axis is involved in glioblastoma multiforme. Oncotarget. 2016; 7: 4746-4759. doi: 10.18632/oncotarget.6621.
38. Gao J, Ade AS, Tarcea VG, Weymouth TE, Mirel BR, Jagadish HV, States DJ. Integrating and Annotating the Interactome using the MiMI plugin for Cytoscape. Bioinformatics. 2009; 25: 137-138.
39. Shannon P, Markiel A, Ozier O, Baliga NS, Wang JT, Ramage D, Amin N, Schwikowski B, Ideker T. Cytoscape: a software environment for integrated models of biomolecular interaction networks. Genome Res. 2003; 13: 2498-2504.