
INTRODUCTION
Development of the mammalian secondary palate is a complex process, which requires a coordinated network of molecular and cellular events to produce appropriate growth, elevation and fusion of the constituent palatal shelves [1–3]. In humans, palatogenesis occurs relatively early in development, taking place between 5 and 12 weeks of intrauterine life [4]. In the mouse, this process is remarkably similar to that in the human, but occurs more rapidly between embryonic stages (E) 10.5 and E15.5 [5]. Formation of the secondary palate begins with the appearance of two outgrowths from the maxillary process (palatal shelves, PS), which grow vertically to flank the lateral borders of the developing tongue (Figure 1B) [6, 7]. The PS subsequently elevate to a horizontal position above the tongue, which itself descends to help facilitate this process. Following elevation, medial growth of the paired PS towards the midline results in contact and then fusion with each other. During this stage, a transient medial epithelial seam (MES) is generated from the adhered epithelia [8, 9], which progressively disappears as midline confluence is achieved. The secondary PS also fuse with the primary palate anteriorly at the incisive foramen and complete confluence is usually observed around the twelfth week of human embryogenesis (E15.5 in mice) (Figure 1) [4, 8].
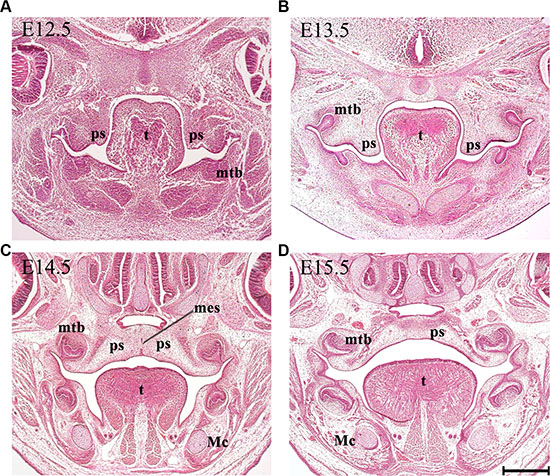
Figure 1: Palatogenesis in the mouse. Representative histological frontal sections from the middle region of the developing palate at each indicated stage. (A) The secondary palate arises as paired outgrowths. (B) The PS initially grow vertically flanking the developing tongue. (C) The PS reorient to the horizontal position above the dorsum of the tongue in a process known as palatal shelf elevation. The fusion of palatal shelves involves the formation of a MES. (D) Subsequent disintegration of the MES allows mesenchymal confluence. Mc, Meckel’s cartilage; mes, medial epithelium seam; mtb, molar tooth bud; ps, palatal shelf; t, tongue. Scale bar in D = 200 μm for A–D.
The Hedgehog (Hh) family of signaling molecules have emerged as major contributors to the developmental process in a wide variety of organisms, coordinating cell proliferation, survival and differentiation in multiple tissues [10–13]. Dysfunction of Hh signaling underlies a number of human developmental abnormalities and diseases, making it an important therapeutic target [10]. More specifically, genetic defects in the pathway can cause Holoprosencephaly (HPE) [14] or complex genetic diseases, such as Pallister–Hall syndrome [15] and Basal Cell Nevus Syndrome (BCNS) [16–18]. The Hh signaling pathway can undergo aberrant activation through the overexpression of Hh ligands, loss of receptor and co-receptor function or dysregulation of downstream transcription factors. All these aberrations in Hh signaling have been implicated in the initiation and progression of multiple cancer types, including breast, prostate, hepatocellular, pancreatic and brain cancers [11]. Sonic hedgehog (Shh) is the most comprehensively studied member of the Hh family [10] with the secreted ligand binding the primary Patched-1 (Ptch1) receptor to effect signal transduction [19, 20]. In the absence of ligand, Ptch1 acts as a ligand-independent inhibitor of the transmembrane protein Smoothened (Smo), a positive regulator of the pathway [10, 21, 22]. This regulation of Shh activity takes place in the primary cilium, by an as yet undefined mechanism [23–26]. Once the repression exerted by Ptch1 is released by Shh binding, increased ciliary levels of Smo lead to active transcription of Gli (Glioma-associated oncogene family members) transcription factors, through binding of specific consensus sequences located in the promoter region of target genes [10, 21]. More recently, the complexity of Shh signal regulation has become further evident as new proteins involved in modulating the pathway have been uncovered [21]. Among these, Growth arrest-specific 1 (Gas1) [27, 28], Cell-adhesion-molecule-related/downregulated by oncogenes (Cdon) [29, 30] and Biregional Cdon-binding protein (Boc) have been established as essential co-receptors that promote Shh signal transduction within a number of developmental contexts [31, 32]. Interestingly, some mutations causing HPE impair the palmitate-dependent interaction between Shh and Ptch1 [33, 34]. This interaction is also abolished in the BCNS, a congenital predisposition to cancers driven by hyperactive Hh signaling, such as basal cell carcinoma and medulloblastoma [34]. Not surprisingly, the features of HPE and aggressive basal-cell carcinomas have been previously reported in the same individual [35].
Gas1 is a N-glycosylated glycosylphosphatidyl inositol (GPI)-linked plasma membrane protein originally isolated via differential screening of fibroblasts maintained under growth arrest [36, 37]. Subsequently, GAS1 was mapped to human chromosome 9q21.3-22.1 and established as a negative cell cycle regulator and tumor suppressor [38]. The first link between Hh signaling and Gas1 was established through immunoprecipitation assays demonstrating Gas1 as capable of binding Shh and reducing its action [39]. However, subsequent in vivo studies have argued against these initial in vitro observations [27, 28, 40, 41]. Analysis of Gas1 mutant mice have demonstrated malformations characteristic of Shh loss-of-function, including micropthalmia [42], HPE [27, 28], axon guidance deficiency and neural tube patterning defects [40, 41]. Moreover, depletion of Shh dosage in a Gas1 mutant background leads to even more severe developmental defects [40]. These correlations and genetic interactions support the view that Gas1 is a positive component of the Shh signaling pathway [27, 28, 40]. Boc was identified via screening of a human fetal brain cDNA library using a rat Cdon cDNA probe [43]. Biochemical analysis depicts Boc with a single transmembrane domain and four immunoglobulin like loops plus three fibronectin type III (FNIII) repeats in its ectodomain [43, 44]. BOC localizes to the plus strand of human chromosome 3q13.2 [45]. A study on the guidance of commissural axons in mice provided evidence to correlate Boc and Shh signaling [46]. Boc was shown to act as a receptor, capable of interacting directly with Shh via its third FNIII repeat (FNIIIc) [46]. Moreover, immunopreciptation experiments demonstrated that Boc can also physically bind to Ptch1 [31]. Interestingly, the presence of Shh does not alter the ability of Ptch1 to bind Boc, suggesting a constitutive interaction [31]. Recently, mutations affecting CDON disrupted its ability to interact with GAS1 and PTCH1, reinforcing the importance of these interactions for appropriate SHH signal reception. This mutation-induced disruption of interactions between SHH co-receptors has been shown to be a mechanism in HPE, a congenital anomaly associated with diminished Shh activity [47]. Taken together, these data have established the concept that these molecules can act as Hh co-receptors [32].
Shh transcriptional activity is detected in epithelium of the developing PS [48, 49] and the ligand plays a key role in mediating palatal outgrowth and patterning through an interaction with Fgf10 in the underlying mesenchyme [50]. Shh is also involved in a further regulatory feedback loop between epithelium and mesenchyme during growth of the PS, interacting with Bmp4 and Msx1 to induce proliferation in the mesenchyme [51]. Shh is also able to promote cell proliferation in the palatal mesenchyme via the activation of additional transcription factors, including Foxf1a, Foxf2 and Osr2 [52, 53]. More recently, tissue-specific deletion of Pax9 from mesenchyme of the PS has been shown to indirectly regulate Shh expression in the adjacent epithelium and downregulate key targets in the mesenchyme (Bmp4, Fgf10 and Msx1), placing Pax9 upstream of this complex gene network [54, 55]. Gas1–/– mice also demonstrate cleft of the secondary palate (CP) with 50% penetrance, which is associated with reduced Shh signal transduction [28]. We have previously demonstrated that fine-tuning of Shh transduction is also crucial for PS fusion. The PS of transgenic mice overexpressing Shh in the PS epithelium under control of a Keratin-14 promotor (K14-Shh) demonstrate reduced cell death in the MEE, which prevents PS fusion [56]. Collectively, these findings highlight the importance of undisturbed Shh signaling during the events underlying normal palatogenesis.
There are currently over one thousand identified loci associated with orofacial clefting [57], but only around half of these have a defined molecular basis [58]. A precise integration between cell cycle regulation and cell-type specification is required during embryogenesis to direct the appropriate formation and function of each tissue. Gas1 and Boc have been shown to be key for harmonious integration of these two programs [31, 59–61]. Furthermore, disruption of Gas1 and Boc has highlighted their importance in human diseases, including cancer [59, 62–64]. In the present investigation, we aim to further elucidate potential interactions between Gas1 and Boc during cell cycle regulation in the developing palate. Significantly, ablation of Boc in a Gas1 mutant background led to reduced Shh activity in the PS and increased severity of the CP phenotype. This was associated with failed PS elevation, increased mesenchymal proliferation and reduced epithelial cell death. Our findings suggest a dual requirement for Boc and Gas1 during early palatogenesis, mediating cell proliferation during growth and cell survival during subsequent PS fusion.
RESULTS
Normal expression of Shh, Ptch1, Gas1 and Boc during secondary palate development
Shh transcriptional activity was observed in the developing rugae of the PS oral epithelium between E12.5-14.5 (Figure 2A–2C), with transient transcriptional activity also seen in the future MEE region at E12.5 (Figure 2A). Shh signaling was therefore active during growth and elevation of the PS and confirmed by the presence of strong Ptch1 expression in condensed mesenchyme adjacent to regions of Shh expression (Figure 2D–2F). However, Ptch1 expression was not observed in the MES during fusion (Figure 2F). Gas1 showed widespread expression within PS mesenchyme during growth of these structures in regions adjacent to those expressing Ptch1 (Figure 2G–2I). Interestingly, Gas1 was also upregulated in nasal epithelium of the PS following fusion (Figure 2I). In contrast, Boc showed diffuse low-level transcription in PS mesenchyme but strong expression within the epithelium at E12.5 (Figure 2J). Although the epithelial expression was somewhat downregulated at E13.5 (Figure 2K), transcripts were still observed in the mesenchyme. Following PS elevation and fusion, Boc transcriptional activity was detected throughout the oral palatal epithelium and within the region of the MES (Figure 2L).
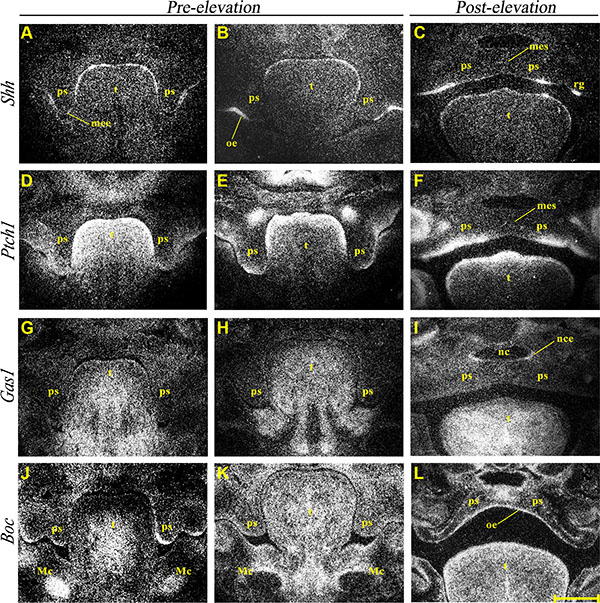
Figure 2: Normal expression of Shh, Ptch1, Gas1 and Boc during palate development. Radioactive in situ hybridization showing frontal sections of medial developing palate at pre (E12.5 A, D, G, J and E13.5 B, E, H, K) and post palatal shelf elevation (E14.5 C, F, I, and E15.5 L) and normal mRNA expression of Shh (A–C), Ptch1 (D–F), Gas1 (G–I) and Boc (J–L). Mc, Meckel’s cartilage; mee, medial edge epithelium; mes, medial epithelium seam; nc, nasal cavity; nce, nasal cavity epithelium; oe, oral epithelium; ps, palatal shelf; rg, rugae; t, tongue. Scale bar in L = 200 μm for A–L.
Interactions between Gas1 and Boc during palatogenesis
Histological analysis of Gas1+/–; Boc+/– mice demonstrated a craniofacial midline comparable to wild type mice, with normal palatal development (Figure 3A–3C). Gas1–/–; Boc+/– mice exhibited microfom HPE, which has been previously described in Gas1- /- mice [28, 61] and includes CP with incomplete penetrance (Figure 3D–3F). In agreement with previous investigations, Boc–/– mice were viable, did not display any gross craniofacial phenotype and could not be distinguished from their wild type littermates [30, 31, 61]. Moreover, palatal development was not affected by an absence of Boc function (Figure 3G–3I). In contrast, Gas1–/–; Boc–/– compound mutant mice exhibited a fully penetrant CP associated with a failure of PS elevation above the tongue (Figure 3J–3L). In addition, an abnormally positioned vomeronasal organ was observed and a cleft tongue present in the pharyngeal region (Figure 3L). Significantly, the more severe craniofacial phenotype observed in Gas1; Boc compound mutants was associated with a reduction in expression levels of the Shh target genes Ptch1 and Gli1, respectively (Figure 4A–4C; 4D–4F). However, transcriptional activity of Shh was seemingly unaltered when compared to control Gas1+/–; Boc+/– mice (Figure 4G–4I).
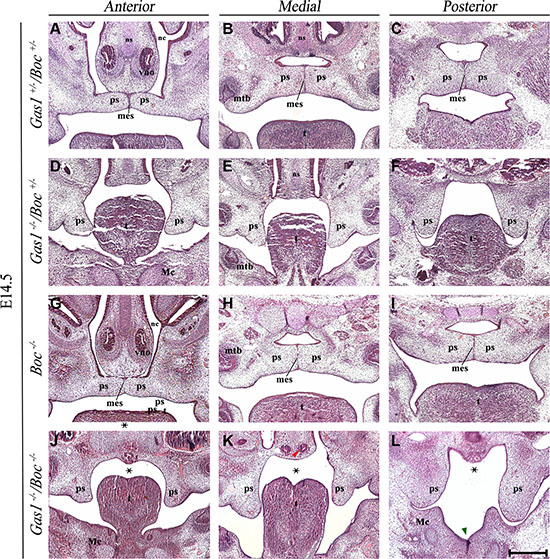
Figure 3: Histological phenotype of Gas1+/−; Boc+/−, Gas1−/−, Boc+/−, Boc−/− and Gas1−/−; Boc−/− palate. Frontal sections of H&E stained E14.5 embryos through the anterior, medial and posterior palate. Gas1+/−; Boc+/− (A–C), Gas1–/–;Boc+/− (D–F), Boc−/− (G–I) and Gas1−/−; Boc−/− (J–L). The midline clefting within the posterior third of the tongue in the Gas1−/−; Boc−/− embryo is highlighted by the green arrowhead in L. Abnormal positioning of the vno is highlighted by the red arrowhead in K. The black asterisks (J-L) indicate the CP associated with a failure of palatal shelf elevation observed in Gas1−/−; Boc−/− mice. Mc, Meckel’s cartilage; mes, medial epithelium seam; mtb, molar tooth bud; nc, nasal cavity; ns, nasal septum; ps, palatal shelf; t, tongue; vno, vomeronasal organ. Scale bar in L = 200 μm for A–L.
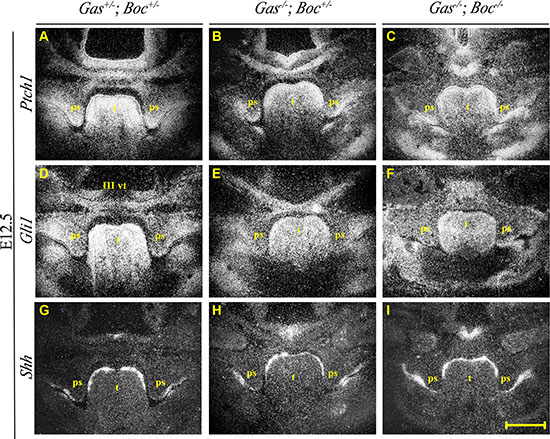
Figure 4: Expression of Ptch1, Gli1 and Shh during palate development at E12.5 in Gas1; Boc compound mutants. Radioactive in situ hybridization showing frontal sections of the medial developing palate at stage E12.5 of Gas1+/−; Boc+/− (A, D and G), Gas1−/−;Boc+/− (B, E and H) and Gas1−/−; Boc−/− (C, F and I) mice. Ptch1 (A–C), Gli1 (D–F) and Shh (G–I). III vt, third ventricle; ps, palatal shelf; t, tongue. Scale bar in I = 200 μm for A–I.
Palatal shelf mesenchymal cell packing and proliferation indices in the absence of Gas1 and Boc function
The phenotypic analysis of Gas1 and Boc single and compound mutant mice was suggestive of a role for these co-receptors during the regulation of PS growth. We therefore analysed the PS phenotype in these mutants at the cellular level, specifically focusing on the mesenchymal component Figure 5. In mesenchymal tissues, the extracellular matrix can contribute significantly to tissue volume, therefore we also incorporated a measure of cell spacing [65]. Specifically, we generated a cell packing index (CPI) and a proliferation index per unit area (PIPUA) within the PS using image segmentation to determine total and BrdU-positive cells within the mesenchyme [66]. A descriptive analysis of the CPI is shown in Table 1, containing the number of PS analysed for each genotype, the median, range and interquartile range. Kruskal-Wallis test revealed a statistical significant difference among the four genotypes analyzed (p < 0.001). Table 2 illustrates the Poisson regression analysis performed to evaluate CPI differences among the genotypes. Post hoc pairwise comparisons demonstrated that the only non-statistical significant result was the CPI difference between Gas1- /-; Boc–/– and Gas1+/–; Boc+/– PS (p = 0.636) (Figure 6B). In fact, the same median was observed for both groups (Gas1–/–; Boc–/– and Gas1+/–; Boc+/–) (Table 1). Gas1–/–; Boc+/– PS showed a higher CPI compared to control (Gas1+/–; Boc+/–); whereas Boc–/– PS showed the lowest CPI amongst genotypes (Figure 6B, Table 2). The CPI is a measure of cell density; that is the number of cells per region of interest. It then follows that upon comparison of two samples (e.g. Gas1+/–; Boc+/– versus Gas1–/–; Boc- /-) if the cell density is constant, any differences in the PIPUA denotes a true change in proliferation as a result of mutation in Gas1 and Boc or genetic interaction. Analysis of the PIPUA revealed a statistical significant difference among the four genotypes (p < 0.001). Table 3 illustrates descriptive analysis for the PIPUA, containing the number of PS analysed for each genotype, the median, range and interquartile range. Post hoc pairwise comparisons among groups revealed a statistical significant difference between PIPUA amongst all genotypes, except for Gas1–/–; Boc–/– versus Gas1–/–; Boc+/– (Figure 6D). Table 4 illustrates the Poisson regression analysis performed to evaluate PIPUA differences among the genotypes. The PIPUA of Boc–/– PS showed the highest value (2612.54, p < 0.001), whilst Gas1–/–; Boc+/– and Gas1–/–; Boc–/– PS also demonstrated a higher PIPUA compared to control, but to a lesser extent (Table 4, Figure 6D).
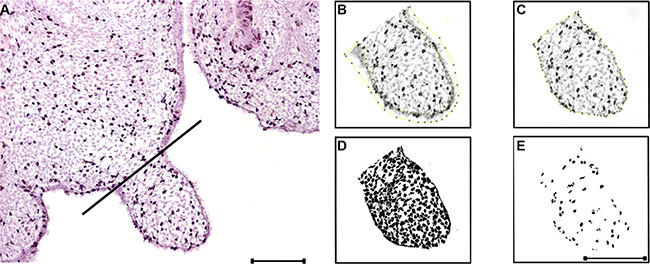
Figure 5: BrdU labeling and image analysis methodology. (A) BrdU labeling. A perpendicular line from the palatal shelf ‘’hinge’’ to the opposite palatal surface delimitates the analysed area. (B) The epithelium is deleted. (C) The region of interest is delimitated, and subsequently measured. (D) Thresholding for the total cells within the region of interest; the watershed plugin is applied for segmentation and the total cell counting is obtained. (E) Thresholding for the BrdU positive cells within the region of interest; the watershed plugin is applied for segmentation and the positive cell counting is obtained. Scale bar in A = 200 μm for (A). Scale bar in E = 200 μm for (B–E).
Table 1: CPI descriptive analysis
Genotypes |
N |
Median |
Q1-Q3 |
IQR |
Range |
|---|---|---|---|---|---|
Boc–/– |
55 |
2.12 |
1.86–2.73 |
0.87 |
1.38–4.29 |
Gas1+/–;Boc+/– |
127 |
2.47 |
2.15–2.87 |
0.72 |
1.55–3.81 |
Gas1–/–; Boc+/– |
44 |
3.16 |
2.92–3.39 |
0.47 |
1.47–4.44 |
Gas1–/–; Boc–/– |
65 |
2.47 |
2.24–2.73 |
0.49 |
1.72–8.11 |
Overall |
291 |
2.51 |
2.15–2.96 |
0.81 |
1.38–8.11 |
N, number of PS; IQR, interquartile range.
Table 2: CPI poisson regression analysis
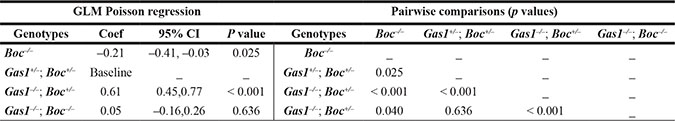
Coef, Poisson regression coefficients for the model; CI, confidence interval; GLM, generalized linear models.
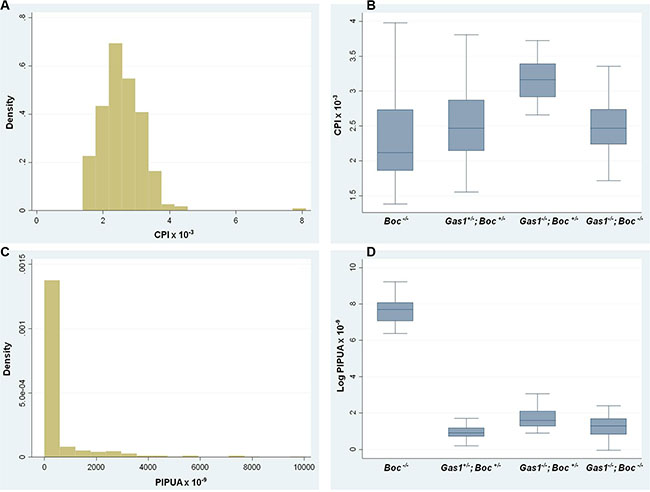
Figure 6: Cell packing and proliferation in the developing palate of Gas1+/−; Boc+/−, Gas1−/−, Boc+/−, Boc−/− and Gas1−/−; Boc−/− mice at E14.5. (A) Histogram for the CPI values indicates that the data is not normally distributed. (B) CPI box plots for the genotypes analysed. (C) Histogram for the PIPUA values indicates that the data is not normally distributed. (D) PIPUA box plots for the genotypes analysed. CPI, cell packing index; PIPUA, proliferation index per unit area
Table 3: PIPUA descriptive analysis
Genotypes |
N |
Median |
Q1-Q3 |
IQR |
Range |
|---|---|---|---|---|---|
Boc–/– |
55 |
2175.3 |
1170.19–3184.81 |
2014.62 |
585.13–10055.89 |
Gas1+/–; Boc+/– |
127 |
2.51 |
2.09–3.24 |
1.15 |
1.23–8.17 |
Gas1–/–; Boc+/– |
44 |
4.90 |
3.63–8.15 |
4.52 |
2.45–21.18 |
Gas1–/–; Boc–/– |
65 |
3.63 |
2.30–5.38 |
3.09 |
0.96–40.18 |
Overall |
291 |
3.52 |
2.39–8.17 |
5.78 |
0.96–10055.99 |
N, number of PS; IQR, interquartile range.
Table 4: PIPUA poisson regression analysis
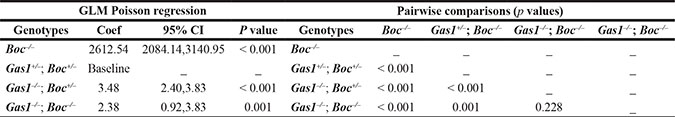
Coef, Poisson regression coefficients for the model; CI, confidence interval; GLM, generalized linear models.
Palatal shelf cell survival in the absence of Gas1 and Boc function
Regression of the MES is an important step during palatogenesis and contributes to formation of a confluent secondary palate [5]. Programmed cell death (apoptosis) is one of the proposed mechanisms involved in mediating MES degeneration [58, 67]. In the present study, we assayed the presence of apoptotic cells using TUNEL assays. Interestingly, we found similar levels of apoptosis in the anterior, medial and posterior sections of Boc–/– PS when compared to corresponding sections of Gas+/–; Boc+/– PS (Figure 7G’-I’; A’-C’, respectively). Conversely, the levels of cell death within Gas–/–; Boc+/– (Figure 7D’–7F’) and Gas–/–; Boc–/– PS was reduced in relation to Gas+/–; Boc+/–.
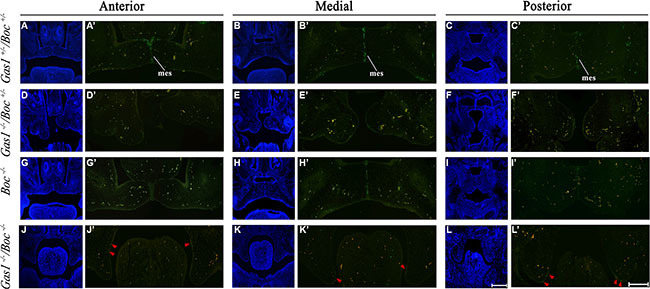
Figure 7: Cell survival in the developing palate of Gas1+/−; Boc+/−, Gas1−/−; Boc+/−, Boc−/− and Gas1−/−; Boc−/− mice at E14.5. Frontal sections through the anterior, medial and posterior regions of the developing palate. Gas1+/−; Boc+/− (A–C, A’-C’), Gas1−/−;Boc+/− (D–F, D’-F’), Boc−/− (G–I, G’-I’) and Gas1−/−; Boc−/− (J–L, J’-L’). 4′, 6-diamidino-2-phenylindole (DAPI) staining (A–L) to visualize cell nuclei and tissue architecture. Merged images (A’-L’) used to distinguish between TUNEL-positive cells (green fluorescence) and background staining (orange). Red arrowheads in (J’-L’) highlight the TUNEL-positive cells. Scale bar in L = 200 μm for (A–L). mes, medial epithelial seam. Scale bar in L' = 100 μm for (A'-L').
DISCUSSION
Understanding the role of Shh during palatogenesis is important because of the key regulatory role this signaling protein plays during development of this structure [68]. Gas1 and Boc are now established as essential Shh co-receptors during development and are required for regulating Shh-mediated cell proliferation in other regions of the embryo [31, 32]. Shh pathway components demonstrate distinct regional expression in the PS during development [28, 49, 50] and here we have shown non-overlapping domains between Ptch1, Gas1 and Boc in the epithelium and mesenchyme during palatogenesis. Recent evidence suggests that the co-receptor function exerted by Gas1 and Boc in combination with Ptch1 is unlikely to involve all three molecules in the same complex [31]. The observed Boc expression pattern shows evidence for redundancy with Gas1 in the palate, as previously demonstrated in other regions of the developing embryo, such as the neural tube and heart [32].
Ablation of Boc activity in a Gas1 mutant background leads to a unique form of HPE [61]. Although Boc–/– mice were viable and fertile with no overt embryonic phenotype (Figure 3G–3I), Gas1–/–; Boc–/– embryos show defects not previously observed in mice lacking Gas1 activity [28, 61]. Of relevance to palatal development, Gas1; Boc compound mutants exhibited a fully penetrant CP, associated with failed elevation of the PS. Other phenotypes included clefting of the posterior tongue and abnormal positioning of the vomeronasal organ. These characteristics correlate with a reduction of Shh signaling, which seems more drastically affected in Gas1; Boc compound mutants (Figure 4). Similarly, in the context of limb development, a more severe defect in digit patterning and specification is observed in Gas1; Boc compound mutants [32]. In addition, Gas1 and Boc in conjunction with Cdon have recently been shown to modulate the levels of Hh-responsiveness in the pathogenesis of pancreatic cancer. When all three co-receptors are ablated intra-tumoral proliferation is reduced, highlighting the importance of combined mutagenesis screens when describing pathway function [62].
Whole population cell analysis of the PS epithelium has highlighted the importance of considering factors other than cell proliferation in isolation when evaluating tissue growth [65]. Here we focused on the mesenchyme, as elevation and growth of the PS is likely to be driven by changes in the mesenchymal stroma [8]. In order to determine the effects of targeted mutations in Gas1 and Boc on the developing PS, BrdU and TUNEL assays were performed. A CPI and a PIPUA were implemented in order to generate an unbiased proliferation map of the entire PS mesenchyme (rather than randomly selecting isolated areas of tissue) taking into account the interdependent relationship of the two quantities [28, 56, 65, 69]. However, Boc–/– PS presented a decreased cell density (CPI) and increased proliferation (PIPUA) in comparison to control (Gas+/–; Boc+/– mice). These seemingly conflicting results can be explained by two possible mechanisms: (1) either an increased compensatory apoptosis, resulting in a net reduction in cell number or (2) an increase in the average distance between cells as a result of an increase in overall tissue size. The former hypothesis can be excluded following the apoptosis analysis, which demonstrated cell death present primarily in the epithelium at levels similar to those observed in Gas+/–; Boc+/– PS (Figure 7). Similar results in terms of cell death have also been observed in a different context (cerebellar granule neuron progenitors), where Boc ablation does not affect apoptosis [31]. As no overt differences were observed in overall tissue size, the alternative hypothesis would require further analysis (whereby cell distances are measured directly) in order to determine the precise causation of a cell proliferation increase with concomitant cell packing decrease. In Gas- /-; Boc+/– PS there was increased PIPUA accompanied by an increased CPI. This suggests a more straightforward relationship between Gas1 and proliferation, whereby Gas1 acts as a negative regulator of cell proliferation in the PS mesenchyme. This is in agreement with other studies demonstrating that Gas1 is capable of initiating apoptosis and inhibiting proliferation [70, 71]. Interestingly, Gas1 exerts similar functions in oncogenesis [63, 72]. Gas1 activity detains tumour growth by inhibiting the proliferation of breast cancer cells [63] and has been reported to play the same mechanistic role in a variety of other cancers; such as colorectal carcinoma [72], papillary thyroid carcinoma [64] and glioma [70]. In Gas–/–; Boc–/– PS the CPI was restored to levels observed in Gas+/–; Boc+/– suggesting that the two genes have opposing roles in regulating cell density. However, their relationship with respect to proliferation regulation appears to be more complex and non-synergistic, as demonstrated by the (significantly higher) PIPUA observed in the Gas- /-; Boc–/– PS. Although both genes seem to be negative regulators of proliferation in this developmental context, it is highly suggestive that additional regulators play a role in this network. Moreover, higher CPI and PIPUA are not necessarily an indication of aberrant palatogenesis, as observed in Boc–/– embryos. Therefore, it is reasonable to speculate that the HPE midline facial anomalies present in Gas1–/–; Boc–/– [61] could play an important role in the CP phenotype observed in these mice.
We have excluded tissue packing changes as a potential cellular mechanism underlying the Gas1; Boc mutant PS phenotype. Histological analysis demonstrated that the Gas1–/–; Boc–/– PS size are similar to that of Gas+/–; Boc+/–. Therefore, in order to further understand how the observed differences in proliferation contribute to the CP phenotype, a direct measure of the overall midfacial region of Gas1–/–; Boc–/– mice would be required. This may prove challenging to perform in plane section, because no account would be taken of cellular movements and rearrangements that might be taking place in the z- dimension [65, 69]. Alternative approaches might include three-dimensional and potentially live imaging, and cell tracking to encompass cellular rearrangements; these techniques would underpin our future studies. Recent reports of extensive cellular rearrangements in oral epithelia render this scenario plausible [73]. Similar experimental approaches could be adopted to further elucidate the links between genetic lesions and the cellular mechanistic defects underlying the CP phenotype. We have previously demonstrated that increased transduction of Shh signaling in the PS mesenchyme leads to reduced proliferation [56]. The results of the present study illustrate an opposite effect (increased PIPUA in Gas1–/–; Boc–/– mice) that correlates with reduced transcriptional activity of Shh signaling readouts. Furthermore, deletion of Gas1 leads to reduced apoptosis in the PS. Although the CP phenotype in mice lacking Gas1 [28] or in compound Gas1; Boc mutants is associated with PS that fail to elevate above the tongue; it is unlikely that the PS would fuse, as demonstrated by transgenic mice over-expressing Shh in the oral epithelium [56].
The results from this study further highlight the importance of Shh signaling in coordinating the process of palatogenesis. Hh family members are expressed at key stages during palate development [49, 56, 61]. Moreover, ablation of Boc in a Gas1 mutant background leads to reduced transduction of Shh signaling. Morphometric analysis revealed that the more severe clefting phenotype observed in these mice was associated with higher proliferation levels and reduced apoptosis. Additional mRNA expression analysis of known mediators of palatal development may help to further define a gene network in developing palate. While systems approaches are important to elucidate the vast molecular network regulating complex developmental processes such as palatogenesis, understanding the role of individual genes implicated in cell regulation is also highly valuable. This study has directly addressed the role of two key Hh signaling components and their dual requirement for orchestrating palatogenesis. Similar studies addressing the roles of other key Hh components should eventually lead to a more complete picture of the genetic basis of midline development and how it relates to human syndromic disorders.
MATERIALS AND METHODS
Generation of Gas1; Boc compound mutant mice
All mice were housed and all experiments conducted in compliance with the approved protocols at King’s College London, UK and the Carnegie Institution of Washington, USA. Gas1–/– mice were generated and maintained in a 129sv/C57BL6 mixed background and genotyped as previously described [27]. Boc–/– mice were generated and maintained in a CD1/129sv mixed background and genotyped as previously described [46]. Gas1+/– mice were crossed with Boc+/– mice, to generate Gas1–/–; Boc–/– compound mutants in a mixed background (129sv/C57BL/6/CD1). Timed-matings were set up such that noon of the day on which vaginal plugs were detected was considered as embryonic day (E) 0.5.
Histological analysis
For histological analysis, embryos were fixed in 4% paraformaldehyde (PFA) at 4°C, dehydrated through a graded ethanol series, embedded in paraffin wax, sectioned at 7 mm and stained with haematoxylin and eosin (H&E).
In Situ hybridization
Radioactive section in situ hybridization was carried out as previously described [74]. Dark-field images of sections were photographed using a Zeiss Axioscop microscope and montages constructed using Adobe Photoshop CS.
Cell packing and proliferation index per unit area assays
A CPI was generated by dividing the total number of cells by the area of the region of interest. Assays for cell proliferation were carried out using a Zymed Bromodeoxyuridine (BrdU) Labeling and Detection Kit (Invitrogen), according to the manufacturer instructions. Mouse embryos were labeled with BrdU via intra-peritoneal injection into pregnant females (5 mg/100 g body weight) 2 hours prior to sacrifice. Slides were photographed using a Zeiss Axioscop microscope (Germany).
The imaging software package FIJI [66] was used to count BrdU-positive and total cells. Cells were counted in the mesenchyme of the anterior, medial and posterior palate. The lateral extent of the palate shelf was determined by drawing a perpendicular line from the ‘‘hinge’’ region to the opposite palatal surface [75]. Morphological segmentation of cells was performed using manual thresholding, followed by watersheding, to improve segmentation of closely neighboring cells [76]. Segmentation was performed twice, once for total and once for BrdU-positive cells. The palatal shelf area was measured by selecting the region of interest with the polygon selection tool. A proliferation index was first generated by dividing the number of positive cells by the total number of cells. The proliferation index per unit area (PIPUA) was generated by dividing the proliferation index by the region of interest. Due to the small numeric scale of the data and to make it more easily presentable, CPI was multiplied by 10-3 and PIPUA was multiplied by 10-9. The graph illustrating the PIPUA is in a logarithmic scale to facilitate visualization of the data.
Apoptosis
Immunohistochemical detection of apoptotic cell death was carried out on histological sections using Terminal deoxynucleotidyl transferase-mediated deoxyUridine triPhosphate Nick End Labeling (TUNEL). TUNEL was carried out using an APOPTag® Plus Fluorescein In Situ Apoptosis Detection Kit (Chemicon International) according to the manufacturer’s instructions. Slides were photographed using a Zeiss Axioscop microscope (Germany).
Statistical analysis
The assumption of normality for each variable was checked with with the Shapiro-Wilk test [77]. The assumption of homoscedascity was carried out with an information matrix test, according to Cameron and Trivedi [78]. As both the CPI and the PIPUA were not normally distributed (p < 0.001 from the Shapiro-Wilk test for both), the median and interquartile range (IQR) are reported as descriptive statistics. The Kruskal-Wallis test was used to test for differences in CPI and PIPUA among the four groups. Differences among the four groups were identified by calculating coefficients and the corresponding 95% confidence intervals (95% CI) through generalized linear regression models, only if the null hypothesis was rejected with the Kruskal-Wallis test, so as to reduce the risk of increased Type II error. According to inspection of the histograms and to model fit, a Poisson distribution was adopted for the models with calculation of robust standard errors to control for mild violation of underlying assumptions [79]. As post hoc pairwise comparisons among groups were performed only in case of a statistically significant Kruskal-Wallis test and these were of explorative nature, no P-value correction was applied. All statistical analyses were conducted with a 2-sided α of 5% in Stata version 12 (StataCorp LP, College Station, TX) with the macros swilk, kwallis, and glm.
ACKNOWLEDGMENTS AND FUNDING
Guilherme M. Xavier is supported by the Academy of Medical Sciences (Welcome Trust, British Heart Foundation, Arthritis UK).
CONFLICTS OF INTEREST
None.
REFERENCES
1. Shkoukani MA, Lawrence LA, Liebertz DJ, Svider PF. Cleft palate: a clinical review. Birth Defects Res C Embryo Today. 2014; 102:333–42.
2. Bush JO, Jiang R. Palatogenesis: morphogenetic and molecular mechanisms of secondary palate development. Development. 2012; 139:231–43.
3. Gritli-Linde A, Molecular control of secondary palate development. Dev Biol. 2007; 301:309–26.
4. Levi B, Brugman S, Wong VW, Grova M, Longaker MT, Wan DC. Palatogenesis: engineering, pathways and pathologies. Organogenesis. 2011; 7:242–54.
5. Ferguson MW, Palate development. Development, 1988. 103:41–60.
6. Hinrichsen K, The early development of morphology and patterns of the face in the human embryo. Adv Anat Embryol Cell Biol. 1985; 98:1–79.
7. Barteczko K, Jacob M. A re-evaluation of the premaxillary bone in humans. Anat Embryol (Berl), 2004. 207:p. 417–37.
8. Dudas M, Li WY, Kim J, Yang A, Kaartinen V. Palatal fusion - where do the midline cells go? A review on cleft palate, a major human birth defect. Acta Histochem. 2007; 109:1–14.
9. Mossey PA, Little J, Munger RG, Dixon MJ, Shaw WC. Cleft lip and palate. The Lancet. 2009; 374:1773–1785.
10. Lee RT, Zhao Z, Ingham PW. Hedgehog signalling. Development. 2016; 143:367–72.
11. Hanna A, Shevde LA. Hedgehog signaling: modulation of cancer properies and tumor mircroenvironment. Mol Cancer, 2016. 15:24.
12. Briscoe J, Therond PP. The mechanisms of Hedgehog signalling and its roles in development and disease. Nat Rev Mol Cell Biol. 2013; 14:416–29.
13. Ingham PW, McMahon AP. Hedgehog signaling in animal development: paradigms and principles. Genes Dev. 2001; 15:3059–87.
14. Ribeiro LA, Quiezi RG, Nascimento A, Bertolacini CP, and Richieri-Costa A, Holoprosencephaly and holoprosencephaly-like phenotype and GAS1 DNA sequence changes: Report of four Brazilian patients. Am J Med Genet A. 2010; 152A:1688–94.
15. Hall JG, Pallister-Hall syndrome has gone the way of modern medical genetics. Am J Med Genet C Semin Med Genet. 2014; 166C:414–8.
16. Pino LC, Balassiano LK, Sessim M, de Almeida AP, Empinotti VD, Semenovitch I, Treu C, Lupi O. Basal cell nevus syndrome: clinical and molecular review and case report. Int J Dermatol. 2016; 55:367–75.
17. Diniz MG, Galvao CF, Macedo PS, Gomes CC, Gomez RS. Evidence of loss of heterozygosity of the PTCH gene in orthokeratinized odontogenic cyst. J Oral Pathol Med. 2011; 40:277–80.
18. Gomes CC, Diniz MG, Gomez RS. Review of the molecular pathogenesis of the odontogenic keratocyst. Oral Oncol. 2009; 45:1011–4.
19. Goodrich LV, Jung D, Higgins KM, Scott MP. Overexpression of ptc1 inhibits induction of Shh target genes and prevents normal patterning in the neural tube. Dev Biol. 1999; 211:323–34.
20. Goodrich LV, Johnson RL, L. Milenkovic JA, McMahon, and Scott MP, Conservation of the hedgehog/patched signaling pathway from flies to mice: induction of a mouse patched gene by Hedgehog. Genes Dev. 1996; 10:301–12.
21. Xavier GM, Seppala M, Barrell W, Birjandi AA, Geoghegan F, Cobourne MT. Hedgehog receptor function during craniofacial development. Dev Biol. 2016.
22. Cobourne MT, Sharpe PT. Sonic hedgehog signaling and the developing tooth. Curr Top Dev Biol. 2005; 65:255–87.
23. Caspary T, Garcia-Garcia MJ, Huangfu D, Eggenschwiler JT, Wyler MR, Rakeman AS, Alcorn HL, Anderson KV. Mouse Dispatched homolog1 is required for long-range, but not juxtacrine, Hh signaling. Curr Biol. 2002; 12:1628–32.
24. Huangfu D, Anderson KV. Cilia and Hedgehog responsiveness in the mouse. Proc Natl Acad Sci USA. 2005; 102:11325–30.
25. Nozawa YI, Lin C, Chuang PT. Hedgehog signaling from the primary cilium to the nucleus: an emerging picture of ciliary localization, trafficking and transduction. Curr Opin Genet Dev. 2013; 23:429–37.
26. Ruat M, Roudaut H, Ferent J, Traiffort E. Hedgehog trafficking, cilia and brain functions. Differentiation, 2012. 83:p. S97–104.
27. Martinelli DC, Fan CM. Gas1 extends the range of Hedgehog action by facilitating its signaling. Genes Dev. 2007; 21:1231–43.
28. Seppala M, Depew MJ, Martinelli DC, Fan CM, Sharpe PT, Cobourne MT. Gas1 is a modifier for holoprosencephaly and genetically interacts with sonic hedgehog. J Clin Invest. 2007; 117:1575–84.
29. Zhang W, Kang JS, Cole F, Yi MJ, Krauss RS. Cdo functions at multiple points in the Sonic Hedgehog pathway, and Cdo-deficient mice accurately model human holoprosencephaly. Dev Cell. 2006; 10:657–65.
30. Tenzen T, Allen BL, Cole F, Kang JS, Krauss RS, McMahon AP. The cell surface membrane proteins Cdo and Boc are components and targets of the Hedgehog signaling pathway and feedback network in mice. Dev Cell. 2006; 10:647–56.
31. Izzi L, Levesque M, Morin S, Laniel D, Wilkes BC, Mille F, Krauss RS, McMahon AP, Allen BL, Charron F. Boc and Gas1 each form distinct Shh receptor complexes with Ptch1 and are required for Shh-mediated cell proliferation. Dev Cell. 2011; 20:788–801.
32. Allen BL, Song JY, Izzi L, Althaus IW, Kang JS, Charron F, Krauss RS, McMahon AP. Overlapping roles and collective requirement for the coreceptors GAS1, CDO, and BOC in SHH pathway function. Dev Cell. 2011; 20:775–87.
33. Roessler E, et al., The mutational spectrum of holoprosencephaly-associated changes within the SHH gene in humans predicts loss-of-function through either key structural alterations of the ligand or its altered synthesis. Hum Mutat. 2009; 30:E921–35.
34. Tukachinsky H, Petrov K, Watanabe M, Salic A. Mechanism of inhibition of the tumor suppressor Patched by Sonic Hedgehog. Proc Natl Acad Sci U S A. 2016.
35. Gomez-Ospina N, Chang AL, Qu K, Oro AE. Translocation affecting sonic hedgehog genes in basal-cell carcinoma. N Engl J Med. 2012; 366:2233–4.
36. Schneider C, King RM, Philipson L. Genes specifically expressed at growth arrest of mammalian cells. Cell. 1988; 54:787–93.
37. Schueler-Furman O, Glick E, Segovia J, Linial M. Is GAS1 a co-receptor for the GDNF family of ligands? Trends Pharmacol Sci. 2006; 27:72–7.
38. Del Sal G, Collavin L, Ruaro ME, Edomi P, Saccone S, Valle GD, Schneider C. Structure, function, and chromosome mapping of the growth-suppressing human homologue of the murine gas1 gene. Proc Natl Acad Sci USA. 1994; 91:1848–52.
39. Lee CS, Buttitta L, Fan CM. Evidence that the WNT-inducible growth arrest-specific gene 1 encodes an antagonist of sonic hedgehog signaling in the somite. Proc Natl Acad Sci U S A. 2001; 98:11347–52.
40. Allen BL, Tenzen T, and McMahon AP, The Hedgehog-binding proteins Gas1 and Cdo cooperate to positively regulate Shh signaling during mouse development. Genes Dev. 2007; 21:1244–57.
41. Jin S, Martinelli DC, Zheng X, Tessier-Lavigne M, Fan CM, Gas1 is a receptor for sonic hedgehog to repel enteric axons. Proc Natl Acad Sci U S A. 2015; 112:E73–80.
42. Lee CS, May NR, Fan CM. Transdifferentiation of the ventral retinal pigmented epithelium to neural retina in the growth arrest specific gene 1 mutant. Dev Biol. 2001; 236:17–29.
43. Kang JS, Mulieri PJ, Hu Y, Taliana L, Krauss RS. BOC, an Ig superfamily member, associates with CDO to positively regulate myogenic differentiation. EMBO J. 2002; 21:114–24.
44. Mulieri PJ, Kang JS, Sassoon DA, Krauss RS. Expression of the boc gene during murine embryogenesis. Dev Dyn. 2002; 223:379–88.
45. Sanchez-Arrones L, Cardozo M, Nieto-Lopez F, and Bovolenta P, Cdon and Boc:Two transmembrane proteins implicated in cell-cell communication. Int J Biochem Cell Biol. 2012; 44:698–702.
46. Okada A, Charron F, Morin S, Shin DS, Wong K, Fabre PJ, Tessier-Lavigne M, and McConnell SK, Boc is a receptor for sonic hedgehog in the guidance of commissural axons. Nature. 2006; 444:369–73.
47. Bae GU, Domene S, Roessler E, Schachter K, Kang JS, Muenke M, Krauss RS. Mutations in CDON, encoding a hedgehog receptor, result in holoprosencephaly and defective interactions with other hedgehog receptors. Am J Hum Genet. 2011; 89:231–40.
48. Bitgood MJ, McMahon AP. Hedgehog and Bmp genes are coexpressed at many diverse sites of cell-cell interaction in the mouse embryo. Dev Biol. 1995; 172:126–38.
49. Rice R, Connor E, Rice DP. Expression patterns of Hedgehog signalling pathway members during mouse palate development. Gene Expr Patterns. 2006; 6:206–12.
50. Rice R, Spencer-Dene B, Connor EC, Gritli-Linde A, McMahon AP, Dickson C, Thesleff I, Rice DP. Disruption of Fgf10/Fgfr2b-coordinated epithelial-mesenchymal interactions causes cleft palate. J Clin Invest. 2004; 113:1692–700.
51. Zhang Z, X. Song Y Fau - Zhao, X. Zhao X Fau - Zhang C. Zhang X Fau - Fermin, Y. Fermin C Fau - Chen, and Chen Y, Rescue of cleft palate in Msx1-deficient mice by transgenic Bmp4 reveals a network of BMP and Shh signaling in the regulation of mammalian palatogenesis. Development, 2002. 129(0950–1991 (Print)):4135–4146.
52. Lan Y, Jiang R. Sonic hedgehog signaling regulates reciprocal epithelial-mesenchymal interactions controlling palatal outgrowth. Development. 2009; 136:1387–96.
53. Xu J, Liu H, Lan Y, Aronow BJ, Kalinichenko VV, Jiang R. A Shh-Foxf-Fgf18-Shh Molecular Circuit Regulating Palate Development. PLoS Genet. 2016; 12:e1005769.
54. Lane J, Kaartinen V. Signaling networks in palate development. Wiley Interdiscip Rev Syst Biol Med. 2014; 6:271–8.
55. Zhou J, Gao Y, Lan Y, Jia S, Jiang R. Pax9 regulates a molecular network involving Bmp4, Fgf10, Shh signaling and the Osr2 transcription factor to control palate morphogenesis. Development. 2013; 140:4709–18.
56. Cobourne MT, Xavier GM, Depew M, Hagan L, Sealby J, Webster Z, Sharpe PT. Sonic hedgehog signalling inhibits palatogenesis and arrests tooth development in a mouse model of the nevoid basal cell carcinoma syndrome. Dev Biol. 2009; 331:38–49.
57. Hamosh A, Scott AF, Amberger J, Bocchini C, Valle D, and McKusick VA, Online Mendelian Inheritance in Man (OMIM), a knowledgebase of human genes and genetic disorders. Nucleic Acids Res. 2002; 30:52–5.
58. Greene RM, Pisano MM. Palate morphogenesis: current understanding and future directions. Birth Defects Res C Embryo Today. 2010; 90:133–54.
59. Martinelli DC, Fan CM. The role of Gas1 in embryonic development and its implications for human disease. Cell Cycle. 2007; 6:2650–5.
60. Zhang W, Hong M, Bae GU, Kang JS, Krauss RS. Boc modifies the holoprosencephaly spectrum of Cdo mutant mice. Dis Model Mech. 2011; 4:368–80.
61. Seppala M, Xavier GM, Fan CM, Cobourne MT. Boc modifies the spectrum of holoprosencephaly in the absence of Gas1 function. Biol Open. 2014; 3:728–740.
62. Mathew E, Zhang Y, Holtz AM, Kane KT, Song JY, Allen BL, and M. Pasca di Magliano, Dosage-dependent regulation of pancreatic cancer growth and angiogenesis by hedgehog signaling. Cell Rep. 2014; 9:484–94.
63. Jimenez A, Lopez-Ornelas A, Estudillo E, Gonzalez-Mariscal L, Gonzalez RO, Segovia J. A soluble form of GAS1 inhibits tumor growth and angiogenesis in a triple negative breast cancer model. Exp Cell Res. 2014; 327:307–17.
64. Ma Y, Qin H, Cui Y. MiR-34a targets GAS1 to promote cell proliferation and inhibit apoptosis in papillary thyroid carcinoma via PI3K/Akt/Bad pathway. Biochem Biophys Res Commun. 2013; 441:958–63.
65. Economou AD, Brock LJ, Cobourne MT, Green JB. Whole population cell analysis of a landmark-rich mammalian epithelium reveals multiple elongation mechanisms. Development. 2013; 140:4740–50.
66. Schindelin J, et al., Fiji: an open-source platform for biological-image analysis. Nat Methods. 2012; 9:676–82.
67. Cuervo R, Covarrubias L. Death is the major fate of medial edge epithelial cells and the cause of basal lamina degradation during palatogenesis. Development. 2004; 131:15–24.
68. Cobourne MT, Green JB. Hedgehog signalling in development of the secondary palate. Front Oral Biol. 2012; 16:52–9.
69. Brock LJ, Economou AD, Cobourne MT, Green JB. Mapping cellular processes in the mesenchyme during palatal development in the absence of Tbx1 reveals complex proliferation changes and perturbed cell packing and polarity. J Anat. 2016; 228:464–73.
70. Dominguez-Monzon G, Benitez JA, Vergara P, Lorenzana R, Segovia J. Gas1 inhibits cell proliferation and induces apoptosis of human primary gliomas in the absence of Shh. Int J Dev Neurosci. 2009; 27:305–13.
71. Zarco N, Gonzalez-Ramirez R, Gonzalez RO, Segovia J. GAS1 induces cell death through an intrinsic apoptotic pathway. Apoptosis. 2012; 17:627–35.
72. Li Q, Qin Y, Wei P, Lian P, Li Y, Xu Y, Li X, Li D, Cai S. Gas1 Inhibits Metastatic and Metabolic Phenotypes in Colorectal Carcinoma. Mol Cancer Res. 2016; 14:830–40.
73. Panousopoulou E, Green JB. Invagination of Ectodermal Placodes Is Driven by Cell Intercalation-Mediated Contraction of the Suprabasal Tissue Canopy. PLoS Biol. 2016; 14:e1002405.
74. Xavier GM, Miletich I, Cobourne MT. ephrin ligands and Eph receptors show regionally restricted expression in the developing palate and tongue. Frontiers in Physiology, 2016. 7.
75. Goudy S, Law A, Sanchez G, Baldwin HS, Brown C. Tbx1 is necessary for palatal elongation and elevation. Mech Dev. 2010; 127:292–300.
76. Vincent L, Soille P. Watersheds in Digital Spaces: An Efficient Algorithm Based on Immersion Simulations. IEEE Trans. Pattern Anal. Mach. Intell. 1991; 13:583–598.
77. Shapiro SS, Wilk MB. An analysis of variance test for normality (complete samples). Biometrika. 1965; 52:591–611.
78. Cameron A, Trivedi P. The Information Matrix Test and Its Implied Alternative Hypotheses. Working Papers - University of California Davis - Institute of Governmental Affairs. 1990.
79. Cameron AC, Trivedi PK. Microeconometrics Using Stata, Revised Edition. 2nd ed. 2010, College Station, Texas: Stata Press.