
INTRODUCTION
Primary mediastinal large B-cell lymphoma (PMBL), which represents 2% to 4% of all non-Hodgkin lymphoma, has been recognized as a separate entity with clinicopathological and molecular characteristics. It shares pathological features with diffuse large B-cell lymphoma (DLBCL), and molecular features and better prognosis with the nodular sclerosis subtype of classical Hodgkin lymphoma (cHL) [1]. Unlike DLBCL, which commonly occurs in older patients of both sexes, PMBL occurs predominantly in younger women, forming bulky masses with frequent invasion of adjacent structures [2]. Despite advances in treatment [3, 4], 20% of patients still succumb to their disease [5].
Gene expression profiling has enabled the identification of distinct types of DLBCL with significantly different overall survival [6]. It has also been established that the molecular signature of PMBL differs from that of other DLBCLs [7] and shares molecular features with cHL [1, 8]. Like cHL, PMBL has a distinctive cytokine signature and an activation of JAK-STAT, and NF-ƙB [8]. FOXP1 (forkhead box P1), located at chromosome 3p13 [9], is an essential transcriptional regulator of B-cell development [10, 11]. FOX genes are deregulated in HL [12], and FOXP1 is up-regulated in DLBCLs bearing the chromosomal aberrations trisomy 3 [13], t (3;14) (p13;q32) [14, 15]. FOXP1 expression is also up-regulated in B-cell lymphoma via other mechanisms, such as B-cell activation [16] and miR-34a repression by c-Myc [17], in addition to genetic changes.
Micro RNAs (miRNAs) are a class of small, non-coding RNAs that post-transcriptionally control the translation and stability of mRNAs [18, 19]. This new class of molecules can easily be detected in fixed human tissue samples [20].
miR-17~92 is a polycistronic miRNA cluster, with two paralogs, the miR-106a-363, and miR-106b-25 clusters [21], able to act as oncogenes [22]. It is located at chromosome 13q31 [23]. This region is amplified in lung cancer, and also in Burkitt’s lymphoma, follicular lymphoma, mantle cell lymphoma, and DLBCL [22]. The miR-17~92 cluster has numerous biological roles [24]. In mice, its overexpression is linked to lymphoproliferative disease and autoimmunity [25] and to B-cell lymphoma [21]. In humans, an overexpression of the miR-17~92 cluster and its paralogs has been associated with high proliferation in mantle cell lymphoma [19, 26].
The ability of miRNAs to direct the posttranscriptional repression of protein-coding genes by pairing with their mRNA enables studies on target recognition. In two genetically distinct B-cell lymphoma cell lines, miR-17~92 transfection induced a down-regulation of different target genes: BIM in Raji cells, and p21 in SUDHL4 cells [27].
In AIDS-related Burkitt lymphoma and DLBCL human samples, the overexpression of miRNAs from the miR-17~92 paralog clusters inhibited p21 [28]. In mantle cell lymphoma samples, the protein phosphatase PHLPP2, an important negative regulator of the PI3K/AKT pathway, was a direct target of miR-17~92 miRNAs, in addition to PTEN and BIM [29].
Here we compared the expression of each member of the miR-17~92 cluster in PMBL human samples versus DLBCL and versus cHL, and we further studied the target genes linked to deregulated miRNA in PMBL.
RESULTS
miR-92a was overexpressed in PMBL compared to DLBCL, but not to cHL
We quantified the expression levels of each microRNA of miR-17~92 cluster and its paralogs in 40 PMBL, 20 DLBCL, and 20 cHL human samples (Figure 1).
When we compared PMBL and DLBCL results for the miR-17~92 cluster, we found that only miR-92a had a significantly higher level of expression in PMBL compared to DLBCL (PMBL median 4.64 (interquartile range (Q1-Q3), 2.47-10.75); DLBCL 1.92 (Q1-Q3, 1.08-2.87); P =< 0.001). In contrast, miR-18a, miR-19a, miR-19b and miR-20a expression levels were significantly lower in PMBL than in DLBCL. No significant difference was found for miR-17. In the 20 DBLCL studied, there was no significant difference for miR-92a expression in GCB versus ABC subtypes (Supplementary Figure 2). For the two paralogs, miR-106a-363 and miR106b-25 clusters, there was no significant difference between PMBL and DLBCL.
In PMBL and cHL, we found a similar expression profile for each microRNA of miR-17~92 cluster and its paralogs.
When DLBCL and cHL were compared, five miRNAs of the miR-17-92a cluster, but not miR-92a, and the miR-106a and miR-106b of the paralog clusters, were significantly overexpressed in DLBCL.
In the wild-type cell lines studied, we found that, as in human samples, miR-92a expression was significantly higher in Karpas than in SU-DHL-5 (Karpas 9.09 (Q1-Q3, 9-9.25); SU-DHL-5 3.3 (Q1-Q3, 3.16-3.31); P =< 0.002) and miR-18a significantly lower (Karpas 0.57 (Q1-Q3, 0.56-0.62); SU-DHL-5 1.17 (Q1-Q3, 0.98-1.37); P =< 0.02). The only discrepancy was observed for miR-20a expression which was higher in Karpas versus SU-DHL-5 (Karpas 17.14 (Q1-Q3, 1.9-22); SU-DHL-5 5.9 (Q1-Q3, 5.52-6.29) P =< 0.02), but it was significantly lower in PMBL versus DLBCL patients (Supplementary figure 3).
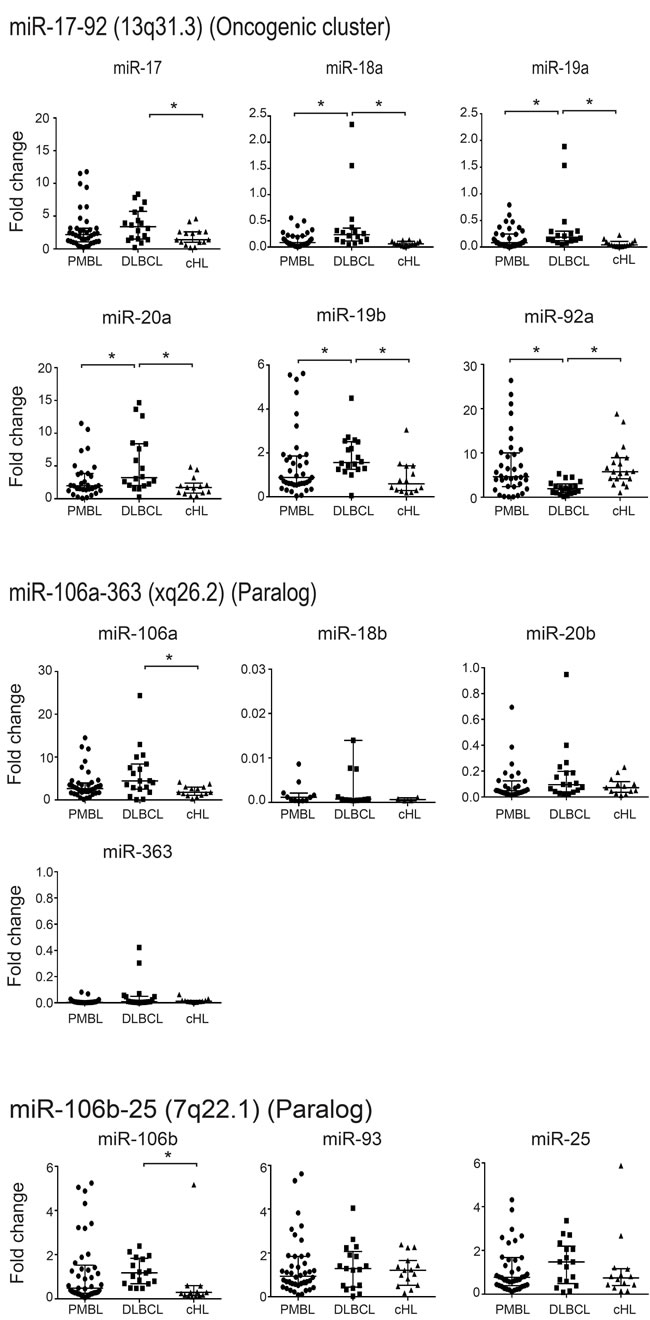
Figure 1: Quantification of expression levels of each microRNA in the miR-17~92 cluster and its paralogs in 40 PMBL, 20 DLBCL and 20 cHL patient samples. Results are expressed as median fold change +/- standard deviation. Statistical analyses were performed using the Mann-Whitney test. *P =< 0.001.
miR-92a target identification in PMBL
To identify miR-92a targets in PMBL, we combined in silico miR-92a target prediction and gene expression profile in PMBL and DLBCL patient samples, and in the four cell lines (Figure 2).
Analysis of the CoMeTa database, chosen to limit the number of false positive targets likely to result from a ranking method, provided a list of 1815 putative in silico target-genes of miR-92a. The quantile method enabled us to normalise the microarray datasets of PMBL and DLBCL patients and the four cell lines. The normalized datasets were filtered through the CoMeTa miR-92a putative target-gene list. We thus obtained a gene expression profile for 1135 filtered genes.
Comparison of the filtered gene lists from PMBL and DLBCL patients enabled us to identify 32 down-regulated and 17 up-regulated putative targets of miR-92a, with a FDR<0.05 and a fold change > 2 (q-value < 0.05). Comparison of cell line with high expression of miR-92a (Karpas hsa-miR-92a-1 and Karpas wt) and of cell line with low expression of miR-92a (Karpas miRZip-92a and SU-DHL-5 wt) enabled us to identify 16 down-regulated and 3 up-regulated putative targets of miR-92a, with a FDR<0.05 and a fold change > 2.
When patient samples and cell line results were analyzed, they had in common four down-regulated miR-92a associated mRNA, which were putative targets: CIC, FOXP1, INADL, and SMG1 (Supplementary figures 4 and 5). There was no up-regulated miR-92a associated mRNA.
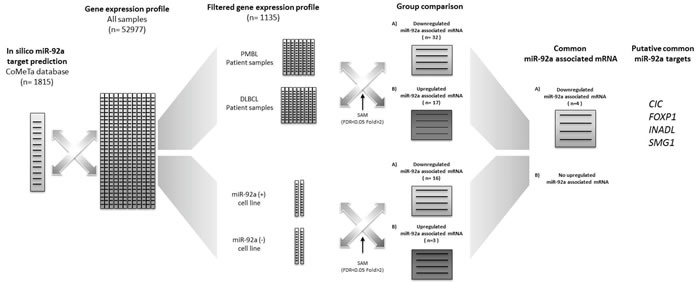
Figure 2: Bioinformatic approach for miR-92a target identification. Analysis of the CoMeTa database, chosen to limit the number of false positive targets by a ranking method, provided a list of 1815 putative in silico target-genes of miR-92a. The quantile method enabled us to normalise the microarray datasets for PMBL and DLBCL patients and the four cell lines. The normalized datasets were filtered through the CoMeTa miR-92a putative target-gene list. We thus obtained a gene expression profile of 1135 filtered genes. Comparison of the filtered gene lists from PMBL and DLBCL patients enabled us to identify 32 down-regulated and 1 up-regulated putative targets of miR-92a, with a FDR<0.05 and a fold change > 2 (q-value < 0.05). Comparison of cell line with high expression of miR-92a (Karpas hsa-miR-92a-1 and Karpas wt) and of cell line with low expression of miR-92a (Karpas miRZip-92a and SU-DHL-5 wt) enabled us to identify 16 down-regulated and 3 up-regulated putative targets of miR-92a, with a FDR<0.05 and a fold change > 2. When patient sample and cell line results were analyzed, they had in common four down-regulated putative targets of miR-92a: CIC, FOXP1, INADL, and SMG1.
FOXP1 as a target of miR-92a in PMBL
Transcriptomic analyses showed that the down-regulated transcripts of miR-92a associated genes CIC, FOXP1, INADL, and SMG1 were highly discriminant between PMBL and DLBCL patient samples (q-val < 0.001)(Figure 3A).
In the two transduced cell lines, a significant difference was only found for the mRNA expression level of FOXP1 (p < 0.05) (Figure 3B).
In the 8 PMBL and 9 DLBCL frozen samples, a significant difference was again only found for FOXP1 (p < 0.05). In addition, Kendall statistic test on Q-RT-PCR results gave a negative correlation between FOXP1 and miR-92a expression levels (tau=-0.59; p-val < 0.05)(Figure 3C).
Since FOXP1 is up-regulated in DLBCL bearing the chromosomal aberration trisomy 3, we quantified the FOXP1 DNA copy number in patient samples and cell lines. All patient samples and cell lines studied had 2 copies of FOXP1 gene. There was no amplification of FOXP1 (Figure 3D).
Overall these results were in favor of FOXP1 as a target of miR-92a.
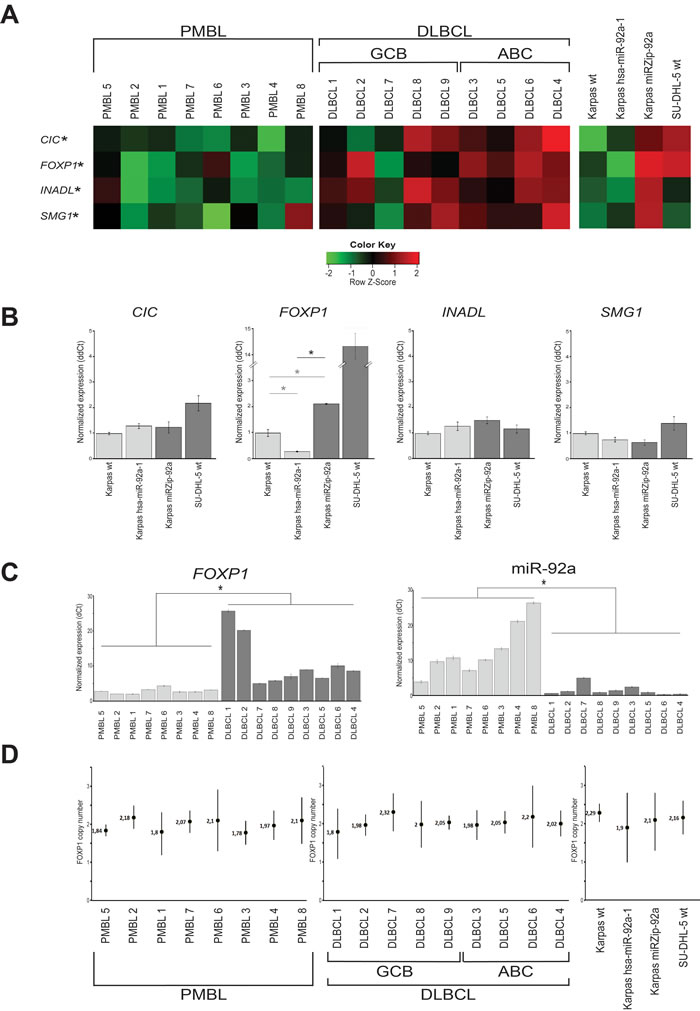
Figure 3: miR-92a target identification in PMBL. A. For the 8 PMBL and 9 DLBCL patients with available cryopreserved samples, the bioinformatics approach identified 4 genes, CIC, FOXP1, INADL and SMG1, as putative targets of miR-92a, down-regulated in PMBL and cell lines overexpressing miR-92a. *q =< 0.001. B. The expression level of each putative target of miR-92a was assessed using Q-RT-PCR in the three Karpas cell lines. The only gene whose expression is significantly different between transduced Karpas cells underexpressing and those overexpressing miR-92a is FOXP1 *p =< 0.001. Karpas wt FOXP1 mRNA expression level was also significantly lower than Karpas miRZIP-92a (0.47 fold, p<0.001) and significantly higher than Karpas hsa-miR-92a-1 (3.44 fold, p < 0.001). C. When the expression levels of FOXP1 and miR-92a were compared in PMBL and DLBCL samples, there were significantly lower levels of FOXP1 and higher levels of miR-92a in PMBL samples. *p =< 0.001. D. When FOXP1 DNA copy numbers were assessed on patient samples and cell lines using droplet digital PCR, all patient samples and cell lines studied had 2 copies of FOXP1 gene. There was no amplification of FOXP1.
FOXP1 protein expression, studied by western-blot and immunochemistry in patient samples and transduced cell lines, confirmed the result obtained on mRNA.
Western blot of FOXP1 on the four cell lines studied showed an overexpression of FOXP1 when miR-92a was down-regulated. A significantly higher expression, about 4.4 times greater of FOXP1 protein was found in Karpas miRZip-92a compared to Karpas hsa-miR-92a-1 (p < 0.05)(Figure 4A).
Counts of cells with nuclear FOXP1 expression in immunochemistry showed a significant difference between the two transduced cell lines (p < 0.05)(Figure 4B), and also between the two groups of PMBL and DLBCL patients (p < 0.05)(Figure 4C).
Overall, these results demonstrated a strong association between miR-92a expression level and FOXP1.
To demonstrate that FOXP1 was a direct target of miR-92a, we performed a luciferase reporter activity test using 293T-cells expressing a GLuc-3’UTRFOXP1 fusion mRNA, which were transfected with a miR-92a mimic. Two plasmidic constructions were necessary to cover the whole FOXP1 3’UTR. When luciferase activity of these cells was assessed 72h after the miR-92a transfection, a significant reduction in luminescence was measured with the Gluc-FOXP1-3’UTR-2 construction, while no significant difference was observed with the Gluc-FOXP1-3’UTR-1 construction (Figure 4D). We used the miRNA target prediction database TargetScan to identify a 7mer-A1 miR-92a-3p binding site on the FOXP1 3’UTR, which is conserved across vertebrates (Supplementary figure 6). This site was located at position 4502-4508 of FOXP1 3’UTR cloned on the Gluc-FOXP1-3’UTR-2 construct.
These results showed the presence of a functional miR-92a binding site on the 3’ extremity of the FOXP1 3’UTR, and thus demonstrated that FOXP1 was a target of miR-92a.
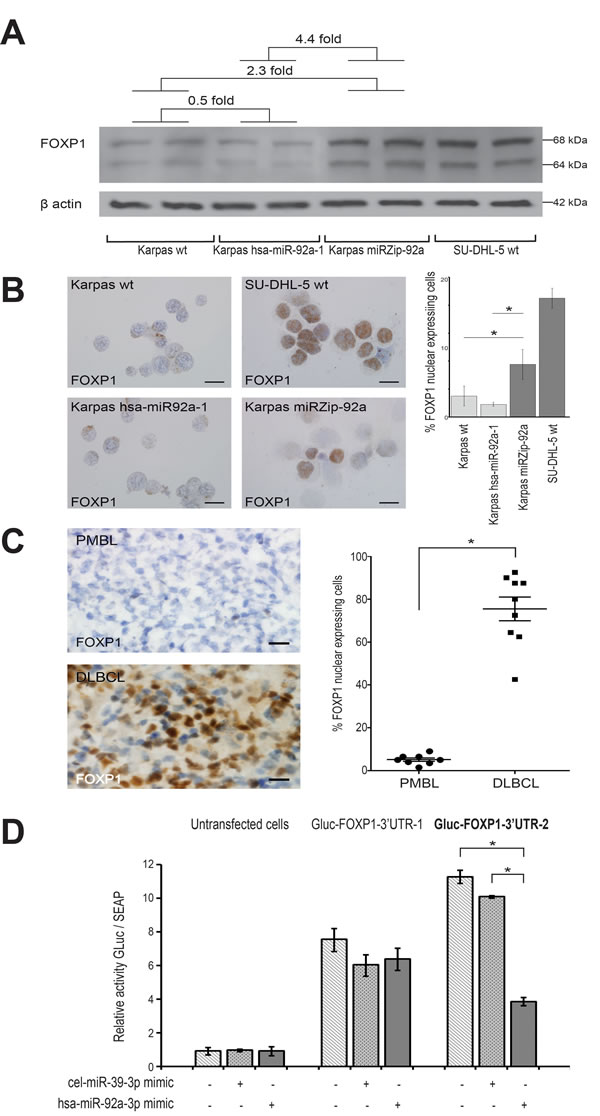
Figure 4: FOXP1 as target of miR-92a in PMBL. A. Western blot shows a FOXP1 protein expression in Karpas miRZip-92a that was 4.4 times higher than in Karpas hsa-miR-92a-1 *p =< 0.05. Karpas wt FOXP1 protein expression was also lower than Karpas miRZIP-92a (2.3 times) and higher than Karpas hsa-miR-92a-1 (0.5 times). B. FOXP1 nuclear expressing cells on smears from the four cell lines studied were significantly more numerous in Karpas miRZip-92a than in Karpas hsa-miR-92a-1 and Karpas wt (p < 0.05) (scale bar: 5µm). C. FOXP1 nuclear expressing cells on snap-frozen sections from PMBL and DLBCL patient samples were significantly less numerous in PMBL than in BLBCL (scale bar: 20µm). Statistical analyses were performed using the Mann-Whitney test. *P =< 0.05. D. Luciferase reporter activity test using 293T-cells expressing a GLuc-3’UTRFOXP1 fusion mRNA, transfected with a miR-92a mimic (hsa-miR-92a-3p mimic) or a negative control (cel-miR-39-3p mimic) shows a significantly lower luciferase activity in Gluc-FOXP1-3’UTR-2 transfected cells. Two plasmidic constructions were necessary to cover the whole FOXP1 3’UTR (Gluc-FOXP1-3’UTR-1 and Gluc-FOXP1-3’UTR-2). Results are expressed as mean luminescence activity +/- standard deviation. Statistical analyses were performed using the Mann-Whitney test. *P =< 0.05.
miR-92a, FOXP1, and apoptosis, proliferation and tumorigenicity
Cytometric analyses of apoptosis showed that, after 48h, Karpas miRZip-92a cells overexpressing FOXP1 had a significantly lower apoptosis rate than Karpas hsa-miR-92a-1 cells under-expressing FOXP1 (Figure 5A). Karpas wt also had a significantly lower apoptosis rate than Karpas hsa-miR-92a-1 cells under-expressing FOXP1 after 48h, and a higher apoptosis rate than Karpas miRZip-92a cells overexpressing FOXP1 after 72h.
When proliferation was studied, Karpas miRZip-92a cells had a significantly higher proliferation rate after 24h than Karpas wt and Karpas hsa-miR-92a-1 cells (Figure 5B). Karpas wt has the same proliferation rates as Karpas hsa-miR-92a-1.
FOXP1 overexpression induced by miR-92a downregulation was rescued using a siRNA targeting FOXP1 on Karpas miZip-92a cells. Karpas miRZip-92a transfected with siRNA FOXP1 had a significantly higher apoptosis rate after 96h, and a significantly lower proliferation rate after 48h compared to Karpas miZip-92a transfected with a scramble siRNA.
The tumorigenicity of Karpas wt, Karpas miRZip-92a and Karpas hsa-miR-92a-1 cell lines was assessed after injection of 10x106 cells into three groups of 10 NOD-SCID mice. Statistical analyses showed a shorter mean overall survival of mice injected with Karpas miRZip-92a cells (40 days) compared to mice injected with Karpas hsa-miR-92a-1 cells (59.5 days)(p < 0.05). The mean overall survival for Karpas wt was 53.9 days, significantly shorter than the overall survival of mice injected with Karpas miRZip-92a cells (p < 0.05).
Comparison of the tumorigenicity of Karpas miRZip-92a and Karpas hsa-miR-92a-1 in tissue was performed on mice euthanised at the same time in two series of 10 mice. These analyses were performed at days 35, 36, 37, 38, 42, 47, 48, 50 and 55. A massive involvement of mediastinal area by lymphoma cells was found in 8/10 mice injected with Karpas miRZip-92a cells but not in mice (0/10) injected with Karpas hsa-miR-92a-1 cells euthanised at the same date (Figure 5C).
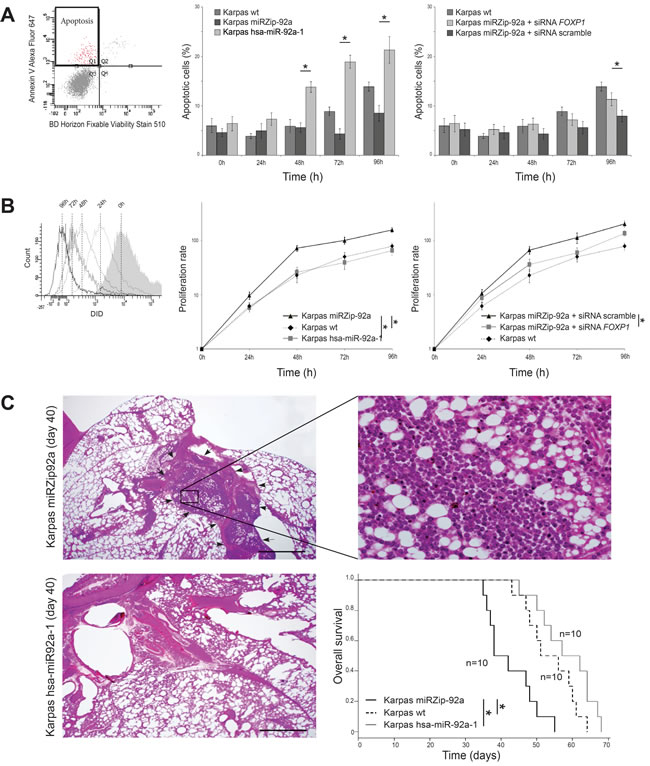
Figure 5: Functional analyses of miR-92a expression in PMBL cell lines. The tree Karpas cell lines were cultured for 7 days. A. Flow cytometry analyses of the two transduced Karpas cell lines show a significantly higher apoptosis rate, using Annexin V test, in Karpas hsa-miR-92a-1 (overexpressing miR-92a) than in Karpas miRZip-92a, at 48h, 72h and 96h. Karpas wt also had a significantly lower apoptosis rate than Karpas hsa-miR-92a-1 cells (under-expressing FOXP1) after 48h, and a higher apoptosis rate than Karpas miRZip-92a cells (overexpressing FOXP1) after 72h (p < 0.05). B. Flow cytometry analyses of the two transduced Karpas cell lines show a significantly lower proliferative rate in Karpas hsa-miR-92a-1 (overexpressing miR-92a) than in Karpas miRZip-92a, at 24h, 48h, 72h and 96h. Karpas wt has the same proliferation rates as Karpas hsa-miR-92a-1. C. Pathological study of the lung and mediastinum performed at day 40 shows an extensive mediastinal infiltration (arrows) of lymphoma cells (higher magnification) in mice injected with Karpas miRZip-92a, while mice injected with Karpas hsa-miR-92a-1 and euthanised at the same date have no mediastinal infiltration. Statistical analyses show a shorter mean overall survival of mice injected with Karpas miRZip-92a cells (40 days) compared with mice injected with Karpas hsa-miR-92a-1 cells (59.5 days)(p < 0.05). The mean overall survival of Karpas wt is 53.9 days, significantly longer than the overall survival of mice injected with Karpas miRZip-92a cells (40 days) (p < 0.05).
DISCUSSION
We identified here an overexpression of miR-92a in a series of PMBL compared to DLBCL human samples, and, using a combined bioinformatics and transcriptomic approach, we showed that FOXP1 was the main target of miR-92a in PMBL.
The miR-17~92 cluster is one of the most potent miRNA oncogenes, located at chromosome 13q31, a region amplified in Burkitt’s lymphoma, DLBCL, follicular and mantle cell lymphoma [31] . Increased miR-17~92 expression is found in B-cell lymphomas[26] and solid tumors (breast [32], colon [33], lung [23], neuroblastoma [34]). The miRs localized in paralog clusters can also be involved in aggressive lymphoma. They are associated with a high proliferation signature in mantle cell lymphoma [26], and with low survival in cutaneous B-cell lymphoma [35]. The absence of significant difference between PMBL and cHL for the expression level of the miRs in the oncogenic cluster is coherent with the similarities found between the two entities in transcriptional profiles, with high levels of expression of cytokine pathway components, TNF family members and extracellular matrix elements [8]. The fact that the miR from the paralog clusters did not show any significant change when PMBL were compared to cHL or to DLBCL is in favour of an absence of functional redundancy or compensation between the genes studied [21].
Large clusters of miRNAs are often expressed polycistronically. Therefore, it is important to assess the function of individual miRNAs within the cluster [18]. In this study, when we compared expression level of miR-17~92 in PMBL and DLBCL, we showed a down-regulation of every miRs in PMBL except for miR-92a, that was significantly overexpressed. This had not been reported in the two previous studies of miR expression in PMBL [36, 37]. MiR-92a, overexpressed in our series of PMBL human samples and Karpas cell line, can exert antagonist biological functions in experimental conditions: in the Eµ-myc Burkitt’s lymphoma model, it promotes c-Myc-induced apoptosis [19, 38] ; in mouse embryonic fibroblasts, and in primary B-cells, it enhances c-Myc-induced cell proliferation [38].
To study the function of miR-92a in human PMBL, we transduced human Karpas cells to let them overexpress or underexpress miR-92a. We found a significantly higher rate of apoptosis and lower rate of proliferation in cells overexpressing miR-92a. In addition, when these transduced cells were injected into NOD-SCID mice, a significantly higher overall survival, together with a less-severe mediastinal involvement, was observed in mice injected with Karpas cells overexpressing miR-92a.
Overall, these results indicated a tumor-suppressor role of miR-92a in PMBL.
This is coherent with the fact that PMBL, an aggressive lymphoma, has a more favourable outcome than other subgroups of DLBCL: 64% 5 year-survival rate versus 46% for DLBCL after anthracycline-combined multiagent chemotherapy [1]; 88.50% 3 year survival rate versus 78.20% for DLBCL after R-CHOP-21 [39].
Using combined in silico prediction and transcriptomic analyses, we identified four possible down-regulated targets for miR-92a. 3’UTR assay together with protein expression analysis in transfected cell lines, enabled us to identify FOXP1 as the target of miR-92a in PMBL, a result not previously established.
In situ analyses in PMBL and DLBCL human samples confirmed that FOXP1 RNA and protein expressions were significantly lower in PMBL than in DLBCL, in accordance with the higher miR-92a expression found in PMBL than in DLBCL. An elevated FOXP1 RNA expression level has been reported in DLBCL, activated B-cell like (ABC) subtype [40] , and MALT lymphoma at high risk of transforming into aggressive DLBCL [9]. This overexpression of FOXP1 can be caused by a trisomy 3 in ABC-DLBCL [13], and by t(3 ;14)(p14 ;q32) translocation, involving FOXP1 and IgH loci, in ABC-DLBCL and Malt lymphoma [14, 15]. A recent NGS study of 215 B-cell lymphoma characterized 3 mutated genes: ITPKB, MFHAS1, and XPO1 present in 18 cases (39%, 28%, and 39% respectively) of PMBL [7]. A literature analysis did not show any mechanistic link published between these three genes and FOXP1. HL shares a low FOXP1 protein expression with PMBL [13, 41, 42]. In contrast, the high level of FOXP1 protein expression in DLBCL has been included in immunostain algorithms [43-45], which can be associated with FISH tests [46, 47], or with a reciprocal expression of HIP1R protein to classify DLBCL into molecular subtypes with prognostic value in patients treated with rituximab [48].
The role of FOXP1 in human lymphoma has mostly been studied in DLBCL cell lines. Transcriptomic analyses of ABC-DLBCL versus GCB-DLBCL cell lines identified 237 FOXP1 targets [49]. Using this list to filter our transcriptomic datasets of PMBL versus DLBCL patient samples, we identified 9 FOXP1 targets: 3 downregulated by FOXP1 (DERL3, TTC28, and TPRA1), and 6 upregulated by FOXP1 (FMNL3, DNAJB6, KMO, SNX29, ERP44, and CD80). Since the originality of our study is the use of patient samples that were carefully laser-microdissected to obtain high quality RNAs, we also performed a systematic review of databases presently available on FOXP1 targets in human samples. In the “transcription factor encyclopedia” (http://cisreg.cmmt.ubc.ca/) database, this enabled us to find 8 FOXP1 targets. Two of them were overexpressed in PMBL versus DLCBL human samples, as expected. In addition, the upregulation of CDKN1A, one of these two FOXP1 target genes is coherent with the clinical data. This gene corresponds to p21 protein whose expression has been reported to be linked to better prognosis in DLBCL [50]. So far, CDKN1A upregulation in PMBL has not been reported. It could contribute to the better prognosis of this form of human B-cell lymphoma (Supplementary figure 7).
The ability of FOXP1 to enhance proliferation has been demonstrated using siRNA-mediated silencing [17]. Another recent study showed that FOXP1 directly represses transcription of proapoptotic genes and cooperates with NF-B to promote human B-cell expansion and survival [51]. NF-ƙB is also activated in PMBL [2, 8, 52], but FOXP1, which we identified as the target of miR-92a, is down-regulated in PMBL, and cannot be involved in the same way as in DLBCL.
The relevance of miR-92a and FOXP1 as new diagnostic markers to better characterize PMBL needs to be tested in a large multicenter study, but the feasibility of their use in daily practice is an important point. Mir-92a can be tested using a simple PCR performed on small RNA fragments extracted from formalin-fixed, paraffin-embedded tissues, and FOXP1 expression can be assessed using common immunohistochemistry on paraffin sections.
In conclusion, we demonstrated the post-transcription regulation by miR-92a through FOXP1 targeting in PMBL.
MATERIALS AND METHODS
Patients tissue samples, cell lines
The series included eighty biopsies performed for diagnostic purposes; part of the material remaining after the diagnosis had been established was used for research. The Fundación-Santa-Fe-de-Bogotá-Hospital ethical review board approved the protocol.
Forty patients had newly diagnosed PMBL, and twenty patients newly diagnosed DLBCL not otherwise specified. Twenty other patients had newly diagnosed cHL with mediastinal masses, 10 from Hôpital-Saint-Louis, and 10 from Bogotá-Hospital. Patient characteristics at initial diagnosis are summarized in Table 1.
For all eighty patients, formalin-fixed and paraffin-embedded tissue samples were available. Histological diagnosis was performed by 2 pathologists (MR, CS), according to WHO 2008 criteria. Snap-frozen tissue samples were also available for 8 PMBL, and 9 DLBCL. Laser-microdissection of tumor cells was performed on all samples studied, whether formalin fixed or snap frozen, by two trained pathologists (MR, AJ).
This study also included two human cell lines: a PMBL cell line (Karpas-1106P, Sigma, France) and a DLBCL cell line (SU-DHL-5, DSMZ, Germany). Cell lines were maintained under standard culture conditions: 37°C and 5% CO2 in RPMI-1640 medium supplemented with glutamine (200mM), 20% fetal-calf-serum (GE-Life-Sciences/PAA-Laboratories, Inc), and 0.5mg/mL penicillin-streptomycin (Invitrogen, France).
Table 1: Patients characteristics
Characteristics |
PMBL n= 40 |
DLBCL patients n= 20 |
cHL patients n= 20 |
Gender M/F |
9:31 |
8:12 |
9:11 |
Median age (years) range |
27.7 18-47 |
64.8 26-82 |
33.4 20-48 |
Stage I-II III-IV |
10 30 |
10 10 |
15 5 |
Extranodal disease |
0 |
11 |
0 |
Nb of extranodal sites 0 1 >2 |
__ __ __ |
8 7 5 |
__ __ __ |
LDH above normal |
26 |
12 |
6 |
Performance status 0-1 2 |
34 6 |
15 5 |
17 3 |
Mediastinal mass Nodal site ≥2 ESR ≥50 |
40 __ __ |
0 __ __ |
20 5 9 |
IPI score/SPi |
0-1 (13) 2 (25) 3 (2) 4-5 (0) |
0-1 (4) 2 (8) 3 (2) 4-5 (6) |
Early (8) Intermediate (7) Advanced (5) __ |
Treatment |
R-ACEVP (24) R-CHOP (16) |
R-CHOP |
ABVD |
Abbreviations: PMBL, Primary mediastinal large B-cell lymphoma; DLBCL, diffuse B-cell lymphoma; cHL, classic Hodgkin lymphoma; LDH, lactate dehydrogenase; IPI, International prognostic index; SPI , ESR, erythrocyte sedimentation rate, R-ACBVP, rituximab, doxorubicin, cyclophosphamide, bleomycin, vindesine and prednisone; R-CHOP, rituximab, doxorubicin, vincristine, prednisone; ABVD, Adriamycin, bleomycin, vinblastine, dacarbazine
Lentiviral infection of cell lines
Karpas wt cells (25x104 per milliliter) were transduced with VSV-G pseudotype viral particles (Ozyme, France) (MOI(Karpas)=90) that included miRZip-92a anti miR-92a construct (Ozyme, France) on RetroNectin precoated dishes (Takara, Ozyme, France) to induce a low expression of miR-92a. A high expression of miR-92a was induced by the inclusion of hsa-miR-92a-1 pre-miRNA construct (Ozyme, France) on RetroNectin precoated dishes.
After 24 hours, the stably transduced clones were selected by puromycin (0,1 ng/ul).
Transduction efficiency was assessed using green fluorescence protein on a FACSCalibur cytometer from Becton-Dickinson. miR-92a expression levels were measured using RT-qPCR (Supplementary figure 1)
Quantification of expression of the miR-17~92 cluster and its paralogs
Laser-microdissection was performed on each tissue sample using a PALM-Microbeam/Zeiss system (Zeiss, Wetzlar, Germany). On 7-μm-thick sections of formalin-fixed paraffin-embedded samples, tumor cells were identified using anti-CD20-antibody (Clone L26, Dako, France) for PMBL and DLBCL, and anti-CD30-antibody (Clone Ber-H2, Dako, France) for cHL. In each PMBL and DLBCL sample, approximately 1500 tumor cells were microdissected, corresponding to a mean area of 301.440 μm2 (PALM-Robot-Software). In cHL approximately 1000 tumor cells were microdissected, corresponding to a mean area of 490.625 μm2.
Total RNA was extracted using RecoverAll-isolation-kit (Ambion, Cambridgeshire, UK), according to the manufacturer’s protocol. RNA quality was assessed by spectrometric assay (NanoDrop®, Thermo-scientific, USA).
For human cell lines, 10x106 cells were collected for Karpas wt, Karpas miRZip-92a, Karpas hsa-miR-92a-1 and SU-DHL-5 wt. Total RNA was extracted using mirVana miRNA Isolation Kit (Ambion, Invitrogen, France), according to the manufacturer’s protocol. RNA quality was assessed by spectrometric assay.
The miR-17~92 cluster and its paralogs (miR-106a-363 cluster and miR-106b-25 cluster) were analyzed in all 80 formalin-fixed paraffin-embedded samples and two cell lines by Q-RT-PCR using miRNA-reverse-transcription-kit, and hsa-miR-17, hsa-miR-18a, hsa-miR-18b, hsa-miR-19a, hsa-miR-19b, hsa-miR-20a, hsa-miR-20b, hsa-miR-25, hsa-miR-92a, hsa-miR-93, hsa-miR-106a, hsa-miR-106b, hsa-miR-363 Taqman assays (Applied-Biosystem, Darmstadt, Germany) on Biorad Real-Time Detection System (Bio-Rad, CA, USA). RNU24 and RNU44 assays were used as endogenous controls for normalization. Data were then normalized to the mean of the two references genes, using CFX manager software (Bio-Rad, France), and expression levels were calculated using 2-ΔCq method.
Microarray analyses and miR-92a target prediction
Laser-microdissection was performed in cryopreserved samples available for 8 patients with PMBL and for 9 patients with DLBCL. Seven µm-thick cryocut sections were incubated for 5 min with anti-human-CD20 antibody (clone L26, Dako, France) labeled with APEX™ Alexa Fluor® 488. Immunofluorescent tumor cells were microdissected using PALM-Microbeam/Zeiss system. In each case, quantification was performed using PALM-Robot-software: approximately 1500 tumor cells for a mean 301.440 μm2 area.
For the wild type and the two transfected Karpas human cell lines studied, 10x106 cells were used.
Total RNA extraction was performed in human samples and cell lines as described above. RNA quality was checked using Agilent Bioanalyzer (Agilent-Technologies, CA, USA). All samples had RNA integrity number (RIN) between 7 and 8,3. Fifty ng of total RNA were amplified and labelled using the Low-Input-Quick-Amp-Labeling-kit and hybridized overnight in Agilent-Whole-Human-genome-Oligo-Microarrays-8x60k. Scanning was carried out with Microarray-Scanner-System. Intensity profile for each probe set was calculated using Agilent-Feature-Extraction-Software.
For gene analyses, comparisons were performed for between PMBL and DLBCL patients and between the four human cell lines studied.
To identify genes with significant expression changes, analyses were performed in the R-statistical-computing-environment (version x64 3.0.2, http://www.r-project.org). The Bioconductor Agi4x44Preprocess package was used to read Gene-expression-assay data files, to apply a background correction, to filter probes and to normalize gene expression across samples. The SAMR package was used to identify differentially expressed genes in samples with the two-class unpaired method, based on the ExpressionSet generated by the Agi4x44-Preprocess package. Hierarchical clustering was performed with the heatmap.2 function of R, evaluating distances between samples and genes using the Manhattan method and reordering them with Ward’s algorithm.
We then determined whether there was an association between differentially expressed genes in samples and biological pathways using GAGE package. We also looked for biological pathways with a significantly different expression in PMBL versus DLBCL, and in the four human cell lines studied.
The microarray data set is filed in the ArrayExpress-public-database at the European-Bioinformatic-Institute (E-MTAB-4165 / GAPIHAN / primary mediastinal large B-cell lymphoma).
In silico target prediction for miR-92a was carried out using the CoMeTa tool (Co-expression Meta-analysis of miRNA Targets, http://cometa.tigem.it). We obtained a list of putative miR-92a targets. We then studied whether they were differentially expressed in PMBL versus DLBCL. False discovery rates (FDR) associated with p-values were calculated using the p.adjust R command (Benjamini and Hochberg method). Associations with FDR-adjusted p-values (q-values) of less than 0.05 and fold changes of more than 2 were considered significant. The same comparisons were carried out for human cell lines with low expression of miR-92a (Karpas miRZip-92a and SU-DHL-5 wt) versus human cell lines with high expression of miR-92a (Karpas hsa-miR-92a-1 and Karpas wt).
Analyses of FOXP1 expression
Quantification of mRNA expression of putative miR-92a targets was performed from available snap-frozen samples from 8 patients with PMBL and 9 with DLBCL, and from the wild type and the two transfected Karpas cell lines, with Q-RT-PCR using GoScript™-Reverse-Transcription System (Promega, France), GoTaq® qPCR Master Mix (Promega, France), and taqman primers and probes for FOXP1 (Hs00544877_m1), CIC (Hs00943425_g1), SMG1 (Hs00247891_m1), and INADL (Hs00195106_m1). Assays were read on the Biorad Real-Time Detection System. TBP (Hs99999910_m1) (Life-Technologies) was used as the endogenous control for normalization. Data were normalized on the reference gene, using CFX manager software and expression levels were calculated using the 2-ΔCq method.
Immunohistochemistry was performed on 5µm-thick snap-frozen sections from patient samples, and smears from the four cell lines studied, using anti-human FOXP1 antibody (HPA003876-100UL, 1/10, Sigma, FRANCE). Controls systematically included absence of primary antibody and incubation with an irrelevant rabbit polyclonal antibody. Tissue sections were analyzed under Olympus-AX-70 microscope with a 0.344mm2 field size at X400 magnification (Olympus,Tokyo, Japan). Counts of positive FOXP1 cells were performed on five different fields by two independent observers (MR, AJ). Results were expressed as means +/- standard deviation.
FOXP1 copy number analysis by droplet digital PCR
Laser-microdissection was performed for the 8 PMBL and 9 DLBCL samples that had already been studied for transcriptomic analyses. On 7 µm-thick cryocut sections, tumor cells were identified using anti-CD20-antibody. In each case, approximately 1500 tumor cells were microdissected for a mean area of 301.440 μm2.
For the SU-DHL-5 wt, Karpas wt, Karpas hsa-miR-92a-1 and Karpas miRZip-92a human cell lines studied, 10x106 cells were used.
DNA was extracted using QIAamp-DNA-Mini-kit (Quiagen, France) and DNA quality was assessed by spectrometric assay.
Droplets were generated in a QX100 droplet generator (Bio-Rad, CA, USA). PCR was performed on a C1000 PCR thermal cycler (Bio-Rad, CA, USA) using FAM-labeled FOXP1 taqman primers (Hs04751460_cn) and a VIC-labeled copy number reference RNaseP (Life-Technologies, France). PCR results were read in a QX100 droplet reader (Rio-Rad, CA, USA).
Western blots
107 cells of each of the four cell lines studied were lysed in 200µL lysis buffer (0.5M Tris-HCl, pH 6.8, 2mM EDTA, 10% glycerol, 2% SDS and 5% b-mercaptoethanol). Whole lysates (20µg) were separated on a 10% SDS-PAGE and immunoblotted using anti-human FOXP1 (HPA003876-100UL, 1/2500, Sigma, FRANCE) or anti-human beta-actin (AC-74 clone, 1/5000, Sigma, France). Bands were visualized by chemiluminescence on an LAS-3000 analyser (Fujifilm, France) and analyzed using Multi-Gauge-V3.0 software (Fujifilm, France).
Luciferase reporter assay
FOXP1 3’UTR sequence was inserted downstream of the secreted Gaussia luciferase (GLuc) reporter gene. The GLuc vector system had been driven by SV40 promoter for expression in mammalian cells.
To cover the whole FOXP1 3’UTR, two plasmidic constructions: Gluc-FOXP1-3’UTR-1 and Gluc-FOXP1-3’UTR-2 (GenoCopoeia, Tebu-bio, France) were necessary. Each of them had an identical 72bp sequence to form an overlap.
To perform this Luciferase reporter assay, we chose the 293T-cell line because it had already been efficiently transfected with miR-92a [30].
293T-cells were first transfected with these constructions using lipofection (Ozyme, France). The same cells were in a second step transfected with 50nM of hsa-miR-92a-3p mimic (Exiqon, France) using lipofection. Non-transfected 293T-cells were used as controls for plasmid transfection. The negative control for miR activity was cel-miR-39-3p.
Luciferase activity was measured 72 hours after miRNA transfection using the Secrete-Pair-Dual-Luminescence-Assay-Kit (Genocopoeia, Tebu-bio, France). Analyses were performed on a FLUOstar Optima spectrophotometer (BMG Labtech), using the Secreted alkaline phosphatase (SEAP) signal to normalize the GLuc activity (GenoCopoeia, Tebu-bio, France).
FOXP1 siRNA downregulation
5x10⁶ Karpas miRZip-92a cells, cultured in a 6-well Petri dish, were transfected with FOXP1 siRNA (sc-4483, Santa Cruz Biotechnology, France) or scrumble (siRNA sc-37007, Santa Cruz Biotechnology, France) in siRNA transfection reagent (sc-39528, Santa Cruz Biotechnology, France) according to the manufacturer’s protocol.
Proliferation of transfected cells
5x10⁶ cells of each wild type and the two transfected Karpas cell lines studied were uniformly labeled in Vybrant® DiD cell-labeling solution (Invitrogen, France) and cultured in a 6-well Petri dish for 7 days. Cells were analyzed on a BD-Canto-II-cytometer each day at wavelength 660/20nm mean fluorescence. Proliferation rates were calculated according to the fluorescence decrease.
5x10⁶ cells of each wild type Karpas, Karpas hsa-miR-92a-1, Karpas miRZIP-92a, Karpas miRZIP-92a + siRNA FOXP1 and Karpas miRZip-92a + siRNA scramble cell lines were uniformly labeled in Vybrant® DiD cell-labeling solution (Invitrogen, France) and cultured in a 6wells-Petri-dish for 7 days. Cells were analyzed on a BD-Canto-II-cytometer each day at wavelength 660/20nm mean fluorescence. Proliferation rates were calculated according to the fluorescence decrease.
Apoptosis of transfected cells
5x10⁶ cells of each wild type and the two transfected Karpas cell lines were cultured on a 6-well Petri dish for 7 days. Each day, 1x10⁶ cells were labeled using 5µL Annexin V-647 (Invitrogen, France) and 1µL BD-Horizon-Fixable-viability-stain-510 (BD, France). Analyses were performed using flow cytometry at wavelengths 510/50nm and 660/20nm respectively.
5x10⁶ cells of each wild type Karpas, Karpas hsa-miR-92a-1, Karpas miRZIP-92a, Karpas miRZIP-92a + siRNA FOXP1 and Karpas miRZip-92a + siRNA scramble cell lines were cultured on a 6wells-Petri-dish for 7 days. Each day, 1x10⁶ cells were labeled using 5µL Annexin V-647 (Invitrogen, France) and 1µL BD-Horizon-Fixable-viability-stain-510 (BD, France). Analyses were performed using flow cytometry at wavelengths 510/50nm and 660/20nm respectively.
In vivo tumorigenicity of transfected cells
All experimentations were performed in accordance with the European Community recommendations (2010/63/UE).
Three groups of 10 six-week-old NOD-SCID female mice (Janvier lab, France), maintained in specific pathogen-free conditions were used. Each group had intravenous injections of 10x106 Karpas wt, Karpas hsa-miR92a-1 or Karpas miRZip-92a cells. A clinical score was assessed daily on weight loss, grooming, posture, respiratory rate and activity for each mouse. Animals were euthanised using cervical dislocation when protocol limit-breaks were reached, and systematic pathological analyses were performed.
To compare tumor extension in the different organs for Karpas miRZip-92a and Karpas hsa-miR-92a-1 cell lines at the same time-point, two other groups of 10 six-week-old NOD-SCID female mice had similar injections. Since Karpas miRZip-92a mice were the first to die, whenever one mouse in this group died, a mouse from the Karpas hsa-miR-92a-1 group was also euthanised and systematic concomitant pathological analyses were performed.
Statistical analyses
Analyses were performed with GraphPad and SAS 8.2 software (SAS Institute Inc, USA).
MicroRNA expression levels were expressed as the median fold change +/-Standard Deviation. mRNA expression levels were expressed as the mean fold change +/-Standard Deviation.
The Mann-Whitney test was used to compare expression levels in PMBL, DLBCL and cHL samples, and in the four cell lines studied.
The results of these comparisons were considered significant when the two-sided p-value was <0.05. This significance threshold was corrected for multiple comparisons using the Bonferroni method.
Droplet-digital-PCR data were analysed using the QuantaSoft software to measure the fraction of positive droplets and calculate the amount of template per droplet based on a Poisson distribution.
Acknowledgments
This work was supported by Université-Paris-Diderot, Région Île-de-France, and Institut National Cancer (INCa).
We thank pathologists and haematologists from Colombia hospitals: Marly-Hospital, Fundación-Cardio-Infantil-Hospital, Country-Hospital, San-Jose-Hospital, UIS-Hospital, Neiva-Hospital, Mederic-Hospital, Imbanaco-Hospital, for kindly providing PMBL cases. We also thank Dr G.Bousquet for thorough critical review of the manuscript. A Swaine reviewed the English language.
Conflict of interest
All authors declare: no conflict of interest
G.G is recipient of a grant “CIFRE” (n°2013/1323) from AAREC Filia Research and French Ministry of Research.
Editorial note
This paper has been accepted based in part on peer-review conducted by another journal and the authors’ response and revisions as well as expedited peer-review in Oncotarget.
REFERENCES
1. Rosenwald A, Wright G, Leroy K, Yu X, Gaulard P, Gascoyne RD, Chan WC, Zhao T, Haioun C, Greiner TC, Weisenburger DD, Lynch JC, Vose J, et al. Molecular diagnosis of primary mediastinal B cell lymphoma identifies a clinically favorable subgroup of diffuse large B cell lymphoma related to Hodgkin lymphoma. J Exp Med. 2003; 198(6):851-862.
2. Steidl C and Gascoyne RD. The molecular pathogenesis of primary mediastinal large B-cell lymphoma. Blood. 2011; 118(10):2659-2669.
3. Dunleavy K, Pittaluga S, Maeda LS, Advani R, Chen CC, Hessler J, Steinberg SM, Grant C, Wright G, Varma G, Staudt LM, Jaffe ES and Wilson WH. Dose-adjusted EPOCH-rituximab therapy in primary mediastinal B-cell lymphoma. N Engl J Med. 2013; 368(15):1408-1416.
4. Bhatt VR, Mourya R, Shrestha R and Armitage JO. Primary mediastinal large B-cell lymphoma. Cancer Treat Rev. 2015; 41(6):476-485.
5. Gunawardana J, Chan FC, Telenius A, Woolcock B, Kridel R, Tan KL, Ben-Neriah S, Mottok A, Lim RS, Boyle M, Rogic S, Rimsza LM, Guiter C, et al. Recurrent somatic mutations of PTPN1 in primary mediastinal B cell lymphoma and Hodgkin lymphoma. Nat Genet. 2014; 46(4):329-335.
6. Alizadeh AA, Eisen MB, Davis RE, Ma C, Lossos IS, Rosenwald A, Boldrick JC, Sabet H, Tran T, Yu X, Powell JI, Yang L, Marti GE, et al. Distinct types of diffuse large B-cell lymphoma identified by gene expression profiling. Nature. 2000; 403(6769):503-511.
7. Dubois S, Viailly PJ, Mareschal S, Bohers E, Bertrand P, Ruminy P, Maingonnat C, Jais JP, Peyrouze P, Figeac M, Molina TJ, Desmots F, Fest T, et al. Next-Generation Sequencing in Diffuse Large B-Cell Lymphoma Highlights Molecular Divergence and Therapeutic Opportunities: a LYSA Study. Clin Cancer Res. 2016; 22(12):2919-2928.
8. Savage KJ, Monti S, Kutok JL, Cattoretti G, Neuberg D, De Leval L, Kurtin P, Dal Cin P, Ladd C, Feuerhake F, Aguiar RC, Li S, Salles G, et al. The molecular signature of mediastinal large B-cell lymphoma differs from that of other diffuse large B-cell lymphomas and shares features with classical Hodgkin lymphoma. Blood. 2003; 102(12):3871-3879.
9. Sagaert X, de Paepe P, Libbrecht L, Vanhentenrijk V, Verhoef G, Thomas J, Wlodarska I and De Wolf-Peeters C. Forkhead box protein P1 expression in mucosa-associated lymphoid tissue lymphomas predicts poor prognosis and transformation to diffuse large B-cell lymphoma. J Clin Oncol. 2006; 24(16):2490-2497.
10. Hu H, Wang B, Borde M, Nardone J, Maika S, Allred L, Tucker PW and Rao A. Foxp1 is an essential transcriptional regulator of B cell development. Nat Immunol. 2006; 7(8):819-826.
11. Sagardoy A, Martinez-Ferrandis JI, Roa S, Bunting KL, Aznar MA, Elemento O, Shaknovich R, Fontan L, Fresquet V, Perez-Roger I, Robles EF, De Smedt L, Sagaert X, et al. Downregulation of FOXP1 is required during germinal center B-cell function. Blood. 2013; 121(21):4311-4320.
12. Nagel S, Meyer C, Kaufmann M, Drexler HG and MacLeod RA. Deregulated FOX genes in Hodgkin lymphoma. Genes Chromosomes Cancer. 2014; 53(11):917-933.
13. Lenz G, Wright GW, Emre NC, Kohlhammer H, Dave SS, Davis RE, Carty S, Lam LT, Shaffer AL, Xiao W, Powell J, Rosenwald A, Ott G, et al. Molecular subtypes of diffuse large B-cell lymphoma arise by distinct genetic pathways. Proc Natl Acad Sci U S A. 2008; 105(36):13520-13525.
14. Fenton JA, Schuuring E, Barrans SL, Banham AH, Rollinson SJ, Morgan GJ, Jack AS, van Krieken JH and Kluin PM. t(3;14)(p14;q32) results in aberrant expression of FOXP1 in a case of diffuse large B-cell lymphoma. Genes Chromosomes Cancer. 2006; 45(2):164-168.
15. Streubel B, Vinatzer U, Lamprecht A, Raderer M and Chott A. T(3;14)(p14.1;q32) involving IGH and FOXP1 is a novel recurrent chromosomal aberration in MALT lymphoma. Leukemia. 2005; 19(4):652-658.
16. van Keimpema M, Gruneberg LJ, Mokry M, van Boxtel R, van Zelm MC, Coffer P, Pals ST and Spaargaren M. The forkhead transcription factor FOXP1 represses human plasma cell differentiation. Blood. 2015; 126(18):2098-2109.
17. Craig VJ, Cogliatti SB, Imig J, Renner C, Neuenschwander S, Rehrauer H, Schlapbach R, Dirnhofer S, Tzankov A and Muller A. Myc-mediated repression of microRNA-34a promotes high-grade transformation of B-cell lymphoma by dysregulation of FoxP1. Blood. 2011; 117(23):6227-6236.
18. Kasinski AL and Slack FJ. Epigenetics and genetics. MicroRNAs en route to the clinic: progress in validating and targeting microRNAs for cancer therapy. Nat Rev Cancer. 2011; 11(12):849-864.
19. Musilova K and Mraz M. MicroRNAs in B-cell lymphomas: how a complex biology gets more complex. Leukemia. 2015; 29(5):1004-1017.
20. Di Lisio L, Martinez N, Montes-Moreno S, Piris-Villaespesa M, Sanchez-Beato M and Piris MA. The role of miRNAs in the pathogenesis and diagnosis of B-cell lymphomas. Blood. 2012.
21. Ventura A, Young AG, Winslow MM, Lintault L, Meissner A, Erkeland SJ, Newman J, Bronson RT, Crowley D, Stone JR, Jaenisch R, Sharp PA and Jacks T. Targeted deletion reveals essential and overlapping functions of the miR-17 through 92 family of miRNA clusters. Cell. 2008; 132(5):875-886.
22. Mendell JT. miRiad roles for the miR-17-92 cluster in development and disease. Cell. 2008; 133(2):217-222.
23. Hayashita Y, Osada H, Tatematsu Y, Yamada H, Yanagisawa K, Tomida S, Yatabe Y, Kawahara K, Sekido Y and Takahashi T. A polycistronic microRNA cluster, miR-17-92, is overexpressed in human lung cancers and enhances cell proliferation. Cancer Res. 2005; 65(21):9628-9632.
24. Mogilyansky E and Rigoutsos I. The miR-17/92 cluster: a comprehensive update on its genomics, genetics, functions and increasingly important and numerous roles in health and disease. Cell Death Differ. 2013; 20(12):1603-1614.
25. Xiao C, Srinivasan L, Calado DP, Patterson HC, Zhang B, Wang J, Henderson JM, Kutok JL and Rajewsky K. Lymphoproliferative disease and autoimmunity in mice with increased miR-17-92 expression in lymphocytes. Nat Immunol. 2008; 9(4):405-414.
26. Iqbal J, Shen Y, Liu Y, Fu K, Jaffe ES, Liu C, Liu Z, Lachel CM, Deffenbacher K, Greiner TC, Vose JM, Bhagavathi S, Staudt LM, et al. Genome-wide miRNA profiling of mantle cell lymphoma reveals a distinct subgroup with poor prognosis. Blood. 2012; 119(21):4939-4948.
27. Inomata M, Tagawa H, Guo YM, Kameoka Y, Takahashi N and Sawada K. MicroRNA-17-92 down-regulates expression of distinct targets in different B-cell lymphoma subtypes. Blood. 2009; 113(2):396-402.
28. Thapa DR, Li X, Jamieson BD and Martinez-Maza O. Overexpression of microRNAs from the miR-17-92 paralog clusters in AIDS-related non-Hodgkin’s lymphomas. PLoS One. 2011; 6(6):e20781.
29. Rao E, Jiang C, Ji M, Huang X, Iqbal J, Lenz G, Wright G, Staudt LM, Zhao Y, McKeithan TW, Chan WC and Fu K. The miRNA-17 approximately 92 cluster mediates chemoresistance and enhances tumor growth in mantle cell lymphoma via PI3K/AKT pathway activation. Leukemia. 2012; 26(5):1064-1072.
30. Attar M, Arefian E, Nabiuni M, Adegani FJ, Bakhtiari SH, Karimi Z, Barzegar M and Soleimani M. MicroRNA 17-92 expressed by a transposone-based vector changes expression level of cell-cycle-related genes. Cell Biol Int. 2012; 36(11):1005-1012.
31. He L, Thomson JM, Hemann MT, Hernando-Monge E, Mu D, Goodson S, Powers S, Cordon-Cardo C, Lowe SW, Hannon GJ and Hammond SM. A microRNA polycistron as a potential human oncogene. Nature. 2005; 435(7043):828-833.
32. Kim K, Chadalapaka G, Lee SO, Yamada D, Sastre-Garau X, Defossez PA, Park YY, Lee JS and Safe S. Identification of oncogenic microRNA-17-92/ZBTB4/specificity protein axis in breast cancer. Oncogene. 2012; 31(8):1034-1044.
33. Lanza G, Ferracin M, Gafa R, Veronese A, Spizzo R, Pichiorri F, Liu CG, Calin GA, Croce CM and Negrini M. mRNA/microRNA gene expression profile in microsatellite unstable colorectal cancer. Mol Cancer. 2007; 6:54.
34. Mestdagh P, Bostrom AK, Impens F, Fredlund E, Van Peer G, De Antonellis P, von Stedingk K, Ghesquiere B, Schulte S, Dews M, Thomas-Tikhonenko A, Schulte JH, Zollo M, et al. The miR-17-92 microRNA cluster regulates multiple components of the TGF-beta pathway in neuroblastoma. Molecular cell. 2010; 40(5):762-773.
35. Battistella M, Romero M, Castro-Vega LJ, Gapihan G, Bouhidel F, Bagot M, Feugeas JP and Janin A. The High Expression of the microRNA 17-92 Cluster and its Paralogs, and the Downregulation of the Target Gene PTEN, Is Associated with Primary Cutaneous B-Cell Lymphoma Progression. The Journal of investigative dermatology. 2015; 135(6):1659-1667.
36. Kluiver J, Poppema S, de Jong D, Blokzijl T, Harms G, Jacobs S, Kroesen BJ and van den Berg A. BIC and miR-155 are highly expressed in Hodgkin, primary mediastinal and diffuse large B cell lymphomas. The Journal of pathology. 2005; 207(2):243-249.
37. Iqbal J, Shen Y, Huang X, Liu Y, Wake L, Liu C, Deffenbacher K, Lachel CM, Wang C, Rohr J, Guo S, Smith LM, Wright G, et al. Global microRNA expression profiling uncovers molecular markers for classification and prognosis in aggressive B-cell lymphoma. Blood. 2015; 125(7):1137-1145.
38. Olive V, Sabio E, Bennett MJ, De Jong CS, Biton A, McGann JC, Greaney SK, Sodir NM, Zhou AY, Balakrishnan A, Foth M, Luftig MA, Goga A, et al. A component of the mir-17-92 polycistronic oncomir promotes oncogene-dependent apoptosis. eLife. 2013; 2:e00822.
39. Dabrowska-Iwanicka A and Walewski JA. Primary mediastinal large B-cell lymphoma. Curr Hematol Malig Rep. 2014; 9(3):273-283.
40. Wright G, Tan B, Rosenwald A, Hurt EH, Wiestner A and Staudt LM. A gene expression-based method to diagnose clinically distinct subgroups of diffuse large B cell lymphoma. Proc Natl Acad Sci U S A. 2003; 100(17):9991-9996.
41. Brown P, Marafioti T, Kusec R and Banham AH. The FOXP1 transcription factor is expressed in the majority of follicular lymphomas but is rarely expressed in classical and lymphocyte predominant Hodgkin’s lymphoma. J Mol Histol. 2005; 36(4):249-256.
42. Hu S, Xu-Monette ZY, Balasubramanyam A, Manyam GC, Visco C, Tzankov A, Liu WM, Miranda RN, Zhang L, Montes-Moreno S, Dybkaer K, Chiu A, Orazi A, et al. CD30 expression defines a novel subgroup of diffuse large B-cell lymphoma with favorable prognosis and distinct gene expression signature: a report from the International DLBCL Rituximab-CHOP Consortium Program Study. Blood. 2013; 121(14):2715-2724.
43. Horn H, Ziepert M, Wartenberg M, Staiger AM, Barth TF, Bernd HW, Feller AC, Klapper W, Stuhlmann-Laeisz C, Hummel M, Stein H, Lenze D, Hartmann S, et al. Different biological risk factors in young poor-prognosis and elderly patients with diffuse large B-cell lymphoma. Leukemia. 2015.
44. Meyer PN, Fu K, Greiner TC, Smith LM, Delabie J, Gascoyne RD, Ott G, Rosenwald A, Braziel RM, Campo E, Vose JM, Lenz G, Staudt LM, et al. Immunohistochemical methods for predicting cell of origin and survival in patients with diffuse large B-cell lymphoma treated with rituximab. J Clin Oncol. 2011; 29(2):200-207.
45. Choi WW, Weisenburger DD, Greiner TC, Piris MA, Banham AH, Delabie J, Braziel RM, Geng H, Iqbal J, Lenz G, Vose JM, Hans CP, Fu K, et al. A new immunostain algorithm classifies diffuse large B-cell lymphoma into molecular subtypes with high accuracy. Clin Cancer Res. 2009; 15(17):5494-5502.
46. Copie-Bergman C, Gaulard P, Leroy K, Briere J, Baia M, Jais JP, Salles GA, Berger F, Haioun C, Tilly H, Emile JF, Banham AH, Mounier N, et al. Immuno-fluorescence in situ hybridization index predicts survival in patients with diffuse large B-cell lymphoma treated with R-CHOP: a GELA study. J Clin Oncol. 2009; 27(33):5573-5579.
47. Thieblemont C, Briere J, Mounier N, Voelker HU, Cuccuini W, Hirchaud E, Rosenwald A, Jack A, Sundstrom C, Cogliatti S, Trougouboff P, Boudova L, Ysebaert L, et al. The germinal center/activated B-cell subclassification has a prognostic impact for response to salvage therapy in relapsed/refractory diffuse large B-cell lymphoma: a bio-CORAL study. J Clin Oncol. 2011; 29(31):4079-4087.
48. Wong KK, Gascoyne DM, Brown PJ, Soilleux EJ, Snell C, Chen H, Lyne L, Lawrie CH, Gascoyne RD, Pedersen LM, Moller MB, Pulford K, Murphy D, et al. Reciprocal expression of the endocytic protein HIP1R and its repressor FOXP1 predicts outcome in R-CHOP-treated diffuse large B-cell lymphoma patients. Leukemia. 2014; 28(2):362-372.
49. Dekker JD, Park D, Shaffer AL, 3rd, Kohlhammer H, Deng W, Lee BK, Ippolito GC, Georgiou G, Iyer VR, Staudt LM and Tucker HO. Subtype-specific addiction of the activated B-cell subset of diffuse large B-cell lymphoma to FOXP1. Proc Natl Acad Sci U S A. 2016; 113(5):E577-586.
50. Winter JN, Li S, Aurora V, Variakojis D, Nelson B, Krajewska M, Zhang L, Habermann TM, Fisher RI, Macon WR, Chhanabhai M, Felgar RE, Hsi ED, et al. Expression of p21 protein predicts clinical outcome in DLBCL patients older than 60 years treated with R-CHOP but not CHOP: a prospective ECOG and Southwest Oncology Group correlative study on E4494. Clin Cancer Res. 2010; 16(8):2435-2442.
51. van Keimpema M, Gruneberg LJ, Mokry M, van Boxtel R, Koster J, Coffer PJ, Pals ST and Spaargaren M. FOXP1 directly represses transcription of proapoptotic genes and cooperates with NF-kappaB to promote survival of human B cells. Blood. 2014; 124(23):3431-3440.
52. Weniger MA, Gesk S, Ehrlich S, Martin-Subero JI, Dyer MJ, Siebert R, Moller P and Barth TF. Gains of REL in primary mediastinal B-cell lymphoma coincide with nuclear accumulation of REL protein. Genes Chromosomes Cancer. 2007; 46(4):406-415.