
INTRODUCTION
With increasing incidence and mortality, cancer has become a leading cause of death and major public health problem all over the world. It is reported that a total of 1,658,370 new cancer cases and 589,430 cancer deaths are projected to occur in the United States in 2015 [1]. Another investigation from China reports that an estimated 4,292,000 new cancer cases and 2,814,000 cancer deaths would occur in China in 2015 [2]. Medical studies suggest that understanding the molecular mechanism of tumors is very critical for improving the diagnosis and treatment. Especially, the level of some certain protein expression is associated with the prognosis and treatment of malignant tumors [3]. Therefore, it is very common and urgent medical problem to disclose new gene and protein expression level and molecular mechanism.
Stathmin (also known as Op18, p18, p19, stathmin 1 or metablastin), is upregulated in a variety of cancers and correlates with cell proliferation and migration of cancers, especially in malignant solid tumors [4, 5]. The main function of stathmin seems to be a major cytosolic phosphoprotein that regulates microtubule dynamics by preventing tubulin polymerization and promoting microtubule destabilization [6]. Recent studies support a role for stathmin in the growth regulation of malignant tumor cells and indicate it is involved in malignant biological behavior of cancers [4, 7–13]. Thus, stathmin may be an attractive molecular biomarker and target for the diagnosis and treatment of malignant tumors. We aimed to review the evidence in the literature to date in order to (1) disclose the expression patterns of stathmin in malignant tumors, (2) clarify the relationship between stathmin expression and malignant tumors, and (3) evaluate the clinical value of stathmin in diagnosing and monitoring of malignant tumors.
RESULTS
Searching process of literature
At first, a total of 438 studies regarding stathmin expression and malignant tumors were noted from the electronic bibliographic databases. Among these studies, 126 studies seemed to be eligible, and the other 15 reports were added from the bibliographies of some articles. Of these 141 articles, we had to exclude 37 studies because of some following reasons including unclear data, duplication of data, non-human studies; and confused statistics analysis. For the rest of the 31 studies, we removed six studies finally because the low quality of methodology. Ultimately, 25 studies were included with a total of 3,571 individuals. A flow chart showing the selection of references for meta-analysis is shown in Figure 1.
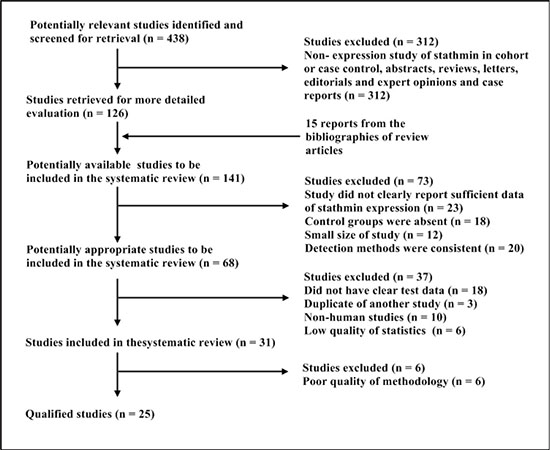
Figure 1: Selection of studies for review. Studies were retrieved from the electronic bibliographic databases such as PubMed, Embase, Cochrane Library and SCI database.
Table 1: Individual characteristics and results of eligible studies
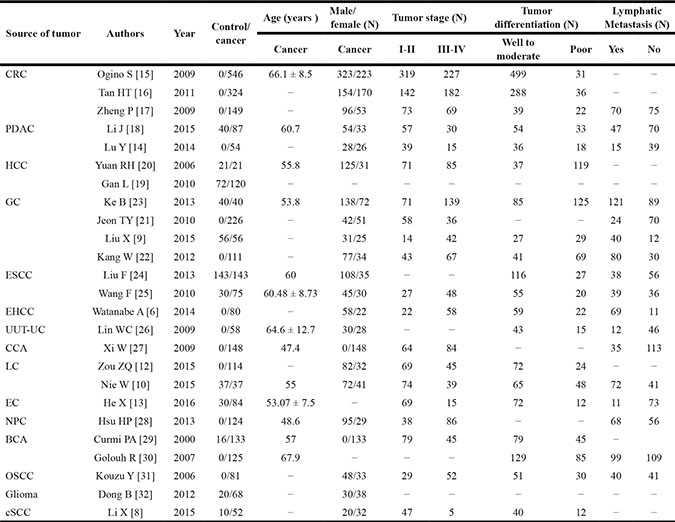
N, cases; CRC, colorectal cancer; PDAC, pancreatic ductal adenocarcinoma; HCC, hepatocellular carcinoma; GC, gastric cancer; ESCC, esophageal squamous cell carcinoma; EHCC, extrahepatic cholangiocarcinoma; UUT-UC, upper urinary tract urothelial carcinoma; CCA, cervical carcinoma; LC, lung cancer EC, endometrial carcinoma; NPC, nasopharyngeal carcinoma; BCA, breast carcinoma; OSCC, oral squamous-cell carcinoma; cSCC, cutaneous squamous cell carcinoma.
Table 2: Methodology and quality of inclined studies
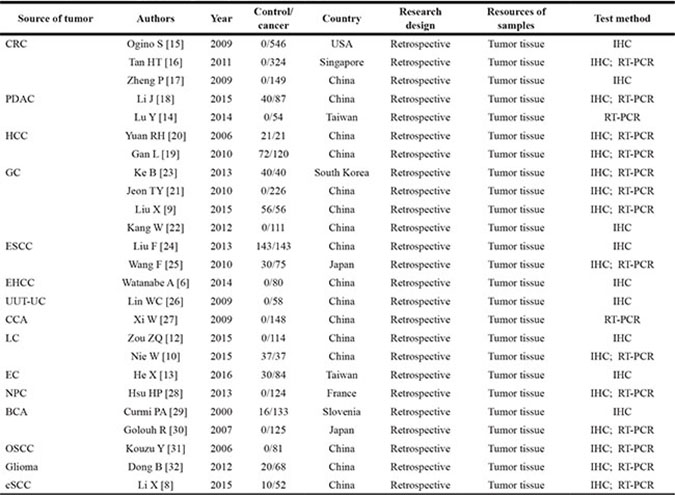
CRC, colorectal cancer; PDAC, pancreatic ductal adenocarcinoma; HCC, hepatocellular carcinoma; GC, gastric cancer; ESCC, esophageal squamous cell carcinoma; EHCC, extrahepatic cholangiocarcinoma; UUT-UC, upper urinary tract urothelial carcinoma; CCA, cervical carcinoma; LC, lung cancer EC, endometrial carcinoma; NPC, nasopharyngeal carcinoma; BCA, breast carcinoma; OSCC, oral squamous-cell carcinoma; cSCC, cutaneous squamous cell carcinoma; QUADAS, quality assessment for studies of diagnostic accuracy (maximum score 14); IHC, immunohistochemistry, RT-PCR, real time polymerase chain reaction.
Description of studies
Table 1 listed the detailed characteristics and results of eligible studies. Of included studies, the sizes of studies ranged from 54 [14] to 323 [15] patients. The source of the malignant tumor included colorectal cancer (CRC) [15–17], pancreatic ductal adenocarcinoma (PDAC) [14, 18], hepatocellular carcinoma (HCC) [19, 20], gastric cancer (GC) [9, 21–23], esophageal carcinoma (ESCC) [24, 25], extrahepatic cholangiocarcinoma (EHCC) [6], upper urinary tract urothelial carcinoma (UUT-UC) [26], cervical carcinomas (CCA) [27], lung cancer (LC) [10, 12], endometrial carcinoma (EC) [13], nasopharyngeal carcinoma (NPC) [28], breast carcinoma (BCA) [29, 30], oral squamous-cell carcinoma (OSCC) [31], glioma [32], and cutaneous squamous cell carcinoma (CSCC) [8]. In these studies, most of investigations were in East Asia, including China, Japan, Singapore and Taiwan. Two Europe studies were in Slovenia [30] and France [29], and one study was in America [15] (Table 2).
Heterogeneity assessment of studies
The analysis of fixed effects model showed the value of Chi-square was 17.21 with 24 degree of freedom (P = 0.08), and the I-square value was 45.6, which indicated that there was no heterogeneity between the studies. Through reviewing the current literature, we also found that there was a very good clinical homogeneity. In the premise of homogeneity, we used fixed models to combine all indices.
Comparison of stathmin expression between cancer and normal tissues
Eleven studies showed the detailed data pertaining to the expressions of stathmin in cancer and normal tissues with control design [8–10, 13, 18–20, 23–25, 32], which included 783 cancer cases and 496 normal controls (Table 3). As shown in Figure 2A, the overall odds ratio (OR) was 0.31 (95% CI = 0.25–0.39) via a fixed model analysis (Z = 9.70, p < 0.001), suggesting that expression of stathmin was remarkably higher in cancer tissues than in normal tissues.
Table 3: Data extract of stathmin expression in control and cancer patients
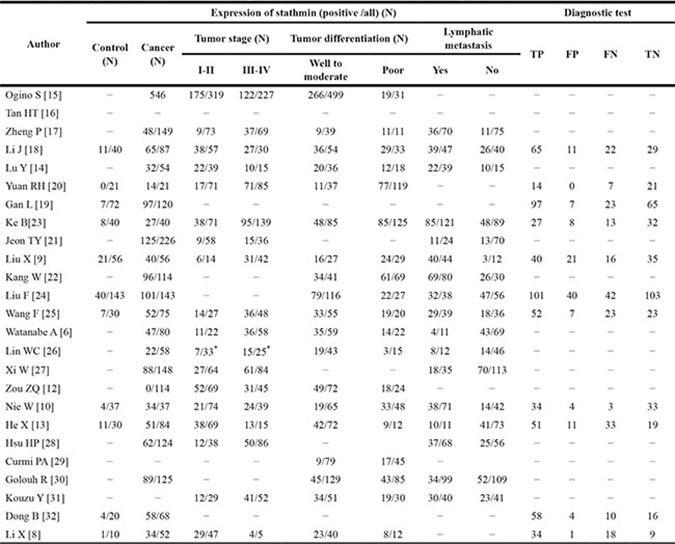
N, cases; TP, true positive; LAC, lung adenocarcinoma; LSCC, lung squamous cell carcinoma; SCLC, small cell lung cancer; FP, false positive; FN, false negative; TN, true negative; *, pT stage.
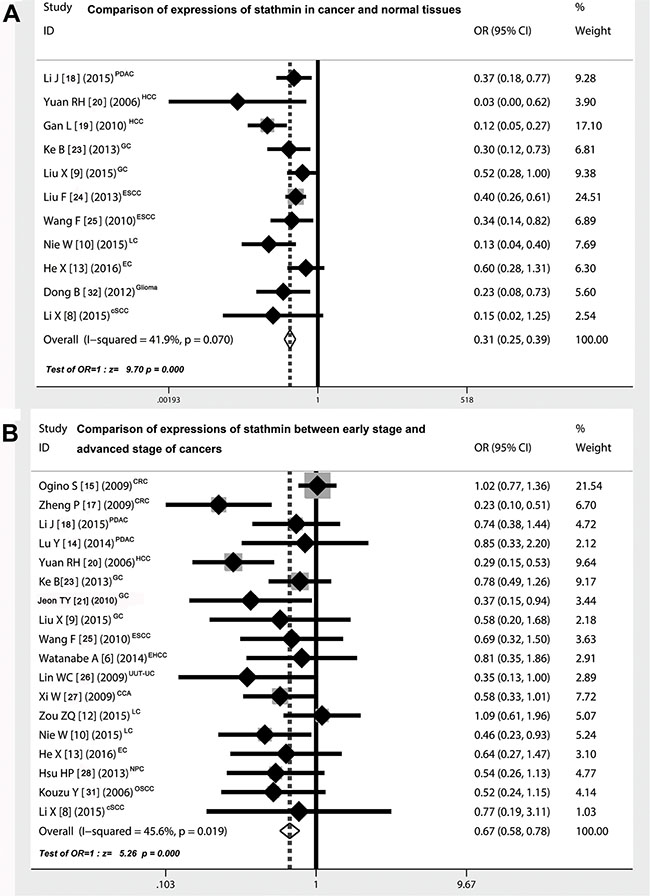
Figure 2: Comparison of expressions of stathmin in cancer and normal tissues. (A) the overall OR for the combined expressions of stathmin in cancer tissues versus normal tissues was 0.31 (95% CI = 0.25–0.39) in a fixed model (Z = 9.70, p < 0.001), suggesting that expression of stathmin was remarkably higher in cancer tissues than in normal tissues; (B) the overall OR for the combined expressions of stathmin in early stage versus advanced stage was 0.67 (95% CI = 0.58–0.78) in a random model (Z = 5.26, p < 0.001), suggesting that expression of stathmin was significantly higher in advanced stage of cancer patients than in those of early stage; OR, odds ratio; CRC, colorectal cancer; PDAC, pancreatic ductal adenocarcinoma; HCC, hepatocellular carcinoma; GC, gastric cancer; ESCC, esophageal squamous cell carcinoma; EHCC, extrahepatic cholangiocarcinoma; UUT-UC, upper urinary tract urothelial carcinoma; CCA, cervical carcinoma; LC, lung cancer EC, endometrial carcinoma; NPC, nasopharyngeal carcinoma; OSCC, oral squamous-cell carcinoma; cSCC, cutaneous squamous cell carcinoma.
Comparison of stathmin expression between early and advanced stage of cancers
Eighteen studies [6, 8–10, 12–15, 17, 18, 20, 21, 23, 25–28, 31] showed the detailed data pertaining to the expressions of stathmin in different clinical stages of cancers. Patients with cancer were divided into two groups according to the tumor-node-metastasis (TNM) classification: I-II stage (early stage) versus III-IV stage (advanced stage), including 1174 cancer cases of early stage and 1100 cases of advanced stage (Table 3). As shown in Figure 2B, the overall OR was 0.67 (95% CI = 0.58–0.78) via a random model analysis (Z = 5.26, p < 0.001), suggesting that expression of stathmin was remarkably higher in patients with advanced stage than in those of early stage.
Comparison of stathmin expression between different differentiated degree of cancer tissues
As shown in Figure 3A, nineteen studies [6, 8–10, 12–15, 17, 18, 20, 21, 23, 25–28, 31] showed the detailed data pertaining to the expressions of stathmin in different differentiated degree of cancer tissues (well and moderate versus poor differentiated cancer tissues), including 1599 cancer cases of well and moderate differentiation and 775 cases of poor differentiation (Table 3). The overall OR was 0.73 (95% CI = 0.62–0.86) (Z = 3.83, p < 0.0001), showing that expression of stathmin was significantly higher in poor differentiated cancer tissues than in those of well and moderate differentiated tissues.
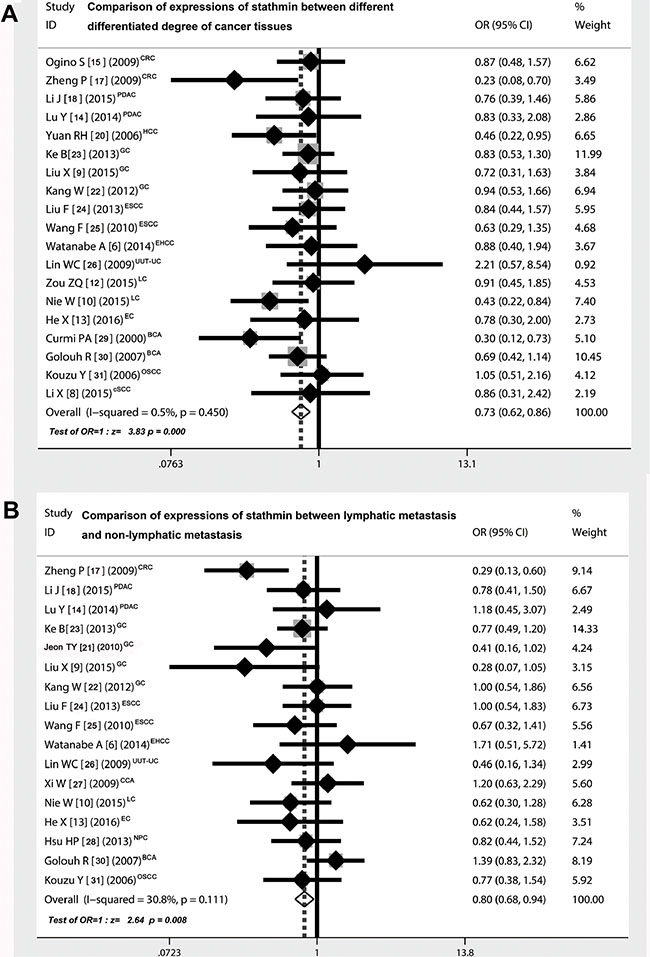
Figure 3: Correlation of expressions of stathmin and different clinical characteristics. (A) the overall OR for the combined expressions of stathmin in early stage versus advanced stage was 0.73 (95% CI = 0.62–0.86) (Z = 3.83, p < 0.001), suggesting that expression of stathmin was remarkably higher in poor differentiated cancer tissues than in well and moderate differentiated cancer tissues; (B) the overall OR for the combined expressions of stathmin in lymphatic metastasis versus non-lymphatic metastasis was 0.80 (95% CI = 0.68–0.94) (Z = 2.64, p= 0.008), suggesting that expression of stathmin was remarkably higher in cancer tissues with lymphatic metastasis than those in without lymphatic metastasis; OR, odds ratio; CRC, colorectal cancer; PDAC, pancreatic ductal adenocarcinoma; HCC, hepatocellular carcinoma; GC, gastric cancer; ESCC, esophageal squamous cell carcinoma; EHCC, extrahepatic cholangiocarcinoma; UUT-UC, upper urinary tract urothelial carcinoma; CCA, cervical carcinoma; LC, lung cancer EC, endometrial carcinoma; NPC, nasopharyngeal carcinoma; BCA, breast carcinoma; OSCC, oral squamous-cell carcinoma; cSCC, cutaneous squamous cell carcinoma.
Comparison of stathmin expression between lymphatic metastasis and non-lymphatic metastasis
As shown in Figure 3B, seventeen studies [6, 9, 10, 13, 14, 17, 18, 21–28, 30, 31] showed the detailed data pertaining to the expressions of stathmin in different status of lymphatic metastasis, including 850 cancer cases of lymphatic metastasis and 972 cases of non-lymphatic metastasis (Table 3). The overall OR was 0.80 (95% CI = 0.68–0.94) (Z = 2.64, p = 0.008), suggesting that expression of stathmin was markedly higher in cancer cases with lymphatic metastasis than in those without lymphatic metastasis.
Analysis of correlation between overexpression of stathmin and overall survival of cancer patients
Four studies reported the correlation between overexpression of stathmin and overall survival of cancer patients [16, 18, 21, 23]. The results showed that patients who exhibited high expressions of stathmin had a significantly shorter post-surgical survival time (27.93 ± 11.54 months) compared with patients who exhibited moderate and low expressions of stathmin (44.81 ± 15.82 months). The t-value was 5.687 and the degree of freedom was three (P = 0.01).
Quality assessment of studies
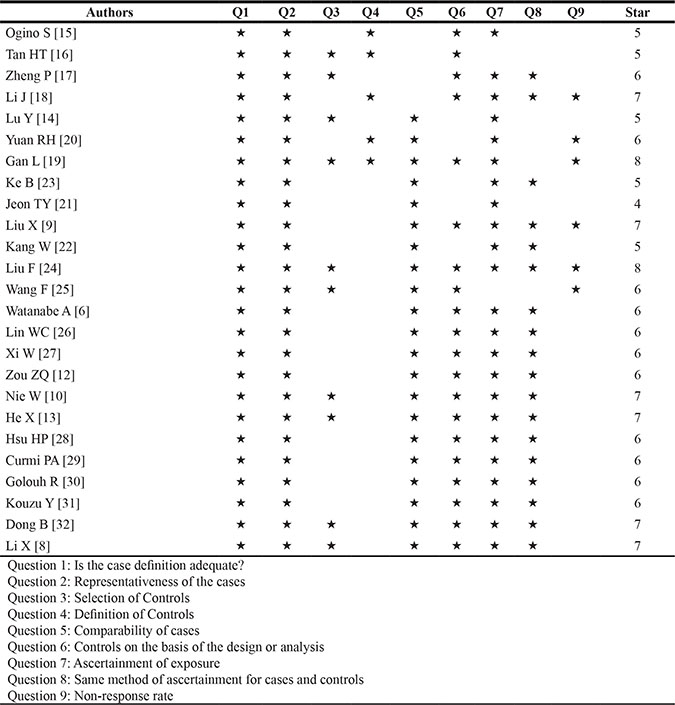
Table 2 showed the principal characteristics on study quality of the 25 studies. All studies were retrospective and all adopted the cancer tissues to detect the expression of stathmin. As shown in Table 4, most of 25 studies had added up to more than 6 stars of scores in evaluating with Newcastle-Ottawa Scale (NOS), which suggested that higher quality studies rigorously controlled for potential confounders [8, 20, 32] and did better with respect to selection of cases and controls [9, 10, 13, 18, 19, 23, 24]. Eleven studies showed the detailed data pertaining to the expressions of stathmin for diagnosis of malignant tumors. Figure 4A and 4B showed summary of methodological quality of included studies according the four best differentiating items from quality assessment of studies of diagnostic accuracy (QUADAS) checklist. Most of studies were evaluated as low risk, and high risk only accounted for less than 10%.
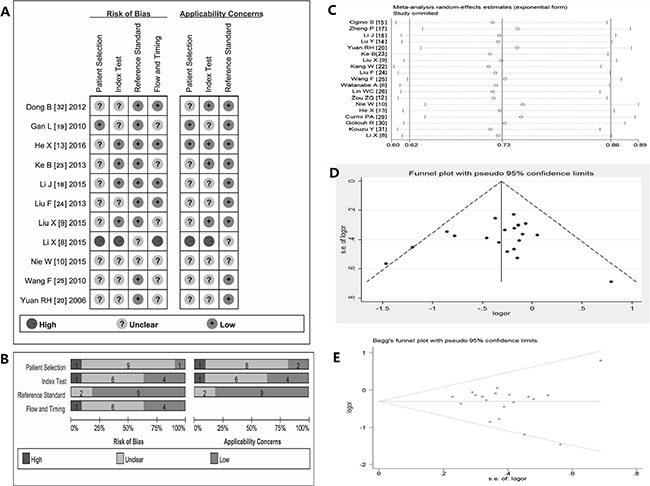
Figure 4: Summary of methodological quality, sensitivity analysis and assessment of publication bias. (A–B) summary on basis of review authors’ judgments on seven best differentiating items from QUADAS checklist for each study; (C) the exclusion of studies individually did not substantially modify the estimators, with OR values varying between 0.23 and 2.21; (D) the shape of the funnel in the funnel plot analysis of publication biases appeared to be approximately symmetrical; (E) Begg’s test indicated publication biases did not have a significant influence on the results (SD = 28.58, and p = 0.421); OR, odds ratio; QUADAS, quality assessment of studies of diagnostic accuracy.
Table 4: Assessing the quality of included studies using the Newcastle–Ottawa Scale (NOS)
Sensitivity analysis and assessment of publication bias
Sensitivity analysis was performed by omitting each study from the estimated pool at every step, the exclusion of any one study individually did not substantially modify the estimators, with OR values vacillating between 0.23 and 2.21 (Figure 4C) [33]. The shape of the funnel appeared to be approximately symmetrical (Figure 4D). In addition, Begg’s test indicated the Std. Dev. of Score was 28.58 and Pr > |z| = 0.421. (Figure 4E). Therefore, the funnel plot and Begg test all suggested that publication biases did not have a significant influence on the results [33].
Sensitivity and specificity of stathmin expression in tumor tissues for the diagnosis of cancers
In order to assess the pooled diagnostic value based on the sensitivity and specificity of stathmin test in tissues for the diagnosis of cancers, we made the forest plots of sensitivity (true positive rate) and 1−specificity (false positive rate) for the 11 research reports [8–10, 13, 18–20, 23–25, 32]. The sensitivity of stathmin in tissues for the diagnosis of cancer was 0.73 (0.70 to 0.76) (Figure 5A) and specificity 0.77 (0.73 to 0.81) (Figure 5B), and the positive likelihood ratio (PLR) was 3.31 (2.35 to 4.66) (Figure 5C) and the negative likelihood ratio (NLR) was 0.35 (0.28 to 0.44) (Figure 5D).
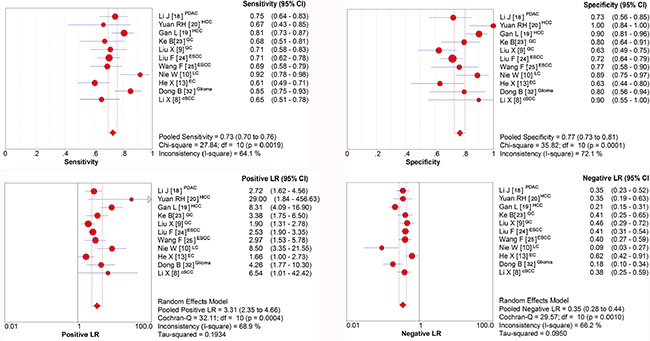
Figure 5: Sensitivity and specificity of stathmin in tissues for the diagnosis of cancer. (A) sensitivity of stathmin in tissues for the diagnosis of cancer was 0.73 (0.70 to 0.76); (B) sensitivity of stathmin in tissues for the diagnosis of cancer was 0.77 (0.73 to 0.81); (C) positive likelihood ratio (PLR) was 3.31 (2.35 to 4.66); (D) negative likelihood ratio (NLR) was 0.35 (0.28 to 0.44); PDAC, pancreatic ductal adenocarcinoma; HCC, hepatocellular carcinoma; GC, gastric cancer; ESCC, esophageal squamous cell carcinoma; LC, lung cancer EC, endometrial carcinoma; cSCC, cutaneous squamous cell carcinoma.
Diagnostic accuracy of stathmin test in tissues for the diagnosis of cancers
In our present meta-analysis, the mean diagnostic odds ratio (DOR) was 10.92, indicating that stathmin assay in cancer tissues could be helpful in the diagnosis of malignant tumors (Figure 6A). The summary receiver-operator characteristic (SROC) curve help negotiate the balance between sensitivity and specificity of a concrete index in differentiating concrete disease [34]. In our analysis, the maximum balance joint for sensitivity and specificity (the Q-value) was 0.7566. The area under the curve (AUC) was 0.8234 (Figure 6B).
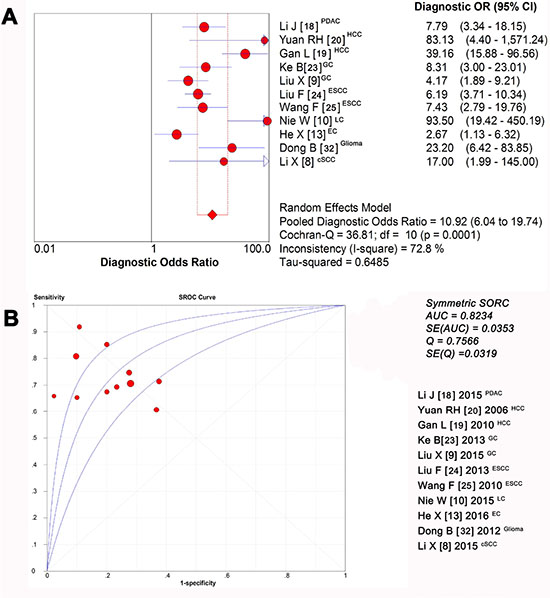
Figure 6: Diagnostic accuracy of stathmin in tissues for the diagnosis of cancer. (A) the mean DOR was 10.92, indicating that stathmin assay in cancer tissues could be helpful in the diagnosis of malignant tumors; (B) the maximum balance joint for sensitivity and specificity was 0.7566 and area under the curve (AUC) was 0.8234; DOR, diagnostic odds ratio; PDAC, pancreatic ductal adenocarcinoma; HCC, hepatocellular carcinoma; GC, gastric cancer; ESCC, esophageal squamous cell carcinoma; LC, lung cancer EC, endometrial carcinoma; cSCC, cutaneous squamous cell carcinoma.
DISCUSSION
Although stathmin is usually over-expressed in many human cancers, and intimately correlates with the development and progression of malignant tumors [4–11, 13–29, 31, 32]; up to now, we still know relatively little about the role of stathmin in malignant tumors. However, reports on the relationship between abnormal protein expression and cancers, as known, are becoming numerous. The identification of tumor marker has been proposed as a useful strategy to help deeply understanding of human tumorigenesis [33]. In present study, we disclosed the internal connection between abnormal expression of stathmin and malignant tumors and assessed the clinical value of stathmin for discerning malignant tumors.
We used the QUADAS-2 tool to assess included studies, which specially used for evaluating the quality of non-randomized control studies [35]. In addition, Newcastle-Ottawa Scale (NOS) is also a validated technique for assessing the quality of observational and non-randomized studies, which is considered an internationally recognised standard [36]. We employed these two tools to perform the evaluation of study quality and found most of included studies were low risk, suggesting that the conclusion from those studies were reliable and stable. Identifying heterogeneity is important to systematic reviews [37], in our study, we found included studies had a very good clinical homogeneity and statistical analysis showed that the heterogeneity was acceptable. In analysis of sensitivity, we found that the exclusion of any one study did not shake the overall conclusion. In assessment of publication biases, the shape of the funnel plot and Begg’s test did not show the statistical significance on publication biases.
In our study, eleven studies compared the expressions of stathmin in cancer with normal tissues [8–10, 13, 18–20, 23–25, 32] and the results suggested that cancer tissues displayed a higher expression of stathmin than normal tissues. Thus, we may infer that higher stathmin expression plays a potentially role in the occurrence and development of cancer. Subsequently, we performed a series of subgroup analysis and found that stathmin displayed a higher expression in advanced cancers, poor differentiated cancers and cancers with lymphatic metastasis, which implied that stathmin intimately involved in tumor cell differentiation, proliferation and invasion of tumors. Metastasis and invasion are the critical factors in the progression of cancer, stathmin has been reported intimately correlating with malignant behavior of tumors [5, 8, 9, 22, 38–41] and affect the survival of tumor patients. In our study, we noticed that patients who exhibited high expressions of stathmin had a significantly shorter post-surgical survival time (27.93 ± 11.54 months) compared with patients who exhibited moderate and low expressions of stathmin (44.81 ± 15.82 months). This phenomena strongly indicated that stathmin may have a potential to become prognostic index for predicting the survival rate of patients with cancer.
In meta-analysis of diagnostic accuracy, we found that the overexpression of stathmin had impressive sensitivity (0.73, 0.70 to 0.76) and specificity (0.77, 0.73 to 0.81) when discriminating the cancer from normal cases, which meant stathmin had a potential to discern cancers. The positive likelihood ratio (PLR) of 3.31 (2.35 to 4.66) suggested that patients with cancer have a nearly 3.31-fold higher chance of being stathmin test positive compared with patients without cancer. This ratio suggested a potential role for stathmin in discerning malignant tumors. Similarly, the negative likelihood ratio (NLR) of 0.35 (0.28 to 0.44) also indicated that low expression of stathmin may help exclude non-cancer individuals. Theoretically, the value of a DOR ranges from zero to infinity, with higher values indicating better discriminatory test performance (higher accuracy) [42]. In our meta-analysis, the value of DOR was 10.92, indicating that the detection of stathmin could be useful to distinguish malignant tumors. The summary measure of test characteristics derived from the SROC curve where sensitivity equalled specificity was 82%, which suggested that the test performance of stathmin in discerning cancer tissues is reasonably good, and it would be a useful tool for the judgement of malignant tumors.
So far, we still know relatively little about how the stathmin regulates tumor proliferation, motility, migration and occurence of metastasis at the molecular level. However, the abnormal expression of stathmin in human tumors has provided a clear possibility for the development of stathmin-dependent molecular diagnosis and targeting therapy. However, we also found some limitations. First, the bias from different tumors may exist because stathmin is highly expressed in many kinds of human cancers. Second, diagnostic review bias may occur because stathmin itself may affect the determination of diagnosis in reports using the clinical course as the gold standard [43]. In the future, it is very crucial to investigate stathmin expression in cases with large samples and multiple clinical centers. Although some deficiencies existed in the studies reviewed, they still provided credible evidence that the stathmin plays an important role in malignant tumors and its detection may be useful for the diagnosis of malignant tumors. In summary, overexpression of stathmin involved in tumor differentiation, lymph node invasion and high TNM stage, suggesting that high expression of stathmin play an important role in malignant tumors. Stathmin had a relatively good sensitivity and specificity suggests that it should be a molecular biomarker for the diagnosis and target for therapy of malignant tumors.
MATERIALS AND METHODS
Searching of literature
We searched the published literature from the databases of PubMed, Embase, Cochrane Library and SCI database (from the start of each database up to May 2016). We used the following free text and Medical Subject Heading terms such as “cancer,” “tumor,” “carcinoma,” “tumors,” “neoplasms,” “malignant neoplasms,” “malignant tumors,” “Op18,” “p18,” “p19,” “stathmin 1,” “stathmin”, “metablastin”, “expression,” and “diagnosis.” We also performed hand searches from the references of the articles. If necessary, we contacted with the authors of articles by e-mail for detailed information.
Inclusion and exclusion criteria of literature
The exclusion criteria: (1) must have showed the data on stathmin expression in malignant tumors; (2) must be case-control or cohort association studies; (3) must have clearly described the control; and (4) the number of cases must be greater than or equal to 50. The exclusion criteria: (1) not original articles such as abstracts, letters, editorials and expert opinions and case reports; (2) did not clearly report sufficient data of stathmin expression; (3) patients who were involved in studies had received chemotherapy, radiotherapy and other drug treatment before taking samples; (4) control group was absent; and (5) non-human studies.
Extraction procedure of key data from literature
Two researchers extracted the useful data independently. They checked the validity of original data, and contacted the authors of articles if it was necessary. When stathmin expression was tested by different measures in one study, we adopted the results from acknowledged and common measurement. If the paper showed stratum data, we collected all strata data to utilize as full as possible. If two abstracters have disputes on some data, the third abstracter would check the data again, and finally reached consensus through discussion.
Data of extraction
General information included: authors, countries, publication date, gender and age of patients, type of tumors, testing method of stathmin and study design. Critical data included: case number of different groups, histological classification, tumor node metastases (TNM) classification, tumor differentiation degree, concrete data of stathmin expression (number of true positives, true negatives, false positives, and false negatives).
Quality assessment of studies
We evaluated the quality of primary studies using the Newcastle-Ottawa Scale (NOS), which uses a star system to evaluate observational studies based on three criteria: participant selection, comparability of study groups and assessment of outcome or exposure [44]. We also used the Quality Assessment of Diagnostic Accuracy Studies (QUADAS -2) tool [35] to assess the quality of diagnostic accuracy. The QUADAS -2 tool uses 14 items to assess risk of bias of study, each item is rated “yes,” “no,” or “unclear” [35], and is phrased such that “yes” indicates low risk of bias.
Statistical analysis
We conducted a series of analysis according to the standard methods recommended for a meta-analysis of diagnostic test evaluations [45]. The odds ratios (OR) and their 95% confidence intervals (CI) was calculated directly using two different meta-analysis approaches (fixed-effects model and random effects model) according to heterogeneity. We calculated the Chi-square value and I2 to evaluate heterogeneity between studies. In the absence of statistically significant heterogeneity, we used the fixed effects method to combine the results. If the heterogeneity existed, we used the random effects method. The overall effect was tested using Z-scores, with significance being set at p <0.05. We run sensitivity analysis to evaluate whether single study should affect the overall effects and evaluated publication bias through funnel plots, Begg’s and Egger’s test respectively. If the data were available, we would combine the following variables of test accuracy: sensitivity; specificity; positive likelihood ratio (PLR); negative likelihood ratio (NLR); and diagnostic odds ratio (DOR), which were derived from summary receiver-operator characteristic (SROC) curve. Statistical analyses were performed using SPSS (SPSS Institute, version 22.0, Chicago, USA), RevMan 5.3.3 (Cochrane Collaboration), Meta DiSc statistical software (Version 1.4, Madrid, Spain), and Stata version 14.0 (Stata Corporation, TX, USA). All the tests were two-sided and the significant level was 0.05.
ACKNOWLEDGMENTS AND FUNDING
This study received funding from Technology Research and Development Plan of Gansu Province (0912TCYA016). The authors wish to thank Drs. Pan Hui and Wu Dianlei for their critical comments provided during the preparation of this manuscript and also wish to thank all authors of references.
CONFLICTS OF INTEREST
The authors declare no conflicts of interest.
REFERENCES
1. Siegel RL, Miller KD, Jemal A. Cancer statistics, 2015. CA Cancer J Clin. 2015; 65:5–29.
2. Chen W, Zheng R, Baade PD, Zhang S, Zeng H, Bray F, Jemal A, Yu XQ, He J. Cancer statistics in China, 2015. CA Cancer J Clin. 2016; 66:115–132.
3. Chen G, Jundong GU, Chen J, Liu Y, Song Z. Association between clinical pathology and multiple genes mRNA expression in Chinese patients with NSCLC. J Cancer Res Ther. 2013; 9:S98–100.
4. Ng DCH, Byrne F. Stathmin and Cancer. Cytoskeleton and Human Disease: Springer), pp. 2012; 259–284.
5. Rana S, Maples PB, Senzer N, Nemunaitis J. Stathmin 1: a novel therapeutic target for anticancer activity. Expert Rev Anticancer Ther. 2008; 8:1461–1470.
6. Watanabe A, Suzuki H, Yokobori T, Tsukagoshi M, Altan B, Kubo N, Suzuki S, Araki K, Wada S, Kashiwabara K, Hosouchi Y, Kuwano H. Stathmin1 regulates p27 expression, proliferation and drug resistance, resulting in poor clinical prognosis in cholangiocarcinoma. Cancer Sci. 2014; 105:690–696.
7. Belletti B, Baldassarre G. Stathmin: a protein with many tasks. New biomarker and potential target in cancer. Expert Opin Ther Targets. 2011; 15:1249–1266.
8. Li X, Wang L, Li T, You B, Shan Y, Shi S, Qian L, Cao X. STMN1 overexpression correlates with biological behavior in human cutaneous squamous cell carcinoma. Pathol Res Pract. 2015; 211:816–823.
9. Liu X, Liu H, Liang J, Yin B, Xiao J, Li J, Feng D, Li Y. Stathmin is a potential molecular marker and target for the treatment of gastric cancer. Int J Clin Exp Med. 2015; 8:6502–6509.
10. Nie W, Xu MD, Gan L, Huang H, Xiu Q, Li B. Overexpression of stathmin 1 is a poor prognostic biomarker in non-small cell lung cancer. Lab Invest. 2015; 95:56–64.
11. Sun R, Liu Z, Wang L, Lv W, Liu J, Ding C, Yuan Y, Lei G, Xu C. Overexpression of stathmin is resistant to paclitaxel treatment in patients with non-small cell lung cancer. Tumour Biol. 2015; 36:7195–7204.
12. Zou ZQ, Du YY, Sui G, Xu SN. Expression of TS, RRM1, ERCC1, TUBB3 and STMN1 Genes in Tissues of Non-small Cell Lung Cancer and its Significance in Guiding Postoperative Adjuvant Chemotherapy. Asian Pac J Cancer Prev. 2015; 16:3189–3194.
13. He X, Liao Y, Lu W, Xu G, Tong H, Ke J, Wan X. Elevated STMN1 promotes tumor growth and invasion in endometrial carcinoma. Tumour Biol. 2016.
14. Lu Y, Liu C, Cheng H, Xu Y, Jiang J, Xu J, Long J, Liu L, Yu X. Stathmin, interacting with Nf-kappaB, promotes tumor growth and predicts poor prognosis of pancreatic cancer. Curr Mol Med. 2014; 14:328–339.
15. Ogino S, Nosho K, Baba Y, Kure S, Shima K, Irahara N, Toyoda S, Chen L, Kirkner GJ, Wolpin BM, Chan AT, Giovannucci EL, Fuchs CS. A cohort study of STMN1 expression in colorectal cancer: body mass index and prognosis. Am J Gastroenterol. 2009; 104:2047–2056.
16. Tan HT, Wu W, Ng YZ, Zhang X, Yan B, Ong CW, Tan S, Salto-Tellez M, Hooi SC, Chung MC. Proteomic analysis of colorectal cancer metastasis: stathmin-1 revealed as a player in cancer cell migration and prognostic marker. J Proteome Res. 2012; 11:1433–1445.
17. Zheng P, Liu YX, Chen L, Liu XH, Xiao ZQ, Zhao L, Li GQ, Zhou J, Ding YQ, Li JM. Stathmin, a new target of PRL-3 identified by proteomic methods, plays a key role in progression and metastasis of colorectal cancer. J Proteome Res. 2010; 9:4897–4905.
18. Li J, Hu G, Kong F, Wu K, Song K, He J, Sun W. Elevated STMN1 Expression Correlates with Poor Prognosis in Patients with Pancreatic Ductal Adenocarcinoma. Pathol Oncol Res. 2015; 21:1013–1020.
19. Gan L, Guo K, Li Y, Kang X, Sun L, Shu H, Liu Y. Up-regulated expression of stathmin may be associated with hepatocarcinogenesis. Oncol Rep. 2010; 23:1037–1043.
20. Yuan RH, Jeng YM, Chen HL, Lai PL, Pan HW, Hsieh FJ, Lin CY, Lee PH, Hsu HC. Stathmin overexpression cooperates with p53 mutation and osteopontin overexpression, and is associated with tumour progression, early recurrence, and poor prognosis in hepatocellular carcinoma. J Pathol. 2006; 209:549–558.
21. Jeon TY, Han ME, Lee YW, Lee YS, Kim GH, Song GA, Hur GY, Kim JY, Kim HJ, Yoon S, Baek SY, Kim BS, Kim JB, et al. Overexpression of stathmin1 in the diffuse type of gastric cancer and its roles in proliferation and migration of gastric cancer cells. Br J Cancer. 2010; 102:710–718.
22. Kang W, Tong JH, Chan AW, Lung RW, Chau SL, Wong QW, Wong N, Yu J, Cheng AS, To KF. Stathmin1 plays oncogenic role and is a target of microRNA-223 in gastric cancer. PLoS One. 2012; 7:e33919.
23. Ke B, Wu LL, Liu N, Zhang RP, Wang CL, Liang H. Overexpression of stathmin 1 is associated with poor prognosis of patients with gastric cancer. Tumour Biol. 2013; 34:3137–3145.
24. Liu F, Sun YL, Xu Y, Wang LS, Zhao XH. Expression and phosphorylation of stathmin correlate with cell migration in esophageal squamous cell carcinoma. Oncol Rep. 2013; 29:419–424.
25. Wang F, Wang LX, He W, Zhu LN, Zhao PR, Fan QX. Expression of stathmin in esophageal squamous cell carcinoma and its biological significance. Nan Fang Yi Ke Da Xue Xue Bao. 2010; 30:1552–1557.
26. Lin WC, Chen SC, Hu FC, Chueh SC, Pu YS, Yu HJ, Huang KH. Expression of stathmin in localized upper urinary tract urothelial carcinoma: correlations with prognosis. Urology. 2009; 74:1264–1269.
27. Xi W, Rui W, Fang L, Ke D, Ping G, Hui-Zhong Z. Expression of stathmin/op18 as a significant prognostic factor for cervical carcinoma patients. J Cancer Res Clin Oncol. 2009; 135:837–846.
28. Hsu HP, Li CF, Lee SW, Wu WR, Chen TJ, Chang KY, Liang SS, Tsai CJ, Shiue YL. Overexpression of stathmin 1 confers an independent prognostic indicator in nasopharyngeal carcinoma. Tumour Biol. 2014; 35:2619–2629.
29. Curmi PA, Nogues C, Lachkar S, Carelle N, Gonthier MP, Sobel A, Lidereau R, Bieche I. Overexpression of stathmin in breast carcinomas points out to highly proliferative tumours. Br J Cancer. 2000; 82:142–150.
30. Golouh R, Cufer T, Sadikov A, Nussdorfer P, Usher PA, Brunner N, Schmitt M, Lesche R, Maier S, Timmermans M, Foekens JA, Martens JW. The prognostic value of Stathmin-1, S100A2, and SYK proteins in ER-positive primary breast cancer patients treated with adjuvant tamoxifen monotherapy: an immunohistochemical study. Breast Cancer Res Treat. 2008; 110:317–326.
31. Kouzu Y, Uzawa K, Koike H, Saito K, Nakashima D, Higo M, Endo Y, Kasamatsu A, Shiiba M, Bukawa H, Yokoe H, Tanzawa H. Overexpression of stathmin in oral squamous-cell carcinoma: correlation with tumour progression and poor prognosis. Br J Cancer. 2006; 94:717–723.
32. Dong B, Mu L, Qin X, Qiao W, Liu X, Yang L, Xue L, Rainov NG. Stathmin expression in glioma-derived microvascular endothelial cells: a novel therapeutic target. Oncol Rep. 2012; 27:714–718.
33. Biaoxue R, Shuanying Y, Xiguang C, Wei Z, Wei L. Differential diagnostic CYFRA 21–1 level for benign and malignant pleural effusions: a meta-analysis in the Chinese population. Arch Med Sci 2012; 8:756–766.
34. Wu Q, Li M, Zhang S, Chen L, Gu X, Xu F. Clinical diagnostic utility of CA 15–3 for the diagnosis of malignant pleural effusion: A meta-analysis. Exp Ther Med. 2015; 9:232–238.
35. Whiting PF, Rutjes AW, Westwood ME, Mallett S, Deeks JJ, Reitsma JB, Leeflang MM, Sterne JA, Bossuyt PM. QUADAS-2: a revised tool for the quality assessment of diagnostic accuracy studies. Ann Intern Med. 2011; 155:529–536.
36. Stang A. Critical evaluation of the Newcastle-Ottawa scale for the assessment of the quality of nonrandomized studies in meta-analyses. Eur J Epidemiol. 2010; 25:603–605.
37. Rong B, Zhao C, Gao W, Yang S. Matrine promotes the efficacy and safety of platinum-based doublet chemotherapy for advanced non-small cell lung cancer. Int J Clin Exp Med. 2015; 8:14701–14717.
38. Hsieh SY, Huang SF, Yu MC, Yeh TS, Chen TC, Lin YJ, Chang CJ, Sung CM, Lee YL, Hsu CY. Stathmin1 overexpression associated with polyploidy, tumor-cell invasion, early recurrence, and poor prognosis in human hepatoma. Mol Carcinog. 2010; 49:476–487.
39. Howitt BE, Nucci MR, Drapkin R, Crum CP, Hirsch MS. Stathmin-1 expression as a complement to p16 helps identify high-grade cervical intraepithelial neoplasia with increased specificity. Am J Surg Pathol. 2013; 37:89–97.
40. Nemunaitis J. Stathmin 1: a protein with many tasks. New biomarker and potential target in cancer. Expert Opin Ther Targets. 2012; 16:631–634.
41. Wang F, Xuan XY, Yang X, Cao L, Pang LN, Zhou R, Fan QX, Wang LX. Stathmin is a marker of progression and poor prognosis in esophageal carcinoma. Asian Pac J Cancer Prev. 2014; 15:3613–3618.
42. Shi HZ, Liang QL, Jiang J, Qin XJ, Yang HB. Diagnostic value of carcinoembryonic antigen in malignant pleural effusion: a meta-analysis. Respirology. 2008; 13:518–527.
43. Goto M, Noguchi Y, Koyama H, Hira K, Shimbo T, Fukui T. Diagnostic value of adenosine deaminase in tuberculous pleural effusion: a meta-analysis. Ann Clin Biochem. 2003; 40:374–381.
44. Nnoaham KE, Clarke A. Low serum vitamin D levels and tuberculosis: a systematic review and meta-analysis. Int J Epidemiol. 2008; 37:113–119.
45. Deville WL, Buntinx F, Bouter LM, Montori VM, de Vet HC, van der Windt DA, Bezemer PD. Conducting systematic reviews of diagnostic studies: didactic guidelines. BMC Med Res Methodol. 2002; 2:9.