
INTRODUCTION
Acute myeloid leukemia (AML) is a genetically and clinically heterogeneous disease driven by a subpopulation of leukemia stem cells (LSCs) with self-renewal properties that generate the bulk of leukemia cells [1–3]. LSCs originate from hematopoietic stem cells (HSCs) or more lineage-restricted progenitors, which have become leukemic due to accumulated mutations [4, 5]. Like their HSC counterparts, LSCs are at the top of the hierarchical organization of AML [6]. However, LSCs can resist available treatments and thus act as barriers to cure, leading to the progression and relapse of AML following chemotherapy [7]. The high number of LSCs or expression of an LSC related gene signature is independently associated with poor prognosis in AML, supporting the notion for LSCs as important targets for therapeutic intervention [1, 8, 9].
Epigenetic modifications such as DNA methylation, histone modifications and microRNAs (miRNAs), contribute significantly to the initiation, progression and/or prognosis of leukemia [8]. MiRNAs are a family of 21-25-nucleotide small RNAs that negatively regulate gene expression at the post-transcriptional level [10]. These small non-protein-coding RNAs are critical regulators of many physiological processes such as cell proliferation, apoptosis and differentiation [11]. Emerging evidence suggests that dysregulated expression of miRNAs significantly involved in various cancers [12, 13] including leukemia [14, 15]. As an example, miR-17-92 polycistron is particularly overexpressed in AML bearing mixed lineage leukemia (MLL) gene rearrangements and maintains LSC self-renewal [16, 17]. Overexpression of miR-155 initiates expansion of preleukemic pre-B cells, leading to the development of frank B cell malignancy in a transgenic mouse model [18]. Thus, miRNAs have begun to garner attention as potential targets for the treatment of leukemia.
In this study, relapse-related miRNA expression signature was firstly analyzed by miRNA array in enriched CD34+ LSCs obtained from paired bone marrow (BM) samples from an AML patient at initial diagnosis and relapse, and miR-99a was the most significantly upregulated miRNA in LSCs at relapse stage compared to the initial diagnosis. We also observed that miR-99a was highly amplified in LSCs compared to non-LSCs in a cohort of 18 AML patients, and the high expression levels of miR-99a were associated with the poor prognosis of patients with AML. These results point to the importance of a novel role of miR-99a in LSC activity and disease prognosis.
RESULTS
Upregulation of miR-99a in LSCs was associated with poor prognosis of AML
LSCs were initially thought to reside in the CD34+CD38− cell population [19, 20]. However, with improved xenotransplantation model, LSCs were also detected in the CD34+CD38+ cell fraction of some subjects previously thought to be non-LSCs [1, 7]. In this study, LSCs and non-LSCs were distinguished from leukemic blast cells by flow cytometry based on the surface expression of CD34. LSCs from paired BM of an AML patient at diagnosis and relapse were enriched as SSClowCD45dimCD34+ (Figure 1A), and then validated for the characteristic feature of the LSCs by an in vivo xenotransplantation assay (Figure S1A-S1B). The paired LSCs were subsequently used for miRNA array analysis. MiRNA array analysis revealed that a series of miRNAs were upregulated in the LSCs obtained at relapse compared to the LSCs collected at the time of initial diagnosis, and quantitative real-time PCR (qPCR) assays revealed that miR-99a was the most significantly differential miRNAs among the upregulated miRNAs in LSCs at relapse (Figure S1C and 1B). Since LSCs are supposedly responsible for the outcome of both leukemia initiation and relapse, we performed qPCR analyses to validate the differential expression of miR-99a in paired LSC and non-LSC subpopulations from a cohort of 18 AML patients at initial diagnosis. The results revealed that miR-99a was significantly overexpressed in LSCs compared to paired non-LSCs in 14 out of 18 AML patients (Figure 1C). The median increase of miR-99a expression was 3.7-folds in LSC/non-LSCs, while that was only 1.2-folds in CD34+ cells compared to CD34- cells sorted from cord blood (CB) of healthy donors (Figure S1D). Moreover, the expression level of miR-99a was markedly higher in KG-1a and KG-1 cells than in other myeloid leukemia cell lines (Figure S1E). Of note, both KG-1a and KG-1 cells express human hematopoietic stem and progenitor cell antigen CD34, and are considered as the most primitive myeloid leukemia cell lines [21–23]. To determine whether miR-99a overexpression in LSCs correlated with the prognosis of AML, we divided the subjects into two groups based on the median expression level of miR-99a (miR-99ahigh and miR-99alow). Kaplan-Meier analysis and the log-rank test revealed that upregulated miR-99a significantly correlated with worse overall survival (OS) (Figure 1D) and event-free survival (EFS) (Figure 1E). The median of OS was 4 months in miR-99ahigh group compared to 13 months in miR-99alow group, and additionally, the median of EFS was 1 month in miR-99ahigh group compared to 9 months in miR-99alow group, which is consistent with the finding that miR-99a is upregulated in LSCs at relapse stage compared to the paired new-diagnostic stage by miRNA array.
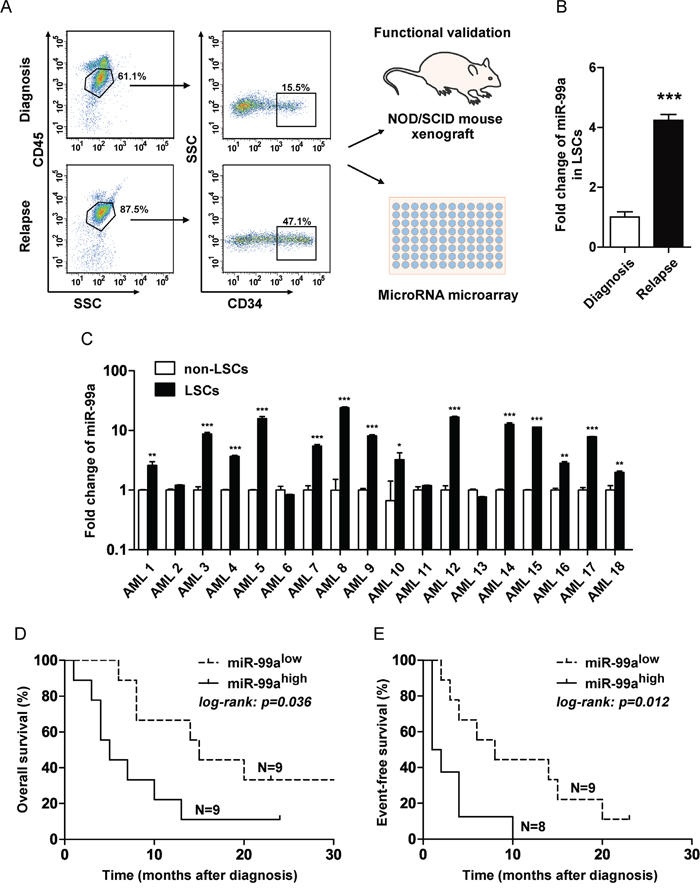
Figure 1: Upregulation of miR-99a in LSCs was associated with poor prognosis of AML. A. Strategy to fractionate AML patient samples based on SSC and immuno-phenotypic staining with CD34 and CD45. LSCs were enriched as SSClowCD45dimCD34+, and non-LSCs were enriched as SSClowCD45dimCD34-. Functional validation of LSC-containing fractions was performed by xenotransplantation. MiRNA array of LSCs was analyzed to generate relapse related miRNA expression profile in LSCs. B. Fold changes of miR-99a in paired LSCs obtained at relapse or initial diagnosis were validated by qPCR. Data are presented as mean ± SD, and represented triplicate wells from one of three independent experiments. U6 was used as the endogenous reference gene. ***p<0.001. C. Differential expression of miR-99a between LSCs and non-LSCs in 18 AML patients by qPCR analyses. The results were expressed as the fold change of LSCs relative to non-LSCs. Data are presented as mean ± SD, and represented triplicate wells from one of two independent experiments. U6 was used as the endogenous reference gene. *p<0.05, **p<0.01, ***p<0.001. D-E. Correlation between miR-99a expression level with OS (D) and EFS (E) in patients with AML. The subjects were divided into two group basis on the median expression of miR-99a in LSCs reference to non-LSCs. OS and EFS were estimated using the Kaplan-Meier analyses and a log-rank test.
To determine if the increased level of miR-99a in LSCs correlated with resistance to chemotherapy, we compared the miRNA levels in the resistant derivatives of K562 cells (a multidrug-resistant derivative of K562 cells, K562/A02, and an imatinib-resistant derivative of K562 cells, K562/G01), to the parental cells. Our results revealed that miR-99a were significantly upregulated in K562/A02 cells and K562/G01 cells than K562 cells (Figure S1F). These data suggest that higher level of miR-99a may associate with the resistance of chemotherapy.
Ectopic miR-99a expression resulted in increased colony forming ability in primary AML LSCs
To determine the potential effects of miR-99a upregulation on cellular function of LSCs, primary CD34+ cells were isolated from two AML patients with a low expression level of miR-99a (AML2 and AML6, as shown in Figure 1C) then transduced with lentivirus carrying hsa-miR-99a-5p (miR-99a) or a scrambled sequence (Ctrl), tagged with enhanced green fluorescent protein (eGFP) (Figure S2A), followed by the colony forming cell (CFC) assay. The result showed a 1.6- and 2.3-fold increase in the number of colonies after ectopic expression of miR-99a in the two AML patients, respectively (Figure 2A), indicating that upregulation of miR-99a enhanced the colony forming activity of LSCs.
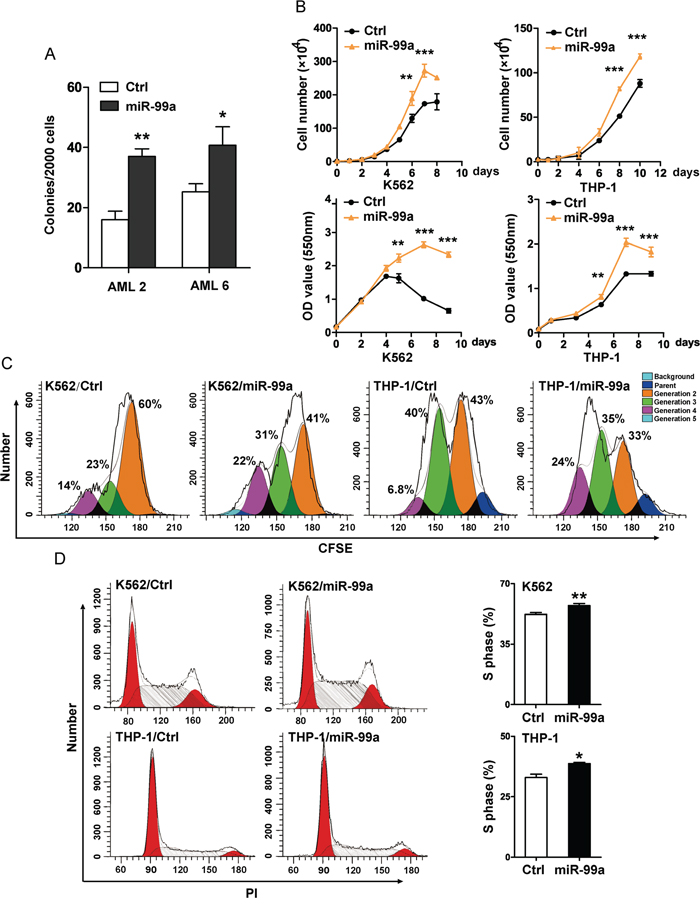
Figure 2: Ectopic miR-99a expression accelerated the growth of myeloid leukemia cells. A. Colony forming ability of primary AML samples with ectopic miR-99a expression. LSCs enriched from AML patients (AML2 and AML6) were transduced with miR-99a or Ctrl viruses, eGFP positive cells were sorted to evaluate the colony forming ability. Colony numbers were scored at day 14. Data are presented as mean ± SD, and represented one of two independent experiments. *p<0.05, **p<0.01. B. Proliferation/Viability of K562 and THP-1 cells transduced with Ctrl or miR-99a viruses were measured by manually counting (upper panel) and MTT staining (lower panel). Data are presented as mean ± SD from three individual experiments. **p<0.01, ***p<0.001. C. Cell division of K562 and THP-1 cells transduced with Ctrl or miR-99a viruses were measured by CFSE staining. Cells were collected at different time points (24 hrs for K562 cells, 48 hrs for THP-1 cells) after CFSE dye labeling, and estimated by flow cytometry. Cells were collected at 0 hr post dye staining as an undivided control. The discrete peaks in this histogram represented successive generations of live cells. Data represented one of two independent experiments. D. Representative flow cytometry histograms show the cell-cycle distribution of K562 and THP-1 cells transduced with Ctrl or miR-99a viruses which were measured by PI staining (left panel). Quantitation of cell-cycle distribution of S-phase is shown (right panel). Data are presented as mean ± SD from three individual experiments. *p<0.05, **p<0.01.
Ectopic miR-99a expression accelerated the growth of myeloid leukemia cells
We next transduced K562 and THP-1 cells with miR-99a or Ctrl vectors and measured the levels of miR-99a by qPCR (Figure S2B). Cell proliferation was measured by manually cell counting, and was further confirmed by MTT assay. Ectopic expression of miR-99a significantly accelerated the growth of both K562 and THP-1 cells (Figure 2B). The estimated cell doubling time for miR-99a and Ctrl cells was 26.6 ± 0.2 hrs and 32.35 ± 0.4 hrs in K562 cells, and 47.3 ± 0.2 hrs and 54.6 ± 0.07 hrs in THP-1 cells, respectively. CFSE analyses were conducted to monitor distinct generations of proliferating cells by CFSE dye dilution. Twenty-four hours after CFSE labeling, the proportions of K562/miR-99a cells in the third and fourth generation were almost doubled compared to K562/Ctrl cells (Figure 2C). A similar accelerated cell division was also observed in THP-1/miR-99a cells compared to THP-1/Ctrl cells after 48 hrs (Figure 2C). Additionally, cell cycle analyses showed that ectopic expression of miR-99a increased the proportion of cells in the S-phase in both K562 and THP-1 cells (Figure 2D). These data suggest that ectopic expression of miR-99a accelerated the growth of myeloid leukemia cells in vitro.
Ectopic miR-99a expression promotes leukemic cell survival after exposure to chemotherapeutic agents in vitro
To further determine if the elevated level of miR-99a is a cause or a result of chemoresistance, we next examined the sensitivity to various chemotherapeutic agents in miR-99a overexpressed K562 and THP-1 cells. Transduction of miR-99a into K562 cells led to a 2.3~ and 2~folds increase in the IC50 to imatinib and doxorubicin compared to K562/Ctrl cells (Figure 3A). Similarly, ectopic expression of miR-99a markedly increased the survival rate of THP-1 cells in the culture containing cytarabine (Ara-C) for 72 hrs (Figure 3A). Consistently, CFC assay showed that ectopic expression of miR-99a increased the colony forming ability of K562 or THP-1 cells that were exposed to imatinib, doxorubicin, or Ara-C for 24 hrs (Figure 3B).
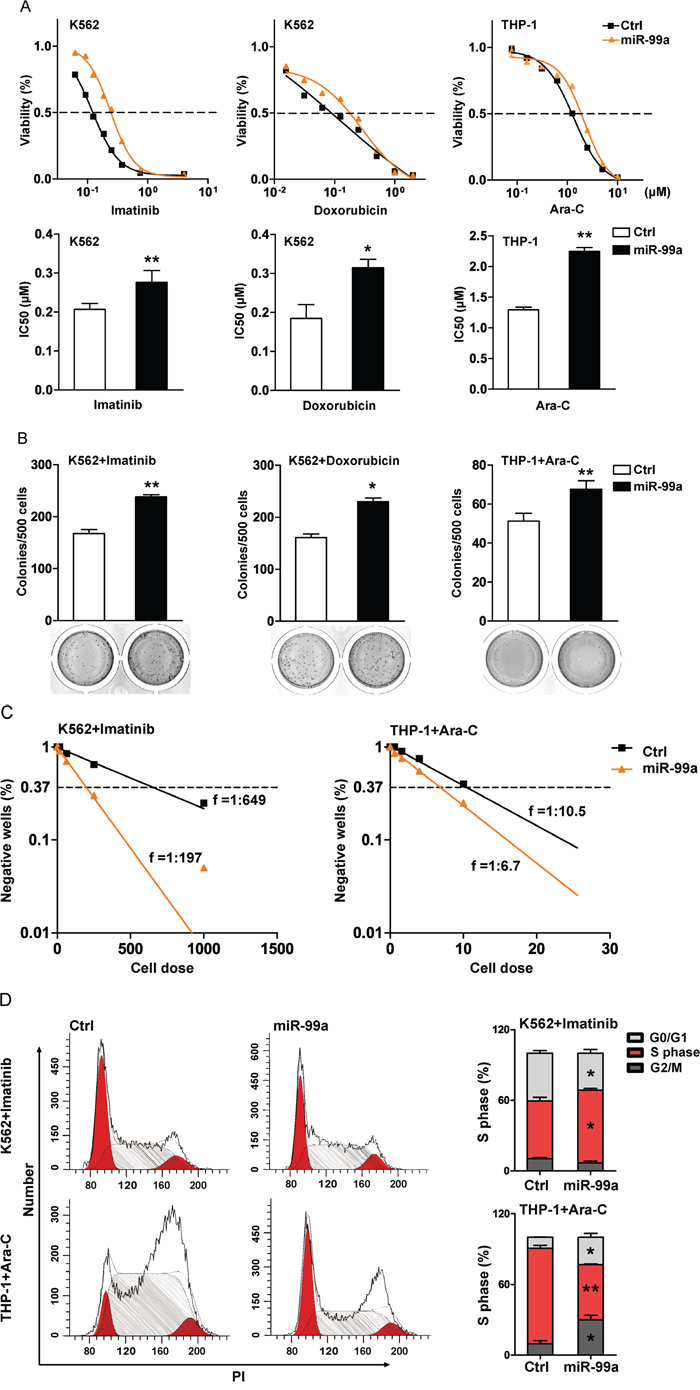
Figure 3: Ectopic miR-99a expression promotes leukemic cell survival after exposure to chemotherapeutic agents in vitro. A. K562 and THP-1 cells transduced with miR-99a and Ctrl viruses were treated with increasing concentrations of imatinib, doxorubicin, or Ara-C for 72 hrs, respectively. Results were expressed as viability percentage relative to the untreated group. IC50 values were calculated with GraphPad Prism software, which was marked in the middle of the bottom and top plateau. Data are presented as mean ± SD, and represented one of four independent experiments. *p<0.05, **p<0.01. B. CFC assays of cells after drug treatment. K562/miR-99a and K562/Ctrl cells were exposed to 0.12 μM imatinib or 0.02 μM doxorubicin for 24 hrs, THP-1/miR-99a and THP-1/Ctrl cells were exposed to 1.25 μM AraC for 24 hrs, and followed by culturing in methylcellulose medium (7 days for K562 and ten days for THP-1). Data are presented as mean ± SD, and represented one of three independent experiments. *p<0.05, **p<0.01. C. The frequency of resistant cells was estimated by limiting-dilution assay. K562/miR-99a and K562/Ctrl cells were exposed to 0.25 μM imatinib for 14 consecutive days. THP-1/miR-99a and THP-1/Ctrl cells were previously incubated for 24 hrs with 1.25 μM Ara-C, washed, and then cultured for another 14 days. Individual wells were considered negative if there was no cell growth after two weeks. Data represented one of two independent experiments. D. Cell-cycle distribution of cells after drug treatment. K562 and THP-1 cells transduced with miR-99a and Ctrl viruses were treated with imatinib and Ara-C, respectively. Representative flow cytometry histograms show the cell-cycle distribution in cells posts treatment by PI staining (left panel). Quantitation of cell-cycle distribution is shown in (right panel). Data are presented as mean ± SD, and represented one of three individual experiments. *p<0.05, **p<0.01.
To assess the frequency of resistant clones following exposure to chemotherapeutic agents, we next performed limiting dilution analyses on the K562 or THP-1 cells transduced with either miR-99a or Ctrl vector. The frequency of resistant cells was 1:197 and 1:649 in K562/miR-99a and K562/Ctrl cells in the presence of 0.25 μM imatinib consecutively for 14 days. The frequency was 1:6.7 and 1:10.5 in THP-1/miR-99a and THP-1/Ctrl cells after exposure to 1.25 μM Ara-C for only 24 hrs followed by a 14-days of culture, respectively (Figure 3C). Ara-C is an antimetabolite antineoplastic agent that inhibits the synthesis of DNA [24, 25]. Ara-C treatment induced significant S-phase arrest in THP-1/Ctrl cells, while THP-1/miR-99a cells showed less S-phase arrest 24 hrs post treatment compared to untreated cells (Figure 2D, 3D). Different from Ara-C, imatinib can induce cell cycle arrest at G1 phase [26], and K562/miR-99a cells still showed less G1 arrest compared to K562/Ctrl cells after treated with imatinib for 24 hrs (Figure 2D, 3D). However, the results of apoptosis analyses showed no significant difference between miR-99a and Ctrl cells after exposure to these chemotherapeutic agents (Figure S3). Collectively, ectopic expression of miR-99a in myeloid leukemia cells resulted in increased cell survival after chemotherapy in vitro as reflected by the increased colony forming ability and the higher frequency of resistant cells, which are likely due to overcoming cell cycle arrest induced by chemotherapeutic drugs.
Ectopic miR-99a expression promotes leukemic cell survival after exposure to chemotherapeutic agents in vivo
To determine the potential role of miR-99a in chemoresistance in vivo, we injected THP-1/miR-99a and THP-1/Ctrl cells subcutaneously into nude mice. When tumor reached 200 mm3, mice were treated with Ara-C daily at 50 mg/kg for a consecutive 7 days. The tumor volume was measured every other day, and the tumor inhibition rate was calculated based on tumor volume of Ara-C treatment group relative to control group. A significant lower tumor inhibition rate was observed overtime in the THP-1/miR-99a cell injected mice compared to the THP-1/Ctrl cell injected mice (Figure 4A). On the other hand, a mean of 40.8 mm3/day of tumor growth was observed in the mice received THP-1/miR-99a cells, while a mean of 27.8 mm3/day of tumor growth was observed in the mice injected with THP-1/Ctrl cells during the treatment (Figure 4B). H&E staining of xenograft tumors from nude mice revealed that the Ctrl group had more necrotic cells than miR-99a group after Ara-C treatment (Figure 4C). Taken together, ectopic expression of miR-99a promotes leukemic cell survival after exposure to chemotherapeutic agents in vivo.
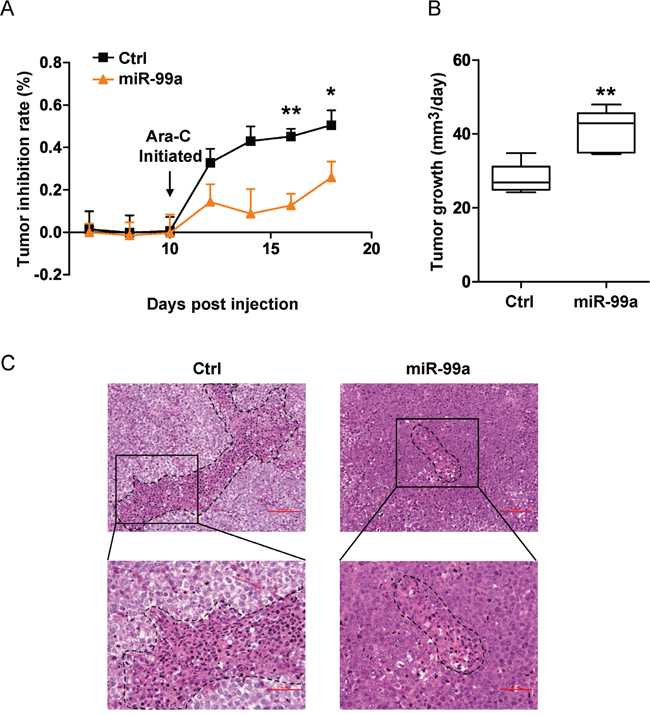
Figure 4: Ectopic miR-99a expression promotes leukemic cell survival after exposure to chemotherapeutic agents in vivo. A-B. Nude mice bearing THP-1/Ctrl and THP-1/miR-99a cells were treated with Ara-C daily at 50 mg/kg for a week and tumor inhibition rate was measured based on tumor volumes of Ara-C and control group every other day (A). The tumor growth of THP-1/Ctrl and THP-1/miR-99a cells post Ara-C treatment was shown in (B), which was defined as the increase in tumor volume per day (mm3/day). Data are presented as mean ± SD (n=5 mice/group), and represented one of two independent experiments. *p<0.05, **p<0.01. C. Histological sections of tumors stained with H&E. Representative images of the tumor from Ctrl or miR-99a mice were taken under 20× magnification (upper panel) and 40× magnification (lower panel). Scale bars represent 100 μm (upper panel) and 50 μm (upper panel). Necrotic areas are indicated by dotted lines.
Gene profiling analyses showed dysregulation of leukemic expansion associated gene upon miR-99a overexpression
To identify gene candidates that may account for the observed cellular phenotype such as accelerated cell growth and increased drug resistance mediated by miR-99a, microarray assay was performed in THP-1 cells transduced with miR-99a or Ctrl viruses, respectively. A total of 776 differentially expressed genes (356 upregulated and 420 downregulated) were identified in THP-1/miR-99a compared to THP-1/Ctrl cells (Figure 5A). Gene Ontology (GO) analyses revealed that the differential genes were mainly enriched in 49 up-regulated GO terms and 71 down-regulated GO terms in THP-1/miR-99a cells. The upregulated GO terms mediated by miR-99a mainly included categories of protein complex organization, chromatin remodeling, cell cycle regulation and cell proliferation, while categories of proteolysis, immune response and RNA folding were significantly downregulated (Figure 5B). Pathway enrichment analyses showed that the differential genes were mainly involved in 14 significantly up-regulated pathways and 15 significantly down-regulated pathways (Figure S4A-S4B). Moreover, Gene set enrichment analysis (GSEA) revealed significant enrichment of KEGG cell cycle genes, E2F target genes, MYC target genes, and LSC maintenance associated genes in cells with ectopic miR-99a expression (Figure 5C-5F). Heat maps of the enriched genes were shown in Figure S4C-S4F. On the other hand, genes related to inflammatory response and interferon alpha response were enriched in Ctrl group (Figure S4G-S4H). Differential gene interactions in the Signal-Net were analyzed by the Ingenuity Pathway Analysis (IPA), and E2F, CCNE1 and CDKN2A were observed as the core genes of the regulation network downstream of miR-99a (Figure 5G). Several predicted targets of miR-99a were found to be significantly downregulated in microarray analysis, including BMPR2, CTDSPL, GPR26, KBTBD8, NIPBL, PPP3CA, PRDM1, TMPRSS13, and SMARCA5. Among these, CTDSPL, PRDM1 and PPP3CA were the candidate targets of miR-99a as they closely linked to proliferation and survival network based on IPA network analysis (Figure 5G). The expression of the candidate targets and key downstream genes of miR-99a was further confirmed by qPCR (Figure 5H-5I). Western blot analyses further demonstrated the upregulation of CCNE1 and the downregulation of p14ARF, p16INK4a (two proteins encoded by CDKN2A) and phospho-p53 (p-p53) (Figure 5J).
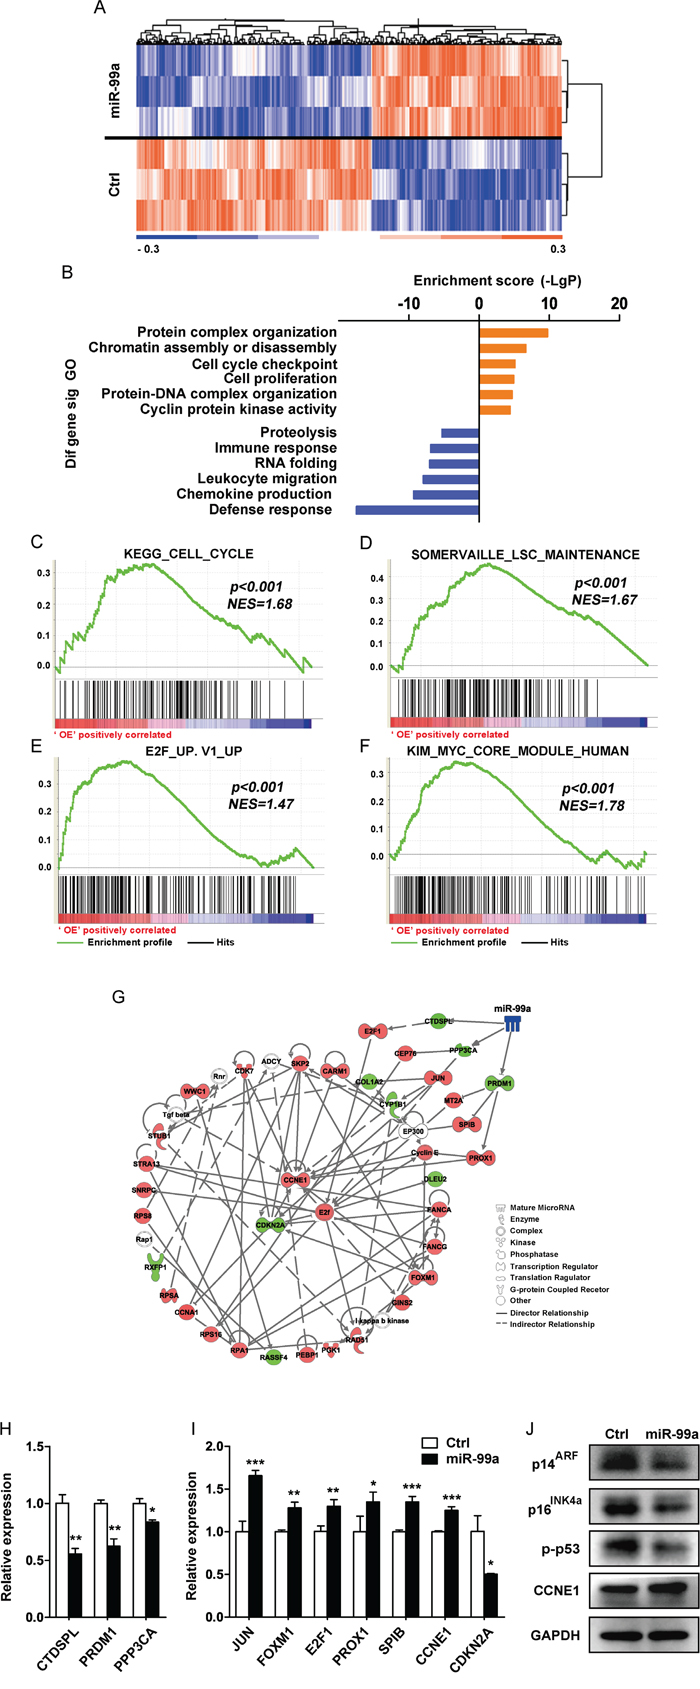
Figure 5: Gene profiling analyses showed differentially expressed gene upon miR-99a overexpression. A. Heat map of microarray analysis of the significantly different expression levels of mRNA between THP-1/Ctrl and THP-1/miR-99a groups. (n=3 per group, p<0.05, fold-change ≥1.2). B. GO analysis of microarray data. Selected significant ontology terms are shown. C-F. GSEA analyses of gene expression profile in miR-99a versus Ctrl cells. The enrichment score plots corresponded to the KEGG cell cycle gene set (C), the LSC maintenance signature gene set (D), E2F-induced upregulated gene set (E), and the MYC core module gene set (F). The normalized enrichment score (NES) and p-values are shown. G. Representative protein-protein interaction network of proliferation/survival related genes based on the IPA database. Node shape corresponds to molecular function type. Node color corresponds to up-regulation (red) or down-regulation (green). Visualization was done using IPA software. H-J. Relative expression levels of miR-99a candidate targets (H), key downstream genes (I) were confirmed by qPCR and protein expression of relevant differentially expressed genes was analyzed by Western blot (J). Data are presented as mean ± SD and represented one of two independent experiments. *p<0.05, **p<0.01, ***p<0.001.
DISCUSSION
LSCs are hypothesized to underlie leukemic initiation, progression and relapse as they can reacquire the stem cell capability of self-renewal and generate non-LSCs [19, 20]. The high expression of LSC related signature genes was negatively correlated with the complete remission [1]. MiRNAs have been shown to be involved in various physiological and pathological processes, such as cell proliferation, differentiation, metabolism and cancer progression [11, 27]. There are several studies investigating the miRNA profiles in primary AML cells [28–30], but few studies have focused on LSCs. It is important to explore the potential role of LSC-related miRNAs in maintaining LSC properties, such as self-renewal and therapy resistance, which are vital for the progression and prognosis of AML. In this study, we compared for the first time the miRNA expression profiles in LSCs obtained from paired BM samples of an AML patient at diagnosis and relapse. Relapse-associated miRNA signature has been identified, and miR-99a was found to be the most significant differentially expressed miRNA. By comparing miRNA expression profiles of the same patient at different disease stages, the effect of individual differences can be reduced, and thus only disease progression related miRNAs are enriched and identified. We further examined miR-99a expression in LSCs and non-LSCs obtained from 18 AML patients at initial diagnosis, and found that miR-99a was significantly overexpressed in LSCs compared to non-LSCs in 14/18 patients. Importantly, we found that OS and EFS were significantly worse in patients with higher miR-99a levels, thus unveiling that high miR-99a expression correlates with poor prognosis including relapse and therapy resistance in AML patients. However, further studies with a larger cohort are warranted to validate our findings. Similarly, Zhang et al. showed that miR-99a expression decreased sharply in 91% whole BM samples from patients with pediatric AML and Chronic myeloid leukemia (CML) at complete remission compared to that at disease diagnosis [31]. However, miR-99a has been reported to works as a tumor suppressor and downregulated in a variety of human cancers, such as breast cancer [32], cervical cancer [33], prostate cancer [34] and osteosarcoma [35]. The finding that miR-99a plays opposing roles in human myeloid leukemia versus solid tumor suggesting the tissue-specific features as well as complexities of the regulation network of miRNAs, which is consistent with the previous studies [36–39].
Our studies demonstrated that ectopic expression of miR-99a increased the clonogenic capacity of primary AML LSCs. Further studies in myeloid leukemia cell lines revealed that ectopic miR-99a led to accelerated cell-cycle progression and cell proliferation. MiR-99a combined with miR-125b has been reported to induce resistance to vincristine in ETV6-RUNX1-positive acute lymphocytic leukemia [40]. However, the role of miR-99a in drug resistance in myeloid leukaemia has not been well documented. In our study, miR-99a overexpression in K562 and THP1 cells led to decreased sensitivity to multiple first-line chemotherapeutic agents such as imatinib and Ara-C in vitro, promoted cell survival after exposure to drugs. More importantly, miR-99a overexpression resulted in a resistant to Ara-C by a xenograft model in vivo. The miR-99a mediated drug resistance is likely, at least in part, due to the overcoming of cell cycle arrest. In addition, higher miR-99a expression levels were found in doxorubicin and imatinib resistant K562 cell lines (K562/A02 and K562/G01) compared to their parental cell lines. All these results demonstrated that miR-99a, the miRNA enriched from LSCs at relapse stage, provides a survival advantage and promotes the expansion of myeloid leukemia cell.
To explore the mechanism underlying the enhanced proliferation and chemoresistance meditated by miR-99a, we identified differential gene expression profiles by microarray analysis. The results provide a potential regulatory pathway that links the downregulated targets of miR-99a (i.e., CTDSPL, PRDM1 and PPP3CA) to the dysregulated key genes associated with leukemic cell expansion. For example, miR-99a overexpression in THP-1 cells upregulated genes encoding key transcriptional factors in hematopoietic malignancies such as JUN, and cell cycle regulators such as E2F1 and FOXM1. Additionally, overexpression of miR-99a led to downregulation of the CDKN2A, which encodes p16INK4a and p14ARF and mediate G1 cell cycle arrest by stabilizing the structure of p53 or inducing p53 activation. All these results suggest an important role of miR-99a in cell cycle entry and progression, leading to the accelerated proliferation and overcoming of chemotherapeutic-agents mediated cell cycle arrest.
Pathway and GO terms revealed that the genes associated with the metabolic process were enriched in miR-99a overexpressed cells, such as ATP1B1, ATP5G1 and ATP5EP2. Katajisto et al. reported that newly produced mitochondria can maintain stem properties [41]. Our data that overexpression of miR-99a increases the expression of the genes critical for cell cycle, DNA repair, metabolic process and protein complex organization, indicates that miR-99a may promote cell division by enabling cells to acquire new organelles and proteins. It is possible that higher miR-99a levels in leukemia cells may lead to the acquisition of LSC-like traits. Here, we show that overexpression of miR-99a upregulates MYC target genes, cell cycle regulators, and LSC maintenance associated genes. Dysregulation of these miR-99a-associated genes results in a cellular characteristic with both competitive advantage and LSC maintenance. In fact, this is consistent with the finding by Laurenti et al. that accelerating exit from quiescence did not alter the balance between self-renewal and differentiation or impair stem cell maintenance [42].
Collectively, our study provides strong evidence that higher levels of miR-99a are associated with poor prognosis of AML that results in cell expansion and progression of myeloid leukemia. In addition, the expression level of miR-99a may be used as a biomarker for the prognosis and progression of AML.
MATERIALS AND METHODS
Human subjects and cell lines
BM samples and medical histories were obtained from a cohort of 18 individuals with AML (aged 18-70 years) at Institute of Hematology and Blood Diseases Hospital, Chinese Academy of Medical Sciences from 2007 to 2014. All patients signed the informed consent form, and the study protocol was approved by the Ethics Committee of our hospital, conforming to the ethical guidelines of the 1975 Helsinki Declaration. All patients were reevaluated and met 2008 WHO diagnostic criteria for AML. Mononuclear cells were isolated by standard ficoll procedure and frozen viably.
BM mononuclear cells (MNCs) were stained with fluorochrome-conjugated monoclonal antibodies, and sorted by flow cytometry. LSCs were enriched as side scatter (SSC)lowCD45dimCD34+, and non-LSC leukemia blast cells as SSClowCD45dimCD34-, respectively. DAPI (Sigma-Aldrich, St Louis, USA) was used to exclude dead cells. Antibodies were purchased from BD Biosciences, including anti-CD45 (FITC), anti-CD34 (PE), and anti-CD33 (PE-Cy7). CB hematopoietic stem and progenitor cells obtained from consenting healthy donors were enriched using CD34+ magnetic beads (Miltenyi, Bergisch Gladbach, Germany).
Human hematopoietic malignant cell lines used in this study were purchased from American Type Culture Collection. K562, U937, NB4, and THP-1 cells were cultured in RPMI 1640 (Gibco, Carlsbad, USA) supplemented with 10% fetal bovine serum (FBS, Gibco) and 1% penicillin/streptomycin (Beyotime, Shanghai, China). K562/A02 induced by doxorubicin were cultured in the same complete RPMI 1640 media containing 1.5 μM doxorubicin, and K562/G01 were cultured in the complete RPMI 1640 media containing 2 μM imatinib. KG-1a and KG-1 cells were cultured in IMDM supplemented with 20% FBS and 1% penicillin/streptomycin.
MiRNA array
Total RNA was extracted using the miRCURY RNA Isolation Kit (EXIQON, Vedbaek, Denmark) according to the manufacturer's protocol. The samples were labeled using the miRCURY™ Hy3™/Hy5™ Power labeling kit and hybridized on the miRCURY™ LNA Array (v.18.0, EXIQON). Subsequently, the slides were washed and scanned using the Axon GenePix 4000B microarray scanner. Images were then imported into GenePix Pro 6.0 software (Axon Laboratory) for grid alignment and data extraction. Expressed data were normalized using the Median normalization, and significant differentially expressed miRNAs were identified through Volcano Plot filtering. Finally, hierarchical clustering was performed to show distinguishable miRNA expression profiling among samples. Differentially expressed miRNAs were further determined using TaqMan gene expression assays according to the manufacturer's protocol (Life Technologies, Carlsbad, USA).
Ectopic expression of miRNA by lentiviral transduction
The lentiviral vectors carrying miR-99a or Ctrl were purchased from GeneCopoeia (Rockville, USA), and remolded with the SFFV promoter (Synbio Tech, Suzhou, China). Cell lines and LSCs isolated from BM of AML patients were transduced at a multiplicity of infection (MOI) of 30. EGFP positive cells were sorted by flow cytometry.
Cell proliferation and cell cycle analyses
THP-1 or K562 cells transduced with miR-99a or Ctrl vectors were counted manually or stained with MTT solution (Roche, Basel, Switzerland) according to the manufacturer's protocol. Cells were also labeled with CFSE (Life Technologies) as described previously with slight modifications [43]. In brief, a total of 1 × 10⁶ cells were washed and stained in 1 mL of PBS containing 5 μM CFSE dye for 20 min at room temperature (RT) in darkness. Cells were quenched with 5 mL of culture media containing at least 1% protein for 5 min, washed twice, and then permeabilized with 2% paraformaldehyde (PFA). Cells were collected at different time points (0 hrs, 24 hrs, and 48 hrs) and analyzed by flow cytometry. Cell cycle was analyzed after propidium iodide (PI, Sigma-Aldrich) staining according to the manufacturer's instructions. Data were analysed using ModFit Software (Verity Software House, USA).
Chemo-sensitivity assay
Cells were seeded into 96-well plates in the presence or absence of drugs for 72 hrs, and then incubated with MTT solution for 4 hrs and solubilized overnight in 10% sodium dodecyl sulfate (SDS) solution. Luminescence was measured using Multi-Mode Microplate Reader (BioTek, USA). The data were graphically displayed using GraphPad Prism version 5.0 (GraphPad Software, USA). IC50 was determined by a nonlinear regression model with a sigmoidal dose response in GraphPad. Doxorubicin and imatinib were purchased from Sigma-Aldrich, and Ara-C was from Pfizer (New York, USA).
CFC and limiting-dilution assays
CFC assay was performed by plating primary LSCs transduced with viruses carrying miR-99a or Ctrl vectors in methylcellulose medium (MethoCult H4434, StemCell Technologies, Vancouver, Canada) at 4000 cells/mL in 24-well plates. Cell lines transduced with miR-99a or Ctrl vectors were pretreated with different drugs for 24 hrs, followed by plating cells into 24-well plates in 0.5 mL of methylcellulose medium (MethoCult H4230, StemCell Technologies) at 1000 cells/mL. After incubation at 37°C for 7-10 days, the number of colonies was counted. To evaluate the frequency of surviving cells after treatment, serially diluted cells (1000 down to 4 cells/well by 1:2.5 dilutions) were added into 96-well plates in 20 replicates. If no cell growth was observed after two weeks, this well was considered as negative. The frequency of resistant cells was estimated by linear regression analysis and Poisson statistics using Extreme Limiting Dilution Analysis software.
Quantitative real-time PCR
Total RNA was obtained using TRIzol regent (Life Technologies) and reverse transcribed to cDNA using ImProm-II™ Reverse Transcription Kit (Promega, Madison, USA). The mRNA expression levels were measured on a 7900 real-time PCR instrument (Applied Biosystems). The primers used are listed in Table S1. The relative expression level of mRNA was calculated using the 2−ΔΔт method adjusted by GAPDH as an internal control.
Western blot analysis
Primary antibodies used for Western blots were CDKN2A/p14ARF (ab3642, abcam), p16 (ab51243, abcam), p-p53 (9286S, Cell Signaling Technology) and GAPDH (2118S, Cell Signaling Technology). Western blots were visualized using ECL detection reagents (Millipore).
Animal study
Functional validation of enriched LSCs was done in NOD/SCID mice intrafemorally after irradiation with 300 cGy. The fraction of human CD45 and CD33 positive cells in BM was analyzed by flow cytometry. Subcutaneous AML models were established by injecting 1×10⁷ THP-1/miR-99a or THP-1/Ctrl cells into the right flank of five-week-old female nude mice. The tumor size was measured every other day throughout the study. The tumor volume was calculated by the following equation: tumor volume = (A × B2) × (1/2), where A was the longer dimension and B was the shorter dimension. When the tumor volume reached 200 mm3, mice were randomly divided into two groups. The mice in Ara-C group were treated with a daily intraperitoneal injection of 50 mg/kg Ara-C for a week, and control group was treated with vehicle control. Eight days post treatment, mice were euthanized and tumors were excised and embedded in paraffin for H&E staining. The tumor inhibition rate was calculated based on tumor volume in Ara-C group relative to the control group as follows: Tumor inhibition rate (%) = (1- tumor volume of treatment group/tumor volume of the control group) × 100%. Moreover, the tumor growth during the treatment was defined as the increase in tumor volume (mm3/day) in each mouse after drug injection. All animal experiments were approved by the institute’s Animal Research Committee.
Bioinformatic analyses
Total RNA of THP-1/Ctrl and THP-1/miR-99a was extracted from biological triplicate samples by TRIzol reagent and purified using RNeasy Mini Kit (Qiagen, Germany) including DNase digestion step. Microarray experiments were conducted by using GeneChip® Human Gene 2.0 ST Arrays (Affymetrix GeneChip®, USA). Raw data (CEL files) was normalized using the robust multiaverage method. Genes differentially expressed were identified by the random variance model (RVM) t-test, with a threshold of p <0.05 and fold-change ≥1.2. Gene expression patterns were determined by cluster analysis based on the median using the Cluster and Java Treeview software.
Based on the GO Database and the Kyoto Encyclopedia of Genes and Genomes (KEGG) Database, GO and pathway analyses of differentially expressed genes were determined using DAVID bioinformatics resources. Significant differences were calculated with Fisher’s exact test. A p-value of <0.05 was considered significant. GSEA was performed based on the Molecular Signatures Database (MSigDB) [44]. The LSC maintenance set used was published by Somervaille et al. [45], and MYC core module set was from Myc regulatory network [46].
Gene signal transduction networks were established to illustrate the inter-gene signaling between differentially expressed genes based on the IPA database (Qiagen), to identify key regulatory genes downstream of miR-99a. A list of potential targets of miR-99a was created by overlapping significant down-regulated genes in the microarray data with the target genes predicted by three databases: miRTarBase (http://mirtarbase.mbc.nctu.edu.tw), TargetScan (http://www.mirbase.org), and miRanda (http://www.ebi.ac.uk/enright-srv/microcosm). Downregulated predicted targets were then connected to the enriched genes in the significant networks by IPA, and targets corresponding to the higher number of genes or proteins were selected as candidate targets of miR-99a in this study.
Statistical analyses
Statistical analyses were performed using GraphPad Prism 5.0 and SPSS 21.0 (IBM, Armonk, USA). A unpaired t-test or Mann-Whitney test was used for two group comparisons, and ANOVA analysis was used to determine differences among three or more groups. OS of AML was defined as the time from diagnosis of AML to death or was censored at the last follow-up. EFS was defined as the time from diagnosis of AML to the first adverse event such as induction failure, relapse, and death from any cause. Statistical analyses for OS and EFS were performed by Kaplan–Meier analysis and log-rank test. To determine the precision of the results, 95% confidence intervals (95% CIs) for the variables of interest were calculated. The number of biologically-independent replicates, and significance levels were shown in the figure legends. A p-value of < 0.05 was considered significant.
ACKNOWLEDGMENTS
We thank Ming Yang and Dr. Yawei Zheng for their valuable suggestions for our experiments. We thank Dr. Sabeena Rasul critically revised the manuscript. We are also grateful to our lab members for their insightful discussion during the course of this work and in the preparation of the manuscript.
CONFLICTS OF INTEREST
The authors declare no conflicts of interest.
GRANT SUPPORT
This work was supported in part by grants from National Natural Science Foundation of China (81170512, 81570113 to Y.Z., and 81370610 to J.B.)
REFERENCES
1. Eppert K, Takenaka K, Lechman ER, Waldron L, Nilsson B, van Galen P, Metzeler KH, Poeppl A, Ling V, Beyene J, Canty AJ, Danska JS, Bohlander SK, et al. Stem cell gene expression programs influence clinical outcome in human leukemia. Nat Med. 2011; 17:1086-1093.
2. Taussig DC, Miraki-Moud F, Anjos-Afonso F, Pearce DJ, Allen K, Ridler C, Lillington D, Oakervee H, Cavenagh J, Agrawal SG, Lister TA, Gribben JG, Bonnet D. Anti-CD38 antibody-mediated clearance of human repopulating cells masks the heterogeneity of leukemia-initiating cells. Blood. 2008; 112:568-575.
3. Kreso A, Dick JE. Evolution of the cancer stem cell model. Cell Stem Cell. 2014; 14:275-291.
4. Passegue E, Jamieson CH, Ailles LE, Weissman IL. Normal and leukemic hematopoiesis: are leukemias a stem cell disorder or a reacquisition of stem cell characteristics? Proc Natl Acad Sci U S A. 2003; 100:11842-11849.
5. Dick JE. Stem cell concepts renew cancer research. Blood. 2008; 112:4793-4807.
6. Raffel S, Trumpp A. miR-126 Drives Quiescence and Self-Renewal in Leukemic Stem Cells. Cancer Cell. 2016; 29:133-135.
7. Krause DS, Van Etten RA. Right on target: eradicating leukemic stem cells. Trends Mol Med. 2007; 13:470-481.
8. Hanley J, McAndrew L. Planning a community survey of the younger chronic sick and disabled living in Lothian region. Int J Rehabil Res. 1987; 10:179-181.
9. He L, Hannon GJ. MicroRNAs: small RNAs with a big role in gene regulation. Nat Rev Genet. 2004; 5:522-531.
10. Xuan Y, Yang H, Zhao L, Lau WB, Lau B, Ren N, Hu Y, Yi T, Zhao X, Zhou S, Wei Y. MicroRNAs in colorectal cancer: small molecules with big functions. Cancer Lett. 2015; 360:89-105.
11. Baltimore D, Boldin MP, O'Connell RM, Rao DS, Taganov KD. MicroRNAs: new regulators of immune cell development and function. Nat Immunol. 2008; 9:839-845.
12. Wu W, Sun M, Zou GM, Chen J. MicroRNA and cancer: Current status and prospective. Int J Cancer. 2007; 120:953-960.
13. Esquela-Kerscher A, Slack FJ. Oncomirs - microRNAs with a role in cancer. Nat Rev Cancer. 2006; 6:259-269.
14. Fabbri M, Garzon R, Andreeff M, Kantarjian HM, Garcia-Manero G, Calin GA. MicroRNAs and noncoding RNAs in hematological malignancies: molecular, clinical and therapeutic implications. Leukemia. 2008; 22:1095-1105.
15. Yendamuri S, Calin GA. The role of microRNA in human leukemia: a review. Leukemia. 2009; 23:1257-1263.
16. Mi S, Li Z, Chen P, He C, Cao D, Elkahloun A, Lu J, Pelloso LA, Wunderlich M, Huang H, Luo RT, Sun M, He M, et al. Aberrant overexpression and function of the miR-17-92 cluster in MLL-rearranged acute leukemia. Proc Natl Acad Sci U S A. 2010; 107:3710-3715.
17. Wong P, Iwasaki M, Somervaille TC, Ficara F, Carico C, Arnold C, Chen CZ, Cleary ML. The miR-17-92 microRNA polycistron regulates MLL leukemia stem cell potential by modulating p21 expression. Cancer Res. 2010; 70:3833-3842.
18. Costinean S, Zanesi N, Pekarsky Y, Tili E, Volinia S, Heerema N, Croce CM. Pre-B cell proliferation and lymphoblastic leukemia/high-grade lymphoma in E(mu)-miR155 transgenic mice. Proc Natl Acad Sci U S A. 2006; 103:7024-7029.
19. Lapidot T, Sirard C, Vormoor J, Murdoch B, Hoang T, Caceres-Cortes J, Minden M, Paterson B, Caligiuri MA, Dick JE. A cell initiating human acute myeloid leukaemia after transplantation into SCID mice. Nature. 1994; 367:645-648.
20. Bonnet D, Dick JE. Human acute myeloid leukemia is organized as a hierarchy that originates from a primitive hematopoietic cell. Nat Med. 1997; 3:730-737.
21. Furley AJ, Reeves BR, Mizutani S, Altass LJ, Watt SM, Jacob MC, van den Elsen P, Terhorst C, Greaves MF. Divergent molecular phenotypes of KG1 and KG1a myeloid cell lines. Blood. 1986; 68:1101-1107.
22. Navakauskiene R, Borutinskaite VV, Treigyte G, Savickiene J, Matuzevicius D, Navakauskas D, Magnusson KE. Epigenetic changes during hematopoietic cell granulocytic differentiation--comparative analysis of primary CD34+ cells, KG1 myeloid cells and mature neutrophils. BMC Cell Biol. 2014; 15:4.
23. She M, Niu X, Chen X, Li J, Zhou M, He Y, Le Y, Guo K. Resistance of leukemic stem-like cells in AML cell line KG1a to natural killer cell-mediated cytotoxicity. Cancer Lett. 2012; 318:173-179.
24. van Pelt K, de Haan G, Vellenga E, Daenen SM. Administration of low-dose cytarabine results in immediate S-phase arrest and subsequent activation of cell cycling in murine stem cells. Exp Hematol. 2005; 33:226-231.
25. Wills PW, Hickey R, Malkas L. Ara-C differentially affects multiprotein forms of human cell DNA polymerase. Cancer Chemother Pharmacol. 2000; 46:193-203.
26. Chandramohan Reddy T, Bharat Reddy D, Aparna A, Arunasree KM, Gupta G, Achari C, Reddy GV, Lakshmipathi V, Subramanyam A, Reddanna P. Anti-leukemic effects of gallic acid on human leukemia K562 cells: downregulation of COX-2, inhibition of BCR/ABL kinase and NF-kappaB inactivation. Toxicol In Vitro. 2012; 26:396-405.
27. Slaby O, Svoboda M, Michalek J, Vyzula R. MicroRNAs in colorectal cancer: translation of molecular biology into clinical application. Mol Cancer. 2009; 8:102.
28. Jongen-Lavrencic M, Sun SM, Dijkstra MK, Valk PJ, Lowenberg B. MicroRNA expression profiling in relation to the genetic heterogeneity of acute myeloid leukemia. Blood. 2008; 111:5078-5085.
29. Cammarata G, Augugliaro L, Salemi D, Agueli C, La Rosa M, Dagnino L, Civiletto G, Messana F, Marfia A, Bica MG, Cascio L, Floridia PM, Mineo AM, et al. Differential expression of specific microRNA and their targets in acute myeloid leukemia. Am J Hematol. 2010; 85:331-339.
30. Garzon R, Volinia S, Liu CG, Fernandez-Cymering C, Palumbo T, Pichiorri F, Fabbri M, Coombes K, Alder H, Nakamura T, Flomenberg N, Marcucci G, Calin GA, et al. MicroRNA signatures associated with cytogenetics and prognosis in acute myeloid leukemia. Blood. 2008; 111:3183-3189.
31. Zhang L, Li X, Ke Z, Huang L, Liang Y, Wu J, Zhang X, Chen Y, Zhang H, Luo X. MiR-99a may serve as a potential oncogene in pediatric myeloid leukemia. Cancer Cell Int. 2013; 13:110.
32. Wang X, Li Y, Qi W, Zhang N, Sun M, Huo Q, Cai C, Lv S, Yang Q. MicroRNA-99a inhibits tumor aggressive phenotypes through regulating HOXA1 in breast cancer cells. Oncotarget. 2015; 6:32737-32747. doi: 10.18632/oncotarget.5355.
33. Wang L, Chang L, Li Z, Gao Q, Cai D, Tian Y, Zeng L, Li M. miR-99a and -99b inhibit cervical cancer cell proliferation and invasion by targeting mTOR signaling pathway. Med Oncol. 2014; 31:934.
34. Sun D, Lee YS, Malhotra A, Kim HK, Matecic M, Evans C, Jensen RV, Moskaluk CA, Dutta A. miR-99 family of MicroRNAs suppresses the expression of prostate-specific antigen and prostate cancer cell proliferation. Cancer Res. 2011; 71:1313-1324.
35. Xing B, Ren C. Tumor-suppressive miR-99a inhibits cell proliferation via targeting of TNFAIP8 in osteosarcoma cells. Am J Transl Res. 2016; 8:1082-1090.
36. Bousquet M, Harris MH, Zhou B, Lodish HF. MicroRNA miR-125b causes leukemia. Proc Natl Acad Sci U S A. 2010; 107:21558-21563.
37. Feliciano A, Castellvi J, Artero-Castro A, Leal JA, Romagosa C, Hernandez-Losa J, Peg V, Fabra A, Vidal F, Kondoh H, Ramon YCS, Lleonart ME. miR-125b acts as a tumor suppressor in breast tumorigenesis via its novel direct targets ENPEP, CK2-alpha, CCNJ, and MEGF9. PLoS One. 2013; 8:e76247.
38. He L, Thomson JM, Hemann MT, Hernando-Monge E, Mu D, Goodson S, Powers S, Cordon-Cardo C, Lowe SW, Hannon GJ, Hammond SM. A microRNA polycistron as a potential human oncogene. Nature. 2005; 435:828-833.
39. Zhang L, Huang J, Yang N, Greshock J, Megraw MS, Giannakakis A, Liang S, Naylor TL, Barchetti A, Ward MR, Yao G, Medina A, O'Brien-Jenkins A, et al. microRNAs exhibit high frequency genomic alterations in human cancer. Proc Natl Acad Sci U S A. 2006; 103:9136-9141.
40. Akbari Moqadam F, Lange-Turenhout EA, Aries IM, Pieters R, den Boer ML. MiR-125b, miR-100 and miR-99a co-regulate vincristine resistance in childhood acute lymphoblastic leukemia. Leuk Res. 2013; 37:1315-1321.
41. Katajisto P, Dohla J, Chaffer CL, Pentinmikko N, Marjanovic N, Iqbal S, Zoncu R, Chen W, Weinberg RA, Sabatini DM. Stem cells. Asymmetric apportioning of aged mitochondria between daughter cells is required for stemness. Science. 2015; 348:340-343.
42. Laurenti E, Frelin C, Xie S, Ferrari R, Dunant CF, Zandi S, Neumann A, Plumb I, Doulatov S, Chen J, April C, Fan JB, Iscove N, et al. CDK6 levels regulate quiescence exit in human hematopoietic stem cells. Cell Stem Cell. 2015; 16:302-313.
43. Hu H, Fernando K, Ni H, Weissman D. HIV envelope suppresses CD4+ T cell activation independent of T regulatory cells. J Immunol. 2008; 180:5593-5600.
44. Subramanian A, Tamayo P, Mootha VK, Mukherjee S, Ebert BL, Gillette MA, Paulovich A, Pomeroy SL, Golub TR, Lander ES, Mesirov JP. Gene set enrichment analysis: a knowledge-based approach for interpreting genome-wide expression profiles. Proc Natl Acad Sci U S A. 2005; 102:15545-15550.
45. Somervaille TC, Matheny CJ, Spencer GJ, Iwasaki M, Rinn JL, Witten DM, Chang HY, Shurtleff SA, Downing JR, Cleary ML. Hierarchical maintenance of MLL myeloid leukemia stem cells employs a transcriptional program shared with embryonic rather than adult stem cells. Cell Stem Cell. 2009; 4:129-140.
46. Kim J, Woo AJ, Chu J, Snow JW, Fujiwara Y, Kim CG, Cantor AB, Orkin SH. A Myc network accounts for similarities between embryonic stem and cancer cell transcription programs. Cell. 2010; 143:313-324.