
Introduction
Lung cancer patients need accurate and integrated information about risk of recurrence and survival to help with informed decision-making. Traditional survival estimates are given by survival from the time of diagnosis in most reports, representing cumulative survival. However, probabilities of disease recurrence and death evolve over time and usually decline with increased survivorship. As a result, cumulative survival estimates calculated at the time of initial diagnosis have limited utility for follow-up care, since they provide only a static view of risk without postoperative follow-up information and do not reflect changes in prognosis over time.
Conditional survival (CS), derived from the concept of conditional probability, is an estimate of survival probability after having already survived for a specific time after a cancer diagnosis [1]. This estimate of survival is clinically relevant because it reflects the change in survival likelihood with increasing duration of follow-up from the time of the initial cancer diagnosis. CS analysis has been reported for various kinds of malignancies, including ovarian cancer, colon cancer and GIST [2-4]. Also, some studies comprehensively reported CS of non-small cell lung cancer (NSCLC) without specific focus on lung adenocarcinoma which is the most common histologic type of NSCLC [5-8].
In this study, we assessed conditional overall survival (OS) and disease-free survival (DFS) among patients with surgically resected stage I-IIIa lung adenocarcinoma and compared the results with traditional survival estimates. Moreover, recently highlighted prognostic factors of lung adenocarcinoma from the International Association for the Study of Lung Cancer/American Thoracic Society/European Respiratory Society (IASLC/ATS/ERS) lung adenocarcinoma classification scheme [9, 10] and image biomarkers such as tumor-shadow disappearance ratio (TDR) on CT and maximum standardized uptake value (SUVmax) on 18F-fluoro-2-deoxyglucose (FDG)-PET/CT [11] were evaluated together with traditionally well-known clinico-pathologic factors to identify changes in prognostic contribution over time for each factor.
Patients and Methods
Our institutional review board approved this retrospective study and informed consent was waived (No. 2015-11-009).
Study population and data collection
Eight-hundred and thirty consecutive patients with lung adenocarcinoma were identified between September 2003 and August 2011. All patients underwent complete resection and mediastinal lymph node dissection at Samsung Medical Center (Seoul, Korea) with or without postsurgical adjuvant therapy. Both chest CT and integrated FDG PET/CT were obtained within the month before resection from all patients.
Among these, 68 patients were excluded by prognosis-related factors such as presence of another cancer (43 patients) and micrometastasis at the time of surgery (25 patients). Another 39 patients were excluded due to insufficient pathologic slides for evaluation of the whole tumor. Ultimately, 723 patients (372 males, 351 females; median age, 61 years) were included in this study (Figure A1).
All cases were staged according to the seventh edition of the TNM classification for lung cancer [12, 13]. Pathologic subtyping was carried out according to the criteria of the IASLC/ATS/ERS classification scheme in all cases [9]. For pathologic grading, we adopted a recently proposed system [10] categorizing adenocarcinoma-in-situ, minimally invasive adenocarcinoma and lepidic adenocarcinoma as low grade, acinar and papillary tumor as intermediate grade, and solid and micropapillary tumors as high grade. In addition, according to World Health Organization classification criteria [14], histologic differentiation was categorized into poorly, moderately or well differentiated carcinomas.
Imaging analysis
PET/CT imaging was evaluated by a nuclear medicine physician who was unaware of clinical and pathologic data. FDG uptake was evaluated by placing regions of interest and calculated as the SUVmax.
Two chest radiologists were asked to retrospectively evaluate CT scans for maximal diameter of nodules and TDR without clinical information, PET findings, and histologic diagnoses. The longest tumor diameter was measured manually on lung window images of PACS monitors using electronic measurement tools on transverse images. For calculation of TDR [15], the maximum dimension of the tumors and the largest dimension perpendicular to the maximum diameter were measured using both the lung and mediastinal windows. In addition, the observers assessed tumor solidity to visually classify density of the lesions into three categories (non-solid, part-solid, and solid feature) using both lung and mediastinal window settings.
Statistical analysis
To calculate conditional OS and DFS after surgical resection of lung adenocarcinoma, electronic medical records were reviewed for date of last follow-up, documented recurrence, or death. Recurrence was defined as any documented clinical or pathologic evidence of local or distant disease recurrence. DFS was defined as the time from surgery to the first event of recurrence or the last follow up visit. In this study, we evaluated 3-year conditional survival, facilitating prognostication for survivors who have already passed through high risk period of recurrence [16-18] .
Conditional survival probability of time t conditioning at t0 is the probability that patients who are alive at time t0 survive for additional t. Conditional survival analysis at time t0 (≥0) was conducted by applying standard survival analysis methods such as the Kaplan-Meier method, the log-rank test and Cox regression method, to data sets consisting of subjects at risk at time t0. Three-year conditional OS and DFS estimates were computed within subgroups defined by performance status, sex, smoking history, stage, pathologic factors, radiologic factors, and history of adjuvant therapy. We also evaluated the contribution of patient characteristics on OS and DFS at baseline and on conditional OS and DFS at 1, 2, 3, 4 and 5 years after surgery using univariable Cox regression models to calculate hazard ratios and corresponding 95% CIs. The size of some of the subgroups and the number of events was too small to yield meaningful results for later years. Furthermore, to determine independent prognostic predictors and to quantify temporal changes of contribution of such predictors on patient prognosis over time, multivariable conditional Cox regression models were fitted at each t0 ( = 0, 1, 2, 3, 4, 5 years) using predictors selected with a stepwise method. For a chosen time point t0, we considered the set of all predictor which had been selected for at least one t0 value in order to investigate the time effect of a predictor. Also, the hazard ratio estimates were plotted over the range of t0 values. For each significant continuous predictor, a cutoff value was chosen by fitting a conditional univariable Cox regression model for each t0 value and finding a value that optimally split all patients into two groups in terms of p-value and hazard ratio in common over different t0 values. Conditional 3-year OS and DFS were estimated for each patient group defined by each binary predictor and plotted over different t0 values. These analyses were conducted using SAS version 9.4 (SAS Institute, Cary, NC) and R 2.10.0 (Vienna, Austria; http://www.R-project.org).
Results
Baseline demographics and conditional survival analysis
Patient characteristics and radiological features are summarized in the Supplementary Table. After a median follow-up of 3.8 years (range 0.04-9.58 years), 57 (7.8%) patients died (41 and 16 subjects with and without recurrences or metastases, respectively) and 177 (24.48%) recurrences or metastases were recorded after surgical resection. Among all 723 patients included in this study, median OS and DFS were 3.59 years (range, 0.04-9.58 years) and 2.93 years (range, 0.04-9.58), respectively.
The 3-year OS and DFS were 92.12% and 75.52% at baseline, respectively. The probability of surviving an additional 3 years, conditioned on having already survived 1, 2, 3, 4, and 5 years after surgery, improved to 93.40%, 95.68%, 96.09%, 97.43% and 98.33%, respectively. The probability of surviving an additional 3 years without recurrence, conditioned on having already survived 1, 2, 3, 4, and 5 years after surgery, was 80.31%, 87.38%, 92.11%, 94.88% and 95.95%, respectively. Figure 1 summarizes the conditional probabilities of 3-year OS and DFS for each time point.
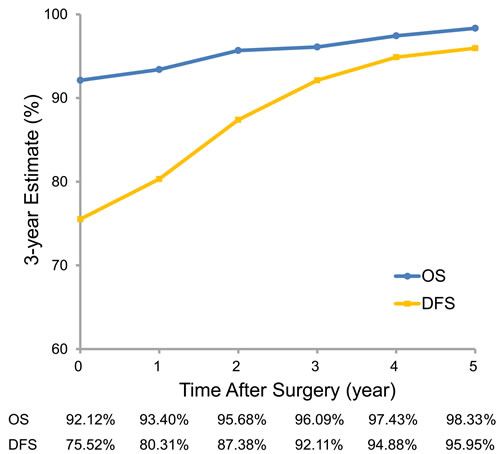
Figure 1: Three-year conditional overall and disease-free survival estimates.
Distribution of clinico-pathologic characteristics and stratified conditional survival analysis across years
Table 1 shows the distribution of disease and clinical characteristics among patients across years of OS and DFS. In general, the ratio of male sex, ever-smoker, advanced disease stage, high pathologic grade and poor differentiation diminished over time, suggesting that those features correlated to poor OS and DFS. Conversely, proportion of female sex, never-smoker, early disease stage, low pathologic grade and well differentiation gradual increased over time.
Table 1: Distribution of clinico-pathologic characteristics across years of overall (OS) and disease-free survival (DFS)
|
Baseline |
1-year |
2-year |
3-year |
4-year |
5-year |
||||||||||||||||
|
N=723 |
OS (N=682) |
DFS (N=640) |
OS (N=602) |
DFS (N=523) |
OS (N=435) |
DFS (N=355) |
OS (N=311) |
DFS (N=254) |
OS (N=180) |
DFS (N=148) |
|||||||||||
Characteristic |
No. |
% |
No. |
% |
No. |
% |
No. |
% |
No. |
% |
No. |
% |
No. |
% |
No. |
% |
No. |
% |
No. |
% |
No. |
% |
Performance Status |
||||||||||||||||||||||
0 |
318 |
44 |
303 |
44.4 |
297 |
46.4 |
274 |
45.5 |
253 |
48.4 |
211 |
48.5 |
185 |
52.1 |
163 |
52.4 |
140 |
55.1 |
105 |
58.3 |
87 |
58.8 |
1 |
386 |
53.4 |
363 |
53.2 |
327 |
51.1 |
316 |
52.5 |
260 |
49.7 |
218 |
50.1 |
166 |
46.8 |
145 |
46.6 |
111 |
43.7 |
74 |
41.1 |
60 |
40.5 |
2 |
16 |
2.21 |
14 |
2.05 |
14 |
2.19 |
10 |
1.66 |
8 |
1.53 |
5 |
1.15 |
4 |
1.13 |
3 |
0.96 |
3 |
1.18 |
1 |
0.56 |
1 |
0.68 |
3 |
3 |
0.41 |
2 |
0.29 |
2 |
0.31 |
2 |
0.33 |
2 |
0.38 |
1 |
0.23 |
0 |
0 |
0 |
0 |
0 |
0 |
0 |
0 |
0 |
0 |
Age |
||||||||||||||||||||||
Median |
60 |
59.9 |
60 |
60 |
60 |
59.7 |
60 |
60.3 |
61.0 |
59.0 |
59.2 |
|||||||||||
Interquartile range |
13.6 |
13 |
13 |
13 |
13 |
13.2 |
13.0 |
12.3 |
12.5 |
11.9 |
11.8 |
|||||||||||
Sex |
||||||||||||||||||||||
Male |
372 |
51.5 |
343 |
50.3 |
312 |
48.8 |
294 |
48.8 |
255 |
48.8 |
203 |
46.7 |
165 |
46.5 |
133 |
42.8 |
109 |
42.9 |
73 |
40.6 |
60 |
40.5 |
Female |
351 |
48.6 |
339 |
49.7 |
328 |
51.3 |
308 |
51.2 |
268 |
51.2 |
232 |
53.3 |
190 |
53.5 |
178 |
57.2 |
145 |
57.1 |
107 |
59.4 |
88 |
59.5 |
Smoking history |
||||||||||||||||||||||
Never-smoker |
420 |
58.1 |
403 |
59.1 |
386 |
60.3 |
371 |
61.6 |
322 |
61.6 |
281 |
64.6 |
228 |
64.2 |
213 |
68.5 |
175 |
68.9 |
132 |
73.3 |
109 |
73.7 |
Ever-smoker |
303 |
41.9 |
279 |
40.9 |
254 |
39.7 |
231 |
38.4 |
201 |
38.4 |
154 |
35.4 |
127 |
35.8 |
98 |
31.5 |
79 |
31.1 |
48 |
26.7 |
39 |
26.4 |
T category |
||||||||||||||||||||||
T1a |
333 |
46.1 |
318 |
46.6 |
309 |
48.3 |
283 |
47 |
267 |
51.1 |
218 |
50.1 |
194 |
54.7 |
166 |
53.4 |
148 |
58.3 |
95 |
52.8 |
85 |
57.4 |
T1b |
209 |
28.9 |
202 |
29.6 |
190 |
29.7 |
184 |
30.6 |
154 |
29.5 |
133 |
30.6 |
106 |
29.9 |
97 |
31.2 |
74 |
29.1 |
63 |
35 |
45 |
30.4 |
T2a |
140 |
19.4 |
128 |
18.8 |
116 |
18.1 |
110 |
18.3 |
86 |
16.4 |
72 |
16.6 |
50 |
14.1 |
41 |
13.2 |
28 |
11 |
19 |
10.6 |
17 |
11.5 |
T2b |
31 |
4.29 |
26 |
3.81 |
20 |
3.13 |
18 |
2.99 |
12 |
2.29 |
11 |
2.53 |
4 |
1.13 |
6 |
1.93 |
3 |
1.18 |
3 |
1.67 |
1 |
0.68 |
T3a |
10 |
1.38 |
8 |
1.17 |
5 |
0.78 |
7 |
1.16 |
4 |
0.76 |
1 |
0.23 |
1 |
0.28 |
1 |
0.32 |
1 |
0.39 |
0 |
0 |
0 |
0 |
N category |
||||||||||||||||||||||
N0 |
581 |
80.4 |
557 |
81.7 |
535 |
83.6 |
498 |
82.7 |
452 |
86.4 |
360 |
82.8 |
314 |
88.5 |
268 |
86.2 |
229 |
90.2 |
165 |
91.7 |
139 |
93.9 |
N1 |
82 |
11.3 |
76 |
11.1 |
67 |
10.5 |
62 |
10.3 |
47 |
8.99 |
49 |
11.3 |
27 |
7.61 |
31 |
9.97 |
20 |
7.87 |
13 |
7.22 |
8 |
5.41 |
N2 |
60 |
8.3 |
49 |
7.18 |
38 |
5.94 |
42 |
6.98 |
24 |
4.59 |
26 |
5.98 |
14 |
3.94 |
12 |
3.86 |
5 |
1.97 |
2 |
1.11 |
1 |
0.68 |
Stage |
||||||||||||||||||||||
IA |
471 |
65.2 |
453 |
66.4 |
440 |
68.8 |
405 |
67.3 |
375 |
71.7 |
301 |
69.2 |
270 |
76.1 |
232 |
74.6 |
203 |
79.9 |
146 |
81.1 |
122 |
82.4 |
IB |
88 |
12.2 |
84 |
12.3 |
78 |
12.2 |
76 |
12.6 |
65 |
12.4 |
50 |
11.5 |
39 |
11 |
30 |
9.65 |
22 |
8.66 |
17 |
9.44 |
16 |
10.8 |
IIA |
90 |
12.5 |
84 |
12.3 |
77 |
12 |
71 |
11.8 |
55 |
10.5 |
55 |
12.6 |
31 |
8.73 |
35 |
11.3 |
23 |
9.06 |
14 |
7.78 |
9 |
6.08 |
IIB |
10 |
1.38 |
10 |
1.47 |
6 |
0.94 |
7 |
1.16 |
4 |
0.76 |
3 |
0.69 |
1 |
0.28 |
2 |
0.64 |
1 |
0.39 |
1 |
0.56 |
0 |
0 |
IIIA |
64 |
8.85 |
51 |
7.48 |
39 |
6.09 |
43 |
7.14 |
24 |
4.59 |
26 |
5.98 |
14 |
3.94 |
12 |
3.86 |
5 |
1.97 |
2 |
1.11 |
1 |
0.68 |
Pathologic Subtype |
||||||||||||||||||||||
AIS |
35 |
4.84 |
35 |
5.13 |
35 |
5.47 |
35 |
5.81 |
35 |
6.69 |
31 |
7.13 |
31 |
8.73 |
25 |
8.04 |
25 |
9.84 |
11 |
6.11 |
11 |
7.43 |
MIA |
34 |
4.7 |
33 |
4.84 |
33 |
5.16 |
31 |
5.15 |
31 |
5.93 |
21 |
4.83 |
21 |
5.92 |
7 |
2.25 |
7 |
2.76 |
5 |
2.78 |
5 |
3.38 |
Lepidic |
125 |
17.3 |
118 |
17.3 |
116 |
18.1 |
107 |
17.8 |
106 |
20.3 |
78 |
17.9 |
75 |
21.1 |
68 |
21.9 |
63 |
24.8 |
45 |
25 |
42 |
28.4 |
Acinar |
314 |
43.4 |
296 |
43.4 |
279 |
43.6 |
264 |
43.9 |
221 |
42.3 |
205 |
47.1 |
156 |
43.9 |
149 |
47.9 |
113 |
44.5 |
89 |
49.4 |
70 |
47.3 |
Papillary |
65 |
8.99 |
62 |
9.09 |
53 |
8.28 |
53 |
8.8 |
40 |
7.65 |
34 |
7.82 |
21 |
5.92 |
17 |
5.47 |
12 |
4.72 |
5 |
2.78 |
3 |
2.03 |
Micropapillary |
23 |
3.18 |
23 |
3.37 |
22 |
3.44 |
19 |
3.16 |
13 |
2.49 |
12 |
2.76 |
7 |
1.97 |
3 |
0.96 |
1 |
0.39 |
3 |
1.67 |
1 |
0.68 |
Solid |
113 |
15.6 |
101 |
14.8 |
88 |
13.8 |
79 |
13.1 |
63 |
12.1 |
40 |
9.2 |
31 |
8.73 |
28 |
9 |
21 |
8.27 |
8 |
4.44 |
7 |
4.73 |
Variant |
14 |
1.94 |
14 |
2.05 |
14 |
2.19 |
14 |
2.33 |
14 |
2.68 |
14 |
3.22 |
13 |
3.66 |
14 |
4.5 |
12 |
4.72 |
14 |
7.78 |
9 |
6.08 |
Pathologic grade |
||||||||||||||||||||||
Low |
194 |
27.4 |
186 |
27.8 |
184 |
29.4 |
173 |
29.4 |
172 |
33.8 |
130 |
30.9 |
127 |
37.1 |
100 |
33.7 |
95 |
39.3 |
61 |
36.8 |
58 |
41.7 |
Intermediate |
379 |
53.5 |
358 |
53.6 |
332 |
53 |
317 |
53.9 |
261 |
51.3 |
239 |
56.8 |
177 |
51.8 |
166 |
55.9 |
125 |
51.7 |
94 |
56.6 |
73 |
52.5 |
High |
136 |
19.2 |
124 |
18.6 |
110 |
17.6 |
98 |
16.7 |
76 |
14.9 |
52 |
12.4 |
38 |
11.1 |
31 |
10.4 |
22 |
9.09 |
11 |
6.63 |
8 |
5.76 |
Differentiation |
||||||||||||||||||||||
WD |
248 |
34.3 |
240 |
35.2 |
237 |
37 |
219 |
36.4 |
214 |
40.9 |
175 |
40.2 |
168 |
47.3 |
139 |
44.7 |
130 |
51.2 |
83 |
46.1 |
74 |
50 |
MD |
340 |
47 |
321 |
47.1 |
299 |
46.7 |
291 |
48.3 |
236 |
45.1 |
206 |
47.4 |
147 |
41.4 |
131 |
42.1 |
94 |
37 |
86 |
47.8 |
64 |
43.2 |
PD |
135 |
18.7 |
121 |
17.7 |
104 |
16.3 |
92 |
15.3 |
73 |
14 |
54 |
12.4 |
40 |
11.3 |
41 |
13.2 |
30 |
11.8 |
11 |
6.11 |
10 |
6.76 |
Solidity |
||||||||||||||||||||||
Non-solid |
152 |
21 |
144 |
21.1 |
144 |
22.5 |
128 |
21.3 |
127 |
24.3 |
87 |
20 |
85 |
23.9 |
62 |
19.9 |
60 |
23.6 |
26 |
14.4 |
25 |
16.9 |
Part-solid |
83 |
11.5 |
80 |
11.7 |
79 |
12.3 |
78 |
13 |
76 |
14.5 |
74 |
17 |
70 |
19.7 |
69 |
22.2 |
62 |
24.4 |
56 |
31.1 |
48 |
32.4 |
Solid |
488 |
67.5 |
458 |
67.2 |
417 |
65.2 |
396 |
65.8 |
320 |
61.2 |
274 |
63 |
200 |
56.3 |
180 |
57.9 |
132 |
52 |
98 |
54.4 |
75 |
50.7 |
TDR |
||||||||||||||||||||||
Median |
33.6 |
34 |
35.4 |
34 |
39.1 |
35.7 |
47.6 |
37.8 |
50.5 |
40.8 |
52.0 |
|||||||||||
Interquartile range |
70.1 |
69.6 |
72.5 |
69.8 |
74.6 |
67.9 |
73.5 |
68.3 |
71.3 |
56.4 |
57.3 |
|||||||||||
SUVmax |
||||||||||||||||||||||
Median |
5.10 |
5.10 |
4.65 |
4.95 |
3.90 |
4.60 |
3.30 |
4.10 |
3.10 |
3.40 |
2.85 |
|||||||||||
Interquartile range |
7.30 |
7.30 |
6.80 |
7.30 |
6.35 |
6.58 |
5.60 |
6.38 |
5.55 |
5.45 |
5.00 |
|||||||||||
Adjuvant therapy |
||||||||||||||||||||||
Yes |
271 |
37.5 |
255 |
37.4 |
219 |
34.2 |
227 |
37.7 |
160 |
30.6 |
170 |
39.1 |
100 |
28.2 |
108 |
34.7 |
60 |
23.6 |
52 |
28.9 |
30 |
20.3 |
No |
452 |
62.5 |
427 |
62.6 |
421 |
65.8 |
375 |
62.3 |
363 |
69.4 |
265 |
60.9 |
255 |
71.8 |
203 |
65.3 |
194 |
76.4 |
128 |
71.1 |
118 |
79.7 |
Abbreviations: AIS, Adenocarcinoma-In-Situ; MD, Moderately-Differentiated; MIA, Minimally Invasive Adenocarcinoma; TDR, Tumor shadow-Disappearance Ratio; PD, Poorly-Differentiated; WD, Well-Differentiated
Cox regression analyses
Univariable Cox regression analyses evaluated the contribution of various clinical, pathological and radiological characteristics on 3-year OS and DFS at baseline and on subsequent 3-year conditional OS and DFS at 1, 2, 3, 4 and 5 years (Table 2). In terms of conditional OS, performance, stage, pathologic subtype, pathologic grade, differentiation, TDR value, SUVmax and history of adjuvant treatment significantly correlated with subsequent 3-year conditional OS until 3 years after surgery. In contrast, age, sex, smoking history and pathologic pattern group lost their statistical significance at 1 or 2 years after surgery (see Table 3). In terms of conditional DFS, performance, differentiation, TDR value, SUVmax and history of adjuvant treatment showed significant correlation with subsequent 3-year conditional DFS until 2 years after surgery. Stage, pathologic subtype and pattern group maintained their statistical significance until 1 year after surgery. None of features except age was significantly associated with 3-year DFS estimates at 3 years after surgery
Table 2: Univariable analyses for conditional overall (OS) and disease-free survival (DFS)
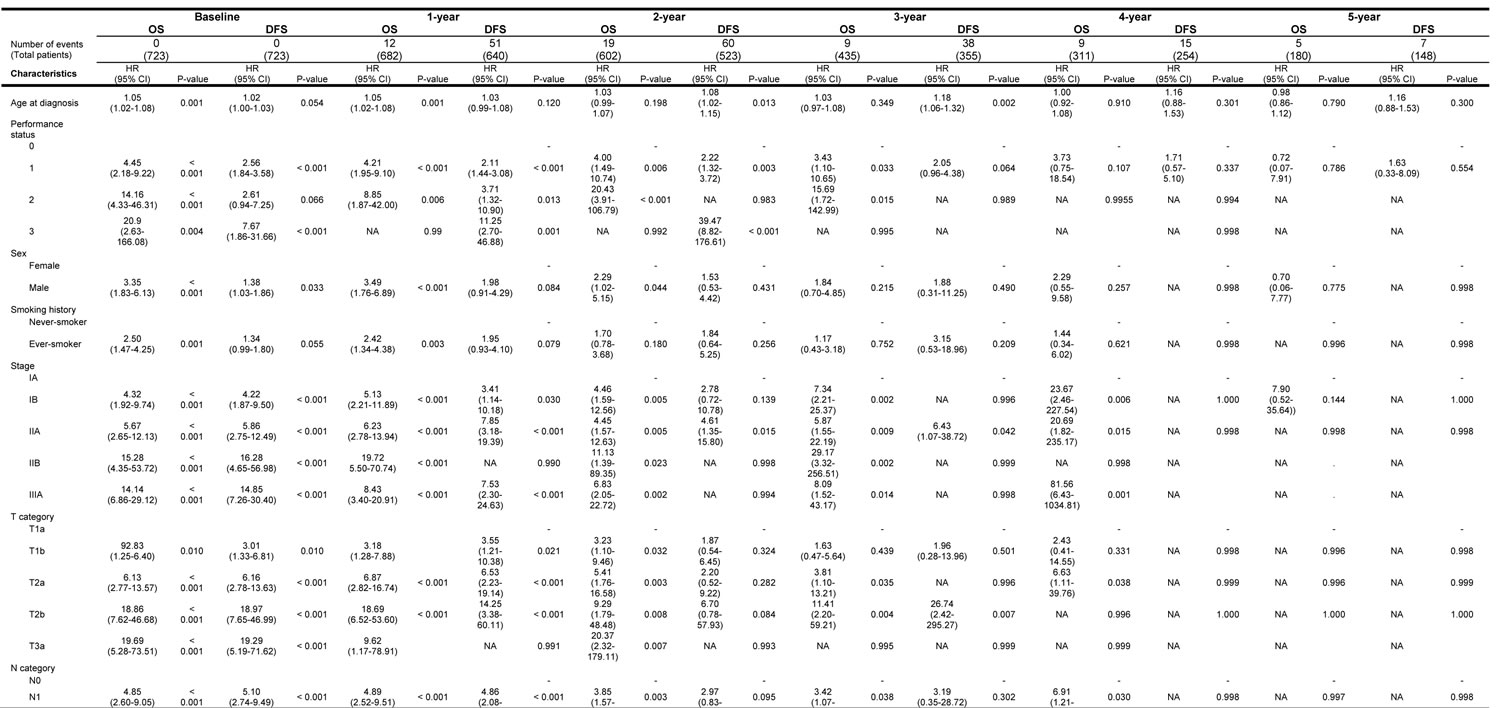
*Log-Rank test
Abbreviations: AIS, Adenocarcinoma-In-Situ; MD, Moderately-Differentiated; MIA, Minimally Invasive Adenocarcinoma; SUVmax, Maximum Standardized Uptake Value; TDR, Tumor shadow-Disappearance Ratio; PD, Poorly-Differentiated; WD, Well-Differentiated
Statistically significant predictors of 3-year OS and DFS at baseline and subsequent 3-year conditional OS and DFS at 1, 2, 3, 4 and 5 years after surgery were evaluated, fitting multivariable Cox regression models with stepwise regression at each time point (Table 3). Temporally changing hazard ratios for OS were based on multivariable regression analysis (Figure A2, error bars depict 95% CIs). At baseline, factors significantly associated with poor overall survival were poor performance (HR = 2.73, p < 0.001), higher disease stage (HR = 1.36, p-value = 0.0078) and SUVmax (HR = 1.08, p-value = 0.0018). Among these variables, performance status and SUVmax remained statistically predictive of subsequent OS at 1 and 2 years after surgery (performance; HR = 2.20, p-value = 0.003 at 1-year; HR = 2.65, p-value = 0.0037 at 2-year; SUVmax; HR = 1.10, p-value = 0.0002 at 1-year; HR = 1.08, p-value = 0.0495 at 2-year). At the 3-year time point, there was no statistically significant predictor of subsequent 3-year OS. History of adjuvant treatment, sex and smoking history were not significant predictors of conditional OS at any time.
Temporally changing hazard ratios for DFS were based on multivariable regression analysis (Figure A3, error bars depict 95% CIs). At baseline, characteristics significantly associated with poor DFS included poor performance (HR = 1.58, p-value = 0.0004), low TDR value (HR = 0.99, p-value = 0.0001), history of adjuvant treatment (HR = 6.02, p-value < 0.0001) and higher disease stage (HR = 1.12, p-value = 0.0451). Among these variables, only history of adjuvant treatment remained predictive of subsequent DFS at 1, 2 and 3 years after surgery (HR = 6.68, 9.15 and 10.54, respectively). Patient performance and TDR value remained significant predictors of subsequent 3-year DFS at the 1- and 2-year mark, but lost their statistical significance by 3 years after surgery (performance; HR = 1.58, p-value = 0.0035 at 1 year; HR = 1.72, p-value = 0.0190 at 2 years; TDR value; HR = 0.99, p-value = 0.0006 at 1 year; HR = 0.99, p-value = 0.0457 at 2 years). Disease stage was no longer a significant predictor of subsequent 3-year DFS at any time point except for baseline.
Table 3: Multivariable analyses for conditional overall (OS) and disease-free survival (DFS)
Baseline (n=551) |
1 yr (n=526) |
2 yr (n=462) |
3yr (n=343) |
4yr (n=254) |
5yr (n=152) |
|||||||
Number of events (Total patients) |
0 (723) |
12 (682) |
19 (602) |
9 (435) |
9 (311) |
5 (180) |
||||||
Factors related to OS |
HR (CI) |
p-value |
HR (CI) |
p-value |
HR (CI) |
p-value |
HR (CI) |
p-value |
HR (CI) |
p-value |
HR (CI) |
p-value |
Performance status |
2.73 (1.73-4.31) |
<0.001 |
2.2 (1.31-3.70) |
0.003 |
2.65 (1.37-5.13) |
0.00374 |
2.31 (0.96-5.53) |
0.06162 |
1.82 (0.41-8 .11) |
0.4311 |
0.02 (0-2.23) |
0.10596 |
Stage |
1.36 (1.08-1.70) |
0.00788 |
1.25 (0.98-1.59) |
0.07455 |
1.13 (0.81-1.56) |
0.4732 |
1.20 (0.80-1.80) |
0.38697 |
1.95 (1.02-3.73) |
0.0431 |
12.16 (0.84-176.75) |
0.0673 |
Adjuvant treatment |
1.81 (0.83-3.92) |
0.1351 |
2.42 (1.04-5.65) |
0.041 |
3.47 (1.14-10.56) |
0.02879 |
4.38 (1.08-18.36) |
0.0431 |
7.88 (0.73-84.69) |
0.0883 |
1.44 (0.08-27.48) |
0.8084 |
SUVmax |
1.08 (1.03-1.14) |
0.00182 |
1.10 (1.04-1.15) |
<0.00021 |
1.08 (1.00-1.16) |
0.0494955 |
1.05 (0.95-1.17) |
0.33576 |
0.94 (0.76-1.16) |
0.56162 |
1.19 (0.86-1.64) |
0.2953 |
Sex |
1.53 (0.60-3.88) |
0.37081 |
2.21 (0.86-5.69) |
0.10152 |
1.74 (0.55-5.56) |
0.350496 |
1.63 (0.43-6.22) |
0.4764 |
1.79 (0.30-10.70) |
0.52152 |
0.91 (0.03-25.13) |
0.9544 |
Smoking history |
1.94 (0.83-4.56) |
0.1291 |
1.38 (0.59-3.22) |
0.4531 |
1.33 (0.43-4.15) |
0.62455 |
1.01 (0.24-4.14) |
0.99495 |
1.45 (0.21-9.98) |
0.70859 |
0 |
0.9961 |
Baseline (n=551) |
1 yr (n=490) |
2 yr (n=393) |
3yr (n=273) |
4yr (n=203) |
5yr (n=126) |
|||||||
Number of events (Total patients) |
0 (723) |
51 (640) |
60 (523) |
38 (355) |
15 (254) |
7 (148) |
||||||
Factors related to DFS |
HR (CI) |
p-value |
HR (CI) |
p-value |
HR (CI) |
p-value |
HR (CI) |
p-value |
HR (CI) |
p-value |
HR (CI) |
p-value |
Performance status |
1.58 (1.22-2.03) |
<0.001 |
1.58 (1.16-2.15) |
0.004 |
1.72 (1.09-2.72) |
0.019 |
1.46 (0.70-3.05) |
0.311 |
1.23 (0.43-3.56) |
0.698 |
1.35 (0.26-7.08) |
0.721 |
TDR |
0.99 (0.98-0.99) |
<0.001 |
0.99 (0.98-0.99) |
<0.001 |
0.99 (0.98-1.00) |
0.046 |
1.00 (0.98-1.01) |
0.482 |
1.00 (0.98-1.02) |
0.723 |
1.03 (0.997-1.061) |
0.081 |
Adjuvant treatment |
6.02 (3.86-9.39) |
<0.001 |
6.68 (4.01-11.12) |
<0.001 |
9.15 (4.53-18.48) |
<0.001 |
10.54 (4.03-27.59) |
<0.001 |
8.15 (2.04-32.66) |
0.003 |
10.95 (1.46-82.43) |
0.020 |
Stage |
1.12 (1.00-1.25) |
0.045 |
1.03 (0.90-1.18) |
0.672 |
0.94 (0.77-1.16) |
0.570 |
0.80 (0.54-1.18) |
0.259 |
1.23 (0.70-2.16) |
0.473 |
2.51 (1.01-6.26) |
0.048 |
Abbreviations: SUVmax, Maximum Standardized Uptake Value; TDR, Tumor shadow-Disappearance Ratio
Stratified conditional survival probability plotting with cut-point determination
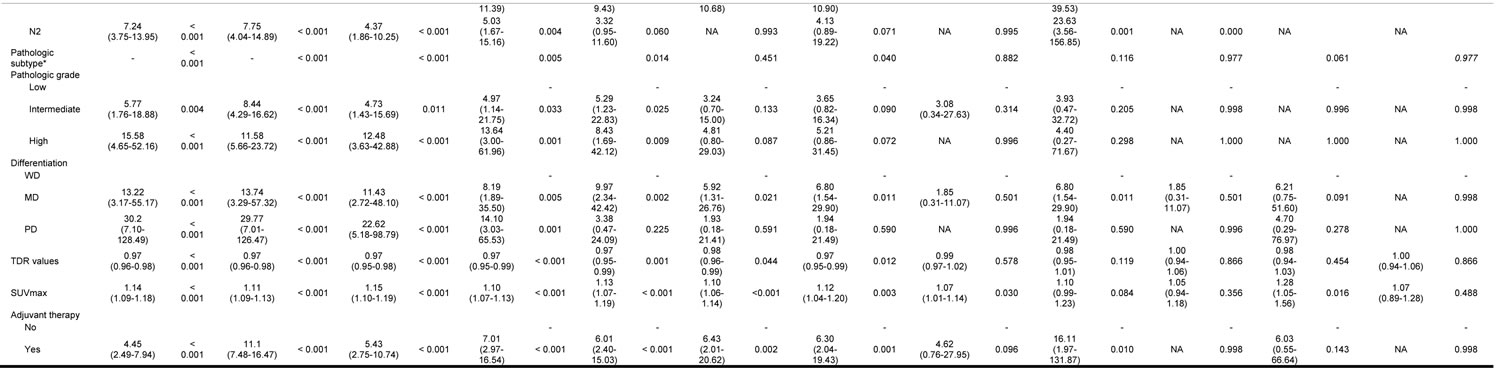
CS analysis was stratified with optimal dichotomizing cut-off value determination according to variables selected at least once during multivariable analysis, with stepwise regression at each time point (Figures 2, 3, A4 and A5). In general, 3-year OS and DFS estimates increased for all clinical, pathological and radiological features, and the gap between estimates decreased with a longer follow-up period. For example, 3-year DFS estimates for pathologic grade ranged from 66.18% to 95.36% at baseline, but this range became tighter over time and at year 5 was 87.50% to 96.55% (see Figure A5).
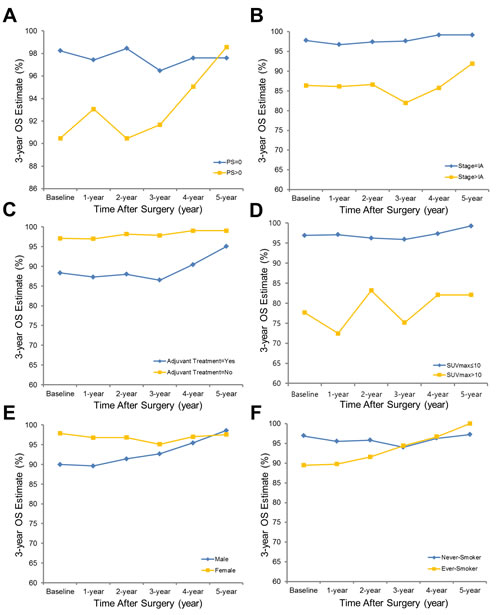
Figure 2: Three-year conditional overall survival estimates plotted with cut-point determination are shown, stratified by performance status a., stage b., history of adjuvant treatment c., SUVmax d., sex e. and history of smoking f. The cut-off value for SUVmax was determined as 10.
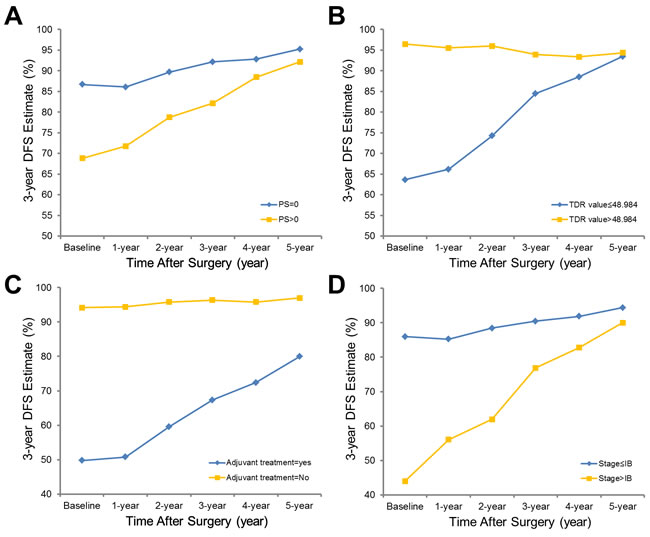
Figure 3: Three-year conditional disease-free survival estimates plotted with cut-point determination are shown, stratified by performance status a., TDR b., history of adjuvant treatment c. and stage d. The cut-off value for TDR was determined as 48.98.
Discussion
The single most important prognostic factor in lung adenocarcinoma, the most common histologic type of NSCLC, has been tumor stage [8, 19]. However, even in the early stages of disease, prognosis of lung adenocarcinoma varies widely [20], necessitating the establishment of reliable prognostic factors to more accurately predict a broad spectrum of tumor behavior.
In contrast to cumulative survival calculations from traditional survival analysis that provide only a static view of risk without postoperative follow-up information, CS is more relevant to follow-up care because it reflects the change of survival likelihood with increasing duration of follow-up from the time of the initial cancer diagnosis. Leveraging the power of the CS analysis implements more evidence-drive approaches to post-therapy surveillance, particularly focused on long-term survivors over 2-3 years, which means that value of the conditional survival analysis is obviously different from traditional survival analysis and the complementary information of two different survival analyses allows for clinician into more appropriate surveillance.
To our knowledge, this is the first study assessing conditional OS and DFS among patients with lung adenocarcinoma. A few studies were previously publised regarding CS of lung cancer but those did not reflect novel lung adenocarcinoma classifcation scheme from the IASLC/ATS/ERS [5-7, 21] or included small cell lung cancer [6, 7] in conditional survival anlysis without emphasis on lung adenocarcinoma. Also, those only presented conditional survival with descriptive way, not or partially elaborating various prognostic factors including clinical, radiological and pathological aspects [5-7, 21]. Another new feature of this study is that we investigated how the effect (or significance) of each factor changed over time, rather than the time-static effect of these, on OS and DFS, which has not been revealed with conventional survival analysis (i.e., cumulative survival). Also, we focused on revealing temporal alteration of prognostic effect of previously well-known independent imaging biomarkers (TDR and SUVmax) and inter-relationship with other prognostic factors. This kind of approach is unique from already reported literatures regarding radiologic prognostic factors.
In this study, we evaluated 3-year conditional survival, facilitating prognostication for survivors who have already passed through high risk period of recurrence. We found clear differences: 3-year OS and DFS of lung adenocarcinoma patients were 92.12% and 75.51% at baseline but improved steadily up to 98.33% and 95.95%, respectively, conditioned on having already survived 1, 2, 3, 4, and 5 years after surgery (See Figure 1). Generally, we observed that OS and DFS improved most for patients with various factors known to be correlated with poor prognosis. In addition, the initial gap in OS and DFS at time of surgery between different subgroups based on performance, sex, smoking history, stage, histology and solidity on CT diminished over time, suggesting that the prognostic significance of these factors decreases as time elapses after surgery.
There have been abundant efforts to stratify patients with lung adenocarcinoma, including new classification schemes [9] or noninvasive surrogate imaging biomarkers [15, 22-26]. However, there have been no previous reports comparing prognostication capabilities and temporal changes in the contribution on prognosis after surgery for different factors. At baseline, there were significant associations between evaluated patient characteristics and survival estimates in accordance with previous studies such as age [27], performance [28], sex [29], smoking history [30], stage [13, 19], histology [9], grade [31], TDR values [32, 33], and SUVmax [34]. However, interestingly, demographic factors lost their statistical significance over time. In contrast, performance status, pathologic factors (stage, subtype, pathologic grade and differentiation), and radiologic factors (TDR and SUVmax) maintained their statistically significant association with 3-year OS until 3 years after surgery. In terms of DFS, none of features except age was significantly associated with CS estimates at 3 years after surgery, but performance, TDR values and SUVmax were statistically associated with subsequent 3-year DFS until 2 years after surgery. From these results, time-independent variables can be differentiated from time-dependent variables, for which further adjustment should be considered for more accurate estimation of prognosis and associated management.
In addition, we performed multivariable regression analysis with various demographic, pathologic and radiologic factors included to discriminate ultimate prognostic factors. Patient performance and SUVmax were independent predictors of subsequent 3-year OS at baseline, 1 and 2 years after surgery. In terms of DFS, TDR value and history of adjuvant treatment were predictive of subsequent 3-year DFS at baseline, 1 and 2 years after surgery. The cut-off values optimally splitting all patients into two groups were determined as 10 and 48.98 for SUVmax and TDR, respectively. These findings based on CS provide theoretical background for clinicians to plan longer period of surveillance following lung adenocarcinoma resection in survivors with preoperatively high SUVmax and low TDR on PET-CT and chest CT, respectively. Actually, many physicians taper follow-up frequency after 3 to 5 years, often with little justification nor evidence based on survival data, for which our study could give the answer to those uncertainties, facilitating a more evidence-based strategy for post-treatment follow-up scheduling based on actual current risk rather than simply on custom or tradition. For instance, if we suppose the condition that subsequent survival probabilities of patients with certain risk factors who survive x years from diagnosis become similar to those of patients without risk factors at diagnosis. Consequently, if clinicians follow up patients without risk factors for y years, patients with high risk factors should be comparably followed for x + y years. Therefore, surveillance strategy for lung adenocarcinoma survivors with preoperatively high SUVmax and low TDR on PET-CT and chest CT, respectively, should be tailored with longer follow-up periods, based on our result.
With respect to tumoral radiologic phenotyping, tumor metabolic information on PET contributed more to overall outcome, whereas TDR on CT contributed to treatment success or failure. Given that metabolic information indicates the degree of tumor aggressiveness [25, 26, 35] and TDR is associated with the degree of tumor invasion [35-38], imaging features observed in adenocarcinomas may provide additional prognostic information, assuming that radiologic functional phenotypes from CT and PET reflect tumor behavior.
This study was retrospectively designed with relatively small sample size and limited number of events. However, all patients underwent relatively uniform management including diagnostic work-up, treatment strategy and histopathologic evaluation solely from a single tertiary referral center in Korea, yielding a homogenous Asian study cohort with a relatively large number of subjects. Another limitation of this study is relatively short follow-up time (median 3.8 years) to precisely describe 5-year outcomes. Validation and expansion of our results with large-scale and multiracial data would allow general application.
In conclusion, conditional OS and DFS for patients with operable lung adenocarcinoma improved steadily over time. The initial gap between OS and DFS at time of surgery between different subgroups based on demographic prognostic factors diminished over time, suggesting that the prognostic significance of these factors decreases as time elapses after surgery, whereas the absolute contribution of pathologic and radiologic factors remained. Therefore, tenacious stance of clinicians on surveillance strategy after lung adenocarcinoma resection might be resonable for survivors with preoperatively high SUVmax and low TDR on PET-CT and chest CT, respectively.
Abbreviations
CS: Conditional Survival
DFS: Disease-Free Survival
FDG: 18F-fluoro-2-deoxyglucose
IASLC/ATS/ERS: International Association for the Study of Lung Cancer/American Thoracic Society/European Respiratory Society
NSCLC: Non-small Cell lung Cancer
OS: Overall Survival
TDR: Tumor-shadow Disappearance Ratio
SUVmax: Maximum Standardized Uptake Value
Conflicts of interest
None.
REFERENCES
1. Henson DE and Ries LA. On the estimation of survival. Semin Surg Oncol. 1994; 10:2-6.
2. Bischof DA, Kim Y, Dodson R, Jimenez MC, Behman R, Cocieru A, Fisher SB, Groeschl RT, Squires MH 3rd, Maithel SK, Blazer DG 3rd, Kooby DA, Gamblin TC, et al. Conditional disease-free survival after surgical resection of gastrointestinal stromal tumors: a multi-institutional analysis of 502 patients. JAMA Surg. 2015; 150:299-306.
3. Kurta ML, Edwards RP, Moysich KB, McDonough K, Bertolet M, Weissfeld JL, Catov JM, Modugno F, Bunker CH, Ness RB and Diergaarde B. Prognosis and conditional disease-free survival among patients with ovarian cancer. J Clin Oncol. 2014; 32:4102-4112.
4. Zamboni BA, Yothers G, Choi M, Fuller CD, Dignam JJ, Raich PC, Thomas CR, Jr., O’Connell MJ, Wolmark N and Wang SJ. Conditional survival and the choice of conditioning set for patients with colon cancer: an analysis of NSABP trials C-03 through C-07. J Clin Oncol. 2010; 28:2544-2548.
5. Wang SJ, Fuller CD and Thomas CR Jr. Ethnic disparities in conditional survival of patients with non-small cell lung cancer. J Thorac Oncol. 2007; 2:180-190.
6. Skuladottir H and Olsen JH. Conditional survival of patients with the four major histologic subgroups of lung cancer in Denmark. J Clin Oncol. 2003; 21:3035-3040.
7. Merrill RM, Henson DE and Barnes M. Conditional survival among patients with carcinoma of the lung. Chest. 1999; 116:697-703.
8. Chen F, Cole P and Bina WF. Time trend and geographic patterns of lung adenocarcinoma in the United States, 1973-2002. Cancer Epidemiol Biomarkers Prev. 2007; 16:2724-2729.
9. Travis WD, Brambilla E, Noguchi M, Nicholson AG, Geisinger KR, Yatabe Y, Beer DG, Powell CA, Riely GJ, Van Schil PE, Garg K, Austin JH, Asamura H, et al. International association for the study of lung cancer/american thoracic society/european respiratory society international multidisciplinary classification of lung adenocarcinoma. J Thorac Oncol. 2011; 6:244-285.
10. Travis WD, Brambilla E, Nicholson AG, Yatabe Y, Austin JH, Beasley MB, Chirieac LR, Dacic S, Duhig E, Flieder DB, Geisinger K, Hirsch FR, Ishikawa Y, et al. The 2015 World Health Organization Classification of Lung Tumors: Impact of Genetic, Clinical and Radiologic Advances Since the 2004 Classification. J Thorac Oncol. 2015; 10:1243-1260.
11. Lee HY, Lee SW, Lee KS, Jeong JY, Choi JY, Kwon OJ, Song SH, Kim EY, Kim J and Shim YM. Role of CT and PET Imaging in Predicting Tumor Recurrence and Survival in Patients with Lung Adenocarcinoma: A Comparison with the International Association for the Study of Lung Cancer/American Thoracic Society/European Respiratory Society Classification of Lung Adenocarcinoma. J Thorac Oncol. 2015.
12. Goldstraw P. International Association for the Study of Lung Cancer. Staging Manual in Thoracic Oncology. 2009. View in Article.
13. Edge SB, Byrd DR, Compton CC, Fritz AG, Greene FL and Trotti A. AJCC Cancer Staging Manual. 7th ed. New York, NY: Springer; 2010.
14. Travis WD, World Health Organization, International Agency for Research on Cancer, International Association for the Study of Lung Cancer and International Academy of Pathology. Pathology and Genetics of Tumours of the Lung, Pleura, Thymus, and Heart. Lyon: IARC Press; 2004.
15. Lee HY, Han J, Lee KS, Koo JH, Jeong SY, Kim BT, Cho YS, Shim YM, Kim J, Kim K and Choi YS. Lung adenocarcinoma as a solitary pulmonary nodule: prognostic determinants of CT, PET, and histopathologic findings. Lung Cancer. 2009; 66:379-385.
16. Kelsey CR, Marks LB, Hollis D, Hubbs JL, Ready NE, D’Amico TA and Boyd JA. Local recurrence after surgery for early stage lung cancer: an 11-year experience with 975 patients. Cancer. 2009; 115:5218-5227.
17. Hung JJ, Hsu WH, Hsieh CC, Huang BS, Huang MH, Liu JS and Wu YC. Post-recurrence survival in completely resected stage I non-small cell lung cancer with local recurrence. Thorax. 2009; 64:192-196.
18. al-Kattan K, Sepsas E, Fountain SW and Townsend ER. Disease recurrence after resection for stage I lung cancer. Eur J Cardiothorac Surg. 1997; 12:380-384.
19. Rami-Porta R, Bolejack V and Goldstraw P. The new tumor, node, and metastasis staging system. Semin Respir Crit Care Med. 2011; 32:44-51.
20. Shedden K, Taylor JM, Enkemann SA, Tsao MS, Yeatman TJ, Gerald WL, Eschrich S, Jurisica I, Giordano TJ, Misek DE, Chang AC, Zhu CQ, Strumpf D, et al. Gene expression-based survival prediction in lung adenocarcinoma: a multi-site, blinded validation study. Nat Med. 2008; 14:822-827.
21. Fukui T, Okasaka T, Kawaguchi K, Fukumoto K, Nakamura S, Hakiri S, Ozeki N and Yokoi K. Conditional Survival After Surgical Intervention in Patients With Non-Small Cell Lung Cancer. Ann Thorac Surg. 2016; 101:1877-1882.
22. Yanagawa M, Tanaka Y, Kusumoto M, Watanabe S, Tsuchiya R, Honda O, Sumikawa H, Inoue A, Inoue M, Okumura M, Tomiyama N and Johkoh T. Automated assessment of malignant degree of small peripheral adenocarcinomas using volumetric CT data: correlation with pathologic prognostic factors. Lung Cancer. 2010; 70:286-294.
23. Uehara H, Tsutani Y, Okumura S, Nakayama H, Adachi S, Yoshimura M, Miyata Y and Okada M. Prognostic role of positron emission tomography and high-resolution computed tomography in clinical stage IA lung adenocarcinoma. Ann Thorac Surg. 2013; 96:1958-1965.
24. Tsutani Y, Miyata Y, Nakayama H, Okumura S, Adachi S, Yoshimura M and Okada M. Solid tumor size on high-resolution computed tomography and maximum standardized uptake on positron emission tomography for new clinical T descriptors with T1 lung adenocarcinoma. Ann Oncol. 2013; 24:2376-2381.
25. Nakayama H, Okumura S, Daisaki H, Kato Y, Uehara H, Adachi S, Yoshimura M and Okada M. Value of integrated positron emission tomography revised using a phantom study to evaluate malignancy grade of lung adenocarcinoma: a multicenter study. Cancer. 2010; 116:3170-3177.
26. Lee HY, Jeong JY, Lee KS, Kim HJ, Han J, Kim BT, Kim J, Shim YM, Kim JH and Song I. Solitary pulmonary nodular lung adenocarcinoma: correlation of histopathologic scoring and patient survival with imaging biomarkers. Radiology. 2012; 264:884-893.
27. Inoue M, Okumura M, Sawabata N, Miyaoka E, Asamura H, Yoshino I, Tada H, Fujii Y, Nakanishi Y, Eguchi K, Mori M, Kobayashi H and Yokoi K. Clinicopathological characteristics and surgical results of lung cancer patients aged up to 50 years: the Japanese Lung Cancer Registry Study 2004. Lung Cancer. 2014; 83:246-251.
28. Kasymjanova G, Correa JA, Kreisman H, Dajczman E, Pepe C, Dobson S, Lajeunesse L, Sharma R and Small D. Prognostic value of the six-minute walk in advanced non-small cell lung cancer. J Thorac Oncol. 2009; 4:602-607.
29. Chang JW, Asamura H, Kawachi R and Watanabe S. Gender difference in survival of resected non-small cell lung cancer: histology-related phenomenon? J Thorac Cardiovasc Surg. 2009; 137:807-812.
30. Park SY, Lee JG, Kim J, Bae MK, Lee CY, Kim DJ and Chung KY. The influence of smoking intensity on the clinicopathologic features and survival of patients with surgically treated non-small cell lung cancer. Lung Cancer. 2013; 81:480-486.
31. Barletta JA, Yeap BY and Chirieac LR. Prognostic significance of grading in lung adenocarcinoma. Cancer. 2010; 116:659-669.
32. Dong B, Sato M, Sagawa M, Endo C, Usuda K, Sakurada A, Wu S, Oyaizu T, Ishida I, Handa M and Kondo T. Computed tomographic image comparison between mediastinal and lung windows provides possible prognostic information in patients with small peripheral lung adenocarcinoma. J Thorac Cardiovasc Surg. 2002; 124:1014-1020.
33. Takamochi K, Nagai K, Yoshida J, Suzuki K, Ohde Y, Nishimura M, Sasaki S and Nishiwaki Y. Pathologic N0 status in pulmonary adenocarcinoma is predictable by combining serum carcinoembryonic antigen level and computed tomographic findings. J Thorac Cardiovasc Surg. 2001; 122:325-330.
34. Ohtsuka T, Nomori H, Watanabe K, Kaji M, Naruke T, Suemasu K and Uno K. Prognostic significance of [(18)F]fluorodeoxyglucose uptake on positron emission tomography in patients with pathologic stage I lung adenocarcinoma. Cancer. 2006; 107:2468-2473.
35. Okada M, Tauchi S, Iwanaga K, Mimura T, Kitamura Y, Watanabe H, Adachi S, Sakuma T and Ohbayashi C. Associations among bronchioloalveolar carcinoma components, positron emission tomographic and computed tomographic findings, and malignant behavior in small lung adenocarcinomas. J Thorac Cardiovasc Surg. 2007; 133:1448-1454.
36. Takahashi M, Shigematsu Y, Ohta M, Tokumasu H, Matsukura T and Hirai T. Tumor invasiveness as defined by the newly proposed IASLC/ATS/ERS classification has prognostic significance for pathologic stage IA lung adenocarcinoma and can be predicted by radiologic parameters. J Thorac Cardiovasc Surg. 2014; 147:54-59.
37. Sakao Y, Kuroda H, Mun M, Uehara H, Motoi N, Ishikawa Y, Nakagawa K and Okumura S. Prognostic significance of tumor size of small lung adenocarcinomas evaluated with mediastinal window settings on computed tomography. PLoS One. 2014; 9:e110305.
38. Higashi K, Ueda Y, Ayabe K, Sakurai A, Seki H, Nambu Y, Oguchi M, Shikata H, Taki S, Tonami H, Katsuda S and Yamamoto I. FDG PET in the evaluation of the aggressiveness of pulmonary adenocarcinoma: correlation with histopathological features. Nucl Med Commun. 2000; 21:707-714.