
INTRODUCTION
Hepatitis C virus (HCV) is a blood-borne virus and its infection imposes a global health burden in both developed and developing countries [1]. HCV is a major cause of advanced liver-related outcomes such as cirrhosis, hepatocellular carcinoma and a growing spectrum of extra-hepatic complications such as dermatological, rheumatological and haematological disorders, as well as kidney insufficiency [2, 3]. It is estimated that nearly half of HCV-seropositive patients are diagnosed to experience at least one extra-hepatic complication [4]. There is competing evidence that HCV has the feasibility of entry and replication in kidney tissue, ending up with many severe endpoints such as acute interstitial nephritis and focal segmental sclerosis [5]. Echoing from epidemiological observations, there was a close relationship between HCV infection and chronic kidney disease (CKD), while current literature is teeming with inconsistent results, with positive association being reported in some [6, 7] but not all [8, 9] studies. CKD was defined as kidney damage (the presence of albuminuria) or decreased estimated glomerular filtration rate (eGFR < 60 ml/min/1.73 m2). A previous meta-analysis by Fabrizi et al summarized the predisposition of HCV-infected patients to CKD and they failed to produce any observable significance [10]. More recently, Park et al [11] and Fabrizi et al [12] have separately conducted an updated meta-analysis of this project and demonstrated an increased risk for the development of CKD in HCV-infected patients compared to uninfected individuals. In view of these inconclusive findings, a comprehensive assessment is urgently required and we hence hypothesized that HCV infection was a significant risk factor for the development of CKD. To explore this hypothesis further, after de novo evaluation, we identified additional five articles in English-language literature that were not incorporated in previous meta-analyses [10-12]. In addition, considering the intractable confounding or recall bias inherited in cross-sectional studies, we determined to meta-analytically assess the predisposition of HCV infection to the occurrence and severity of CKD separately in cross-sectional and longitudinal studies, and further seek other possible interpretations for the obvious heterogeneity obsessing existing meta-analyses.
RESULTS
Eligible studies and characteristics
The selection process of all eligible studies is shown in Supporting Figure S1. A total of 545 articles were identified after searching four electronic databases with predefined key terms, and 22 eligible articles involving 12 longitudinal studies (1,972,044 subjects) and 15 cross-sectional studies (937,607 subjects) were finally analyzed [6-9, 13-30]. After treating the studies with different eGFR cutoffs (eGFR < 60, < 30, < 15 ml/min/1.73m2) and/or proteinuria individually, there were 38 studies (5,077,110 subjects, 15 longitudinal studies and 23 cross-sectional studies) in the corresponding subgroup analysis and their study characteristics are presented in Table 1 and Table 2.
The number of studies testing the prevalence or incidence of proteinuria, eGFR < 60, < 30 and < 15 ml/min/1.73m2 was 7, 21, 4 and 6, respectively. Twenty-five of 38 studies were conducted in the U.S., 9 in Taiwan, 2 in Japan and 2 in European countries. Adjusted effect estimate and its 95% CI were reported in 23 studies. In 15 longitudinal studies, the median follow-up period ranged from 2.1 years [9] to 9.3 years [8].
Table 1: The baseline characteristics of all qualified studies enrolled in this meta-analysis
Author (Index) (year) |
Country |
Collection time |
Cohort sample size |
Included sample size |
Definition |
Median follow-up (years) |
Unexposed |
Exposed |
||
Total |
Events |
Total |
Events |
|||||||
Cross-sectional studies |
||||||||||
Liangpunsakul (2005) |
US |
1988-1994 |
15,336 |
1,357 |
Proteinuria |
0 |
995 |
75 |
362 |
45 |
Huang et al (2006) |
Taiwan |
2002-2004 |
10,975 |
8,571 |
Proteinuria |
0 |
8,004 |
557 |
567 |
58 |
Tsui et al (2006) |
US |
1988-1994 |
34,000 |
15,029 |
eGFR<60 ml/min/1.73m2 |
0 |
14,663 |
631 |
366 |
8 |
Tsui et al (Proteinuria) (2006) |
US |
1988-1994 |
34,000 |
15,029 |
Proteinuria |
0 |
14,663 |
1,760 |
366 |
55 |
Dalrymple et al (2007) |
US |
1999-2004 |
39,574 |
25,782 |
eGFR<60 ml/min/1.73m2 |
0 |
23,854 |
1,423 |
1,928 |
93 |
Tsui et al (eGFR<60) (C) (2007) |
US |
2000-2001 |
2,352,584 |
474,369 |
eGFR<60 ml/min/1.73m2 |
0 |
421,495 |
71,654 |
52,874 |
4,759 |
Tsui et al (eGFR<30) (C) (2007) |
US |
2000-2001 |
2,352,584 |
474,369 |
eGFR<30 ml/min/1.73m2 |
0 |
421,495 |
8,430 |
52,874 |
1,058 |
Ishizaka et al (2008) |
Japan |
2004-2006 |
12,535 |
12,405 |
eGFR<60 ml/min/1.73m2 |
0 |
12,333 |
1,887 |
72 |
22 |
Ishizaka et al (Proteinuria) (2008) |
Japan |
2004-2006 |
12,535 |
12,405 |
Proteinuria |
0 |
12,333 |
1,157 |
72 |
14 |
Moe et al (C.-C.) (2008) |
US |
1994-2004 |
19,303 |
13,139 |
eGFR<60 ml/min/1.73m2 |
0 |
9,201 |
745 |
3,938 |
248 |
Asrani et al (eGFR<60) (C) (2010) |
US |
2003-2006 |
6,000,000 |
167,569 |
eGFR<60 ml/min/1.73m2 |
0 |
154,185 |
8,172 |
13,384 |
682 |
Asrani et al (eGFR<30) (C) (2010) |
US |
2003-2006 |
6,000,000 |
167,569 |
eGFR<30 ml/min/1.73m2 |
0 |
154,185 |
370 |
13,384 |
29 |
Asrani et al (eGFR<15) (C) (2010) |
US |
2003-2006 |
6,000,000 |
167,569 |
eGFR<15 ml/min/1.73m2 |
0 |
154,185 |
123 |
13,384 |
13 |
Gordon et al (2010) |
US |
1997-2006 |
79,492 |
67,063 |
eGFR<60 ml/min/1.73m2 |
0 |
64,006 |
6,666 |
3,057 |
443 |
Lee et al (eGFR<60) (2010) |
Taiwan |
2004 |
55,780 |
49,048 |
eGFR<60 ml/min/1.73m2 |
0 |
43,859 |
6,249 |
5,189 |
994 |
Lee et al (eGFR<30) (2010) |
Taiwan |
2004 |
55,780 |
49,048 |
eGFR<30 ml/min/1.73m2 |
0 |
43,859 |
333 |
5,189 |
56 |
Lee et al (Proteinuria) (2010) |
Taiwan |
2004 |
55,780 |
49,048 |
Proteinuria |
0 |
43,859 |
2,385 |
5,189 |
332 |
Yanik et al (2010) |
US |
1998-2008 |
4,376 |
900 |
Proteinuria |
0 |
129 |
13 |
772 |
210 |
Butt et al (C.-C.) (2011) |
US |
2001-2006 |
68,285 |
43,139 |
eGFR<60 ml/min/1.73m2 |
0 |
25,137 |
3,738 |
18,002 |
3,140 |
Satapathy et al (eGFR<60) (2012) |
US |
2003-2006 |
2,415 |
865 |
eGFR<60 ml/min/1.73m2 |
0 |
313 |
16 |
552 |
53 |
Li et al (2014) |
Taiwan |
2010-2011 |
24,642 |
24,642 |
eGFR<60 ml/min/1.73m2 |
0 |
22,943 |
1,398 |
1,699 |
280 |
Kurbanova (2015) |
US |
1999-2012 |
33,729 |
33,729 |
eGFR<60 ml/min/1.73m2 |
0 |
33,070 |
3,523 |
659 |
50 |
Kurbanova (Proteinuria) (2015) |
US |
1999-2012 |
33,729 |
33,729 |
Proteinuria |
0 |
33,070 |
4,183 |
659 |
112 |
Longitudinal studies |
||||||||||
Tsui et al (eGFR<15) (L.) (2007) |
US |
2000-2001 |
2,352,584 |
474,369 |
eGFR<15 ml/min/1.73m2 |
3.4 |
421,495 |
4,393 |
52,874 |
760 |
Moe et al (Long.) (2008) |
US |
1994-2004 |
19,303 |
7,038 |
eGFR<60 ml/min/1.73m2 |
3.5 |
4,795 |
NR |
2,243 |
NR |
Asrani et al (eGFR<60) (L) (2010) |
US |
2003-2006 |
6,000,000 |
88,822 |
eGFR<60 ml/min/1.73m2 |
2.1 |
80,759 |
2,826 |
8,063 |
306 |
Asrani et al (eGFR<30) (L) (2010) |
US |
2003-2006 |
6,000,000 |
88,822 |
eGFR<30 ml/min/1.73m2 |
2.1 |
80,759 |
56 |
8,063 |
10 |
Asrani et al (eGFR<15) (L) (2010) |
US |
2003-2006 |
6,000,000 |
88,822 |
eGFR<15 ml/min/1.73m2 |
2.1 |
80,759 |
8 |
8,063 |
2 |
Butt et al (Long.) (2011) |
US |
2001-2006 |
68,285 |
43,139 |
eGFR<60 ml/min/1.73m2 |
3.15 |
25,137 |
NR |
18,002 |
NR |
Hofmann et al (2011) |
Europe |
1990-2006 |
258,000 |
223,536 |
eGFR<60 ml/min/1.73m2 |
9.3 |
198,124 |
443 |
25,412 |
208 |
Satapathy et al (eGFR<15) (2012) |
US |
2003-2006 |
2,415 |
865 |
eGFR<15 ml/min/1.73m2 |
7 |
313 |
2 |
552 |
15 |
Peters et al (2012) |
Europe |
1994-2011 |
16,594 |
8,235 |
eGFR<60 ml/min/1.73m2 |
4.39 |
6,183 |
375 |
2,052 |
120 |
Su et al (2012) |
Taiwan |
2000-2005 |
1,000,000 |
37,746 |
eGFR<15 ml/min/1.73m2 |
5.58 |
31,455 |
196 |
6,291 |
77 |
Chen et al (2013) |
Taiwan |
1998-2004 |
1,000,000 |
15,910 |
eGFR<60 ml/min/1.73m2 |
5.92 |
12,728 |
187 |
3,182 |
64 |
Chen et al (2014) |
Taiwan |
1996-2010 |
1,000,000 |
47,150 |
eGFR<60 ml/min/1.73m2 |
7.43 |
37,720 |
960 |
9,430 |
367 |
Lee et al (2014) |
Taiwan |
2002-2009 |
4,321 |
4,185 |
eGFR<60 ml/min/1.73m2 |
2.2 |
3,868 |
891 |
317 |
118 |
Molnar et al (eGFR<60) (2015) |
US |
2004-2006 |
4,444,699 |
1,021,049 |
eGFR<60 ml/min/1.73m2 |
8 |
920,531 |
95,837 |
100,518 |
11,271 |
Molnar et al (eGFR<15) (2015) |
US |
2005-2006 |
4,444,699 |
1,021,049 |
eGFR<15 ml/min/1.73m2 |
8 |
920,531 |
2,479 |
100,518 |
904 |
Note. (C): cross-sectional studies; (L): longitudinal studies; CKD, chronic kidney disease; eGFR: estimated glomerular filtration rate; NR: not reported.
Table 2: The baseline characteristics of all study populations included in this meta-analysis
Author (Index) (year) |
EE*; 95% CI |
Adj-EE*; 95% CI |
Age (years) |
Male (%) |
DM |
Hypertension |
||||
Unexpo. |
Expo. |
Unexpo. |
Expo. |
Unexpo. |
Expo. |
Unexpo. |
Expo. |
|||
Cross-sectional studies |
||||||||||
Liangpunsakul (2005) |
1.51; 1.67-2.15 |
1.99; 1.38-2.85 |
43 |
43 |
61 |
62 |
4.7 |
10.5 |
25 |
32 |
Huang et al (2006) |
1.52; 1.15-2.03 |
NR |
55.2 |
55.2 |
43.2 |
43.2 |
12.5 |
12.5 |
33.4 |
33.4 |
Tsui et al (2006) |
0.45; 0.24-0.85 |
0.89; 0.49-1.62 |
NR |
NR |
47.00 |
67.00 |
5.00 |
5.00 |
31.00 |
27.00 |
Tsui et al (Proteinuria) (2006) |
1.29; 0.86-1.93 |
1.38; 0.91-2.07 |
NR |
NR |
47.00 |
67.00 |
5.00 |
5.00 |
31.00 |
27.00 |
Dalrymple et al (2007) |
1.08; 0.88-1.33 |
1.08; 0.88-1.33 |
58.00 |
53.00 |
91.00 |
96.00 |
22.00 |
19.00 |
69.00 |
61.00 |
Tsui et al (eGFR<60) (C) (2007) |
0.48; 0.47-0.50 |
NR |
59.00 |
52.00 |
94.00 |
97.00 |
26.00 |
21.00 |
59.00 |
47.00 |
Tsui et al (eGFR<30) (C) (2007) |
1.00; 0.94-1.07 |
NR |
59.00 |
52.00 |
94.00 |
97.00 |
26.00 |
21.00 |
59.00 |
47.00 |
Ishizaka et al (2008) |
2.46; 1.54-3.94 |
1.83; 1.10-3.05 |
53.1 |
59.2 |
64.19 |
62.5 |
NR |
NR |
NR |
NR |
Ishizaka et al (Proteinuria) (2008) |
2.33; 1.30-4.19 |
2.00; 1.06-3.76 |
53.1 |
59.2 |
64.19 |
62.5 |
NR |
NR |
NR |
NR |
Moe et al (C.-C.) (2008) |
0.76; 0.66-0.89 |
0.69; 0.62-0.77 |
41.20 |
43.60 |
44.10 |
60.40 |
22.60 |
23.40 |
46.50 |
50.80 |
Asrani et al (eGFR<60) (C) (2010) |
0.92; 0.79-1.08 |
0.92; 0.79-1.08 |
40.40 |
47.80 |
43.80 |
60.10 |
6.70 |
9.60 |
7.60 |
9.70 |
Asrani et al (eGFR<30) (C) (2010) |
0.90; 0.62-1.32 |
NR |
40.40 |
47.80 |
43.80 |
60.10 |
6.70 |
9.60 |
7.60 |
9.70 |
Asrani et al (eGFR<15) (C) (2010) |
1.22; 0.69-2.16 |
NR |
40.40 |
47.80 |
43.80 |
60.10 |
6.70 |
9.60 |
7.60 |
9.70 |
Gordon et al (2010) |
1.46; 1.31-1.62 |
NR |
48.00 |
52.00 |
48.20 |
62.30 |
NR |
NR |
NR |
NR |
Lee et al (eGFR<60) (2010) |
1.36; 1.27-1.46 |
1.26; 1.17-1.38 |
60.80 |
64.30 |
31.00 |
29.30 |
9.70 |
10.50 |
31.00 |
32.70 |
Lee et al (eGFR<30) (2010) |
1.43; 1.07-1.90 |
NR |
60.80 |
64.30 |
31.00 |
29.30 |
9.70 |
10.50 |
31.00 |
32.70 |
Lee et al (Proteinuria) (2010) |
1.19; 1.06-1.34 |
1.14; 1.00-1.3 |
60.80 |
64.30 |
31.00 |
29.30 |
9.70 |
10.50 |
31.00 |
32.70 |
Yanik et al (2010) |
2.07; 1.59-4.58 |
1.84; 1.03-3.27 |
48.9 |
48.9 |
65.4 |
65.4 |
10.8 |
10.8 |
38.7 |
38.7 |
Butt et al (C.-C.) (2011) |
1.21; 1.15-1.27 |
NR |
52.80 |
51.90 |
97.30 |
97.30 |
26.60 |
22.90 |
60.80 |
52.40 |
Satapathy et al (eGFR<60) (2012) |
1.97; 1.11-3.51 |
NR |
50.00 |
50.00 |
64.20 |
68.30 |
16.30 |
19.00 |
37.40 |
39.30 |
Li et al (2014) |
1.24; 1.05-1.48 |
1.24; 1.05-1.48 |
41.70 |
42.40 |
52.80 |
42.40 |
NR |
NR |
NR |
NR |
Kurbanova (2015) |
0.69; 0.47-1.02 |
0.88; 0.57-1.37 |
49.5 |
50.8 |
48 |
63.9 |
12.2 |
14.4 |
36.4 |
43.7 |
Kurbanova (Proteinuria) (2015) |
1.40; 1.08-1.81 |
1.50; 1.08-2.08 |
49.5 |
50.8 |
48 |
63.9 |
12.2 |
14.4 |
36.4 |
43.7 |
Longitudinal studies |
||||||||||
Tsui et al (eGFR<15) (L.) (2007) |
1.39; 1.28-1.50 |
1.68; 1.54-1.82 |
59.00 |
52.00 |
94.00 |
97.00 |
26.00 |
21.00 |
59.00 |
47.00 |
Moe et al (Long.) (2008) |
0.90; 0.79-1.02 |
0.90; 0.79-1.02 |
41.30 |
44.10 |
45.40 |
58.20 |
18.20 |
19.90 |
41.70 |
44.70 |
Asrani et al (eGFR<60) (L) (2010) |
1.09; 0.97-1.23 |
NR |
43.20 |
48.70 |
40.80 |
59.20 |
10.30 |
12.40 |
11.10 |
12.30 |
Asrani et al (eGFR<30) (L) (2010) |
1.79; 0.91-3.51 |
NR |
43.20 |
48.70 |
40.80 |
59.20 |
10.30 |
12.40 |
11.10 |
12.30 |
Asrani et al (eGFR<15) (L) (2010) |
2.50; 0.53-11.8 |
NR |
43.20 |
48.70 |
40.80 |
59.20 |
10.30 |
12.40 |
11.10 |
12.30 |
Butt et al (Long.) (2011) |
1.30; 1.23-1.37 |
1.30; 1.23-1.37 |
52.80 |
51.90 |
97.30 |
97.30 |
26.60 |
22.90 |
60.80 |
52.40 |
Hofmann et al (2011) |
3.68; 3.12-4.34 |
NR |
NR |
37.60 |
69.10 |
69.10 |
NR |
3.70 |
NR |
NR |
Satapathy et al (eGFR<15) (2012) |
4.34; 0.99-19.12 |
NR |
50.00 |
50.00 |
64.20 |
68.30 |
16.30 |
19.00 |
37.40 |
39.30 |
Peters et al (2012) |
0.96; 0.78-1.19 |
NR |
42.00 |
39.00 |
75.90 |
67.80 |
4.80 |
3.70 |
25.90 |
14.70 |
Su et al (2012) |
1.53; 1.17-2.01 |
1.53; 1.17-2.01 |
NR |
NR |
50.50 |
50.50 |
NR |
NR |
NR |
NR |
Chen et al (2013) |
1.75; 1.27-2.43 |
1.75; 1.27-2.43 |
NR |
NR |
50.90 |
50.90 |
7.70 |
0.00 |
13.60 |
0.00 |
Chen et al (2014) |
1.28; 1.12-1.46 |
1.28; 1.12-1.46 |
NR |
NR |
49.60 |
49.60 |
14.40 |
25.20 |
28.60 |
34.10 |
Lee et al (2014) |
1.32; 1.07-1.62 |
1.32; 1.07-1.62 |
61.77 |
64.53 |
59.40 |
47.60 |
35.60 |
43.50 |
11.10 |
9.20 |
Molnar et al (eGFR<60) (2015) |
1.15; 1.12-1.17 |
1.15; 1.12-1.17 |
55.00 |
53.00 |
92.00 |
96.00 |
21.00 |
21.00 |
54.00 |
53.00 |
Molnar et al (eGFR<15) (2015) |
1.98; 1.81-2.16 |
1.98; 1.81-2.16 |
55.00 |
53.00 |
92.00 |
96.00 |
21.00 |
21.00 |
54.00 |
53.00 |
Note. (C): cross-sectional studies; (L): longitudinal studies; Unexpo.: unexposed; Expo.: exposed; eGFR: estimated glomerular filtration rate; EE: effect estimate; Adj-EE: adjusted effect estimate; 95% CI: 95% confidence interval; NR: not reported. *EE refers to odds ratio in cross-sectional studies and hazard ratio in longitudinal studies.
Effect estimates
Considering the methodological distinction between cross-sectional and longitudinal studies, we analyzed them separately in this study. To avoid repeated incorporation, only study with eGFR < 60 ml/min/1.73m2 was retained in case of different eGFR cutoffs recorded in the same article, and there were 12 and 15 unduplicated studies with longitudinal and cross-sectional designs, respectively. Overall effect estimate was remarkably significant in longitudinal studies (HR, 95% CI, P : 1.45, 1.23-1.71, < 0.001), in contrast to that in cross-sectional studies (OR, 95% CI, P : 1.25, 0.90-1.73, 0.188), while there was strong evidence of heterogeneity (both I2 > 95%) (Figure 1). The power to identify the significant association in longitudinal studies was over 99.9%. After restricting analysis to the studies with adjusted effect estimates, the magnitude of risk was weakened, but significance was still persisted in 8 longitudinal studies (HR, 95% CI, P : 1.31, 1.15-1.48, < 0.001), relative to that in 10 cross-sectional studies (OR, 95% CI, P : 1.15, 0.93-1.43, 0.197), with obvious heterogeneity (both I2 > 90%).
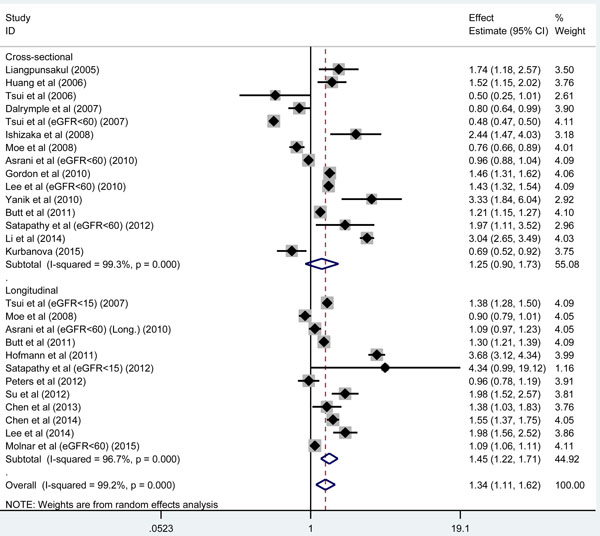
Figure 1: The forest plot for the prevalence and incidence of CKD conferred by the presence of HCV infection. The effect estimate (odds ratio [OR]) is presented by the vertical central axis of the solid diamond for each study, and its 95% confidence interval (CI) is denoted by the left and right extremes of the horizontal central line through the solid diamond. The vertical broken axis of the hollow diamond represents the overall effect estimate. The solid vertical line is set at the null effect estimate (OR = 1.0). The left and right of x-axis represent the decreased and increased CKD risk, respectively.
To investigate the impact of specific clinical differences between studies, we performed a set of stratified analyses according to CKD subtype, country and median follow-up period (for longitudinal studies only), respectively (Table 3). By CKD subtype, the analysis was based on 38 studies as mentioned above. HCV infection was associated with an 1.54-fold increased risk (OR, 95% CI, P : 1.54, 1.27-1.87, < 0.001) of having proteinuria in 7 cross-sectional studies, while no significance was observed in studies with eGFR of different cutoffs (P > 0.05). In longitudinal studies, a graded increased risk for incident CKD was noticed with reduced eGFR, that is, for eGFR of less than 60, 30 and 15 ml/min/1.73m2, the corresponding HR was 1.39 (95% CI, P: 1.14-1.69, 0.001) in 9 studies, 1.79 (95% CI, P: 0.91-3.51, 0.091) in 1 study and 2.30 (95% CI, P: 1.26-4.19, 0.007) in 5 studies, and there was no improvement in heterogeneity.
By country, the presence of HCV infection was associated with an 1.99-fold (95% CI, P : 1.23-3.20, 0.005) and 1.69-fold (95% CI, P : 1.44-1.98, < 0.001) increased risk of the prevalent (4 cross-sectional studies) and incident (4 longitudinal studies) CKD in East Asian countries (Taiwan and Japan), respectively (Table 3). Moreover in 6 U.S. longitudinal studies, the risk for incident CKD was marginally significant (HR, 95% CI, P: 1.15, 1.02-1.31, 0.026) and I2 was 92.8%. When the longitudinal studies were further grouped by median follow-up time at 5 years, the effect estimate was reinforced in long-term studies (HR, 95% CI, P: 1.86, 1.19-2.89, 0.006; I2 = 98.1%) relative to that in short-term studies (HR, 95% CI, P: 1.21, 1.03-1.43, 0.024; I2 = 92.0%).
Table 3: Summary on stratified analyses according to country, CKD definition and median follow-up period respectively in cross-sectional and longitudinal studies
Subgroups |
Cross-sectional studies |
Longitudinal studies |
||||
Number of studies |
OR, 95% CI, P |
I2 |
Number of studies |
HR, 95% CI, P |
I2 |
|
Country |
||||||
East Asia |
4 |
1.99, 1.23-3.20, 0.005 |
96.7% |
4 |
1.69, 1.44-1.98, <0.001 |
54.2% |
U.S. |
11 |
1.04, 0.74-1.48, 0.811 |
99.2% |
6 |
1.15, 1.02-1.31, 0.026 |
92.8% |
Europe |
0 |
NR |
NR |
2 |
1.89, 0.51-7.03, 0.345 |
99.0% |
CKD definition |
||||||
Proteinuria |
7 |
1.54, 1.27-1.87, <0.001 |
68.7% |
0 |
NR |
NR |
eGFR <60 ml/min/1.73m2 |
12 |
1.11, 0.77-1.60, 0.567 |
99.4% |
9 |
1.39, 1.14-1.69, 0.001 |
97.3% |
eGFR <30 ml/min/1.73m2 |
3 |
1.08, 0.86-1.38, 0.502 |
67.1% |
1 |
1.79, 0.91-3.51, 0.091 |
NR |
eGFR <15 ml/min/1.73m2 |
1 |
1.22, 0.69-2.16, 0.500 |
NR |
5 |
2.30, 1.26-4.19, 0.007 |
98.4% |
Median follow-up period |
||||||
<5 years |
NR |
NR |
NR |
6 |
1.21, 1.03-1.43, 0.024 |
92.0% |
≥5 years |
NR |
NR |
NR |
6 |
1.86, 1.19-2.89, 0.006 |
98.1% |
Notes. CKD: chronic kidney disease; eGFR: estimated glomerular filtration rate; OR: odds ratio; HR: hazard ratio; 95% CI: 95% confidence interval; I2: inconsistency index; NR: not reported.
Meta-regression analyses
First, we one by one modeled all possible confounders including age, gender, diabetes mellitus, hypertension, country, CKD subtype and follow-up period (for longitudinal studies only), and interestingly found that the risk for incident CKD was significantly associated with the increased percentages of males (P = 0.020) and diabetes mellitus (P = 0.005), as well as the reduced eGFR (P = 0.017) and increased follow-up time (P = 0.002, Figure 2). We next modeled all possible confounders simultaneously and failed to detect any observable significance, which was likely attributed to the fact that meta-regression did not have the methodological rigor of a properly-designed study that was intended to test the effect of these covariates formally despite its capability to consider various covariates [31].
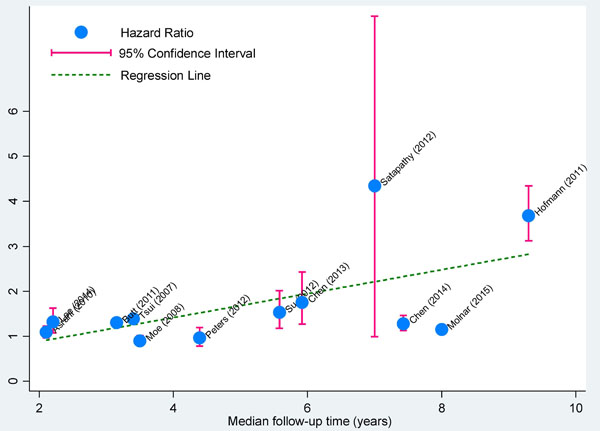
Figure 2: Correlation plot of median follow-up time with effect estimates in longitudinal studies.
Publication bias
The filled funnel plots that reflected the evidence of selective publication are provided in Figure 3. The Egger’s test suggested a marginally significant probability of publication bias for both longitudinal studies (P = 0.054) and cross-sectional (P = 0.064). As estimated, there were respectively 3 and 6 missing studies required to make the filled funnel plots symmetrical in longitudinal and cross-sectional studies. To account for the impact of these possible missing studies on the overall effect estimates, we employed the trim-and-fill analysis and identified a reduced risk conferred by HCV infection for prevalent CKD in simulated 21 cross-sectional studies (OR, 95% CI, P: 0.79, 0.59-1.06, 0.121), but an increased risk for incident CKD in simulated 16 longitudinal studies (HR, 95% CI, P: 1.16, 0.96-1.39, 0.118).
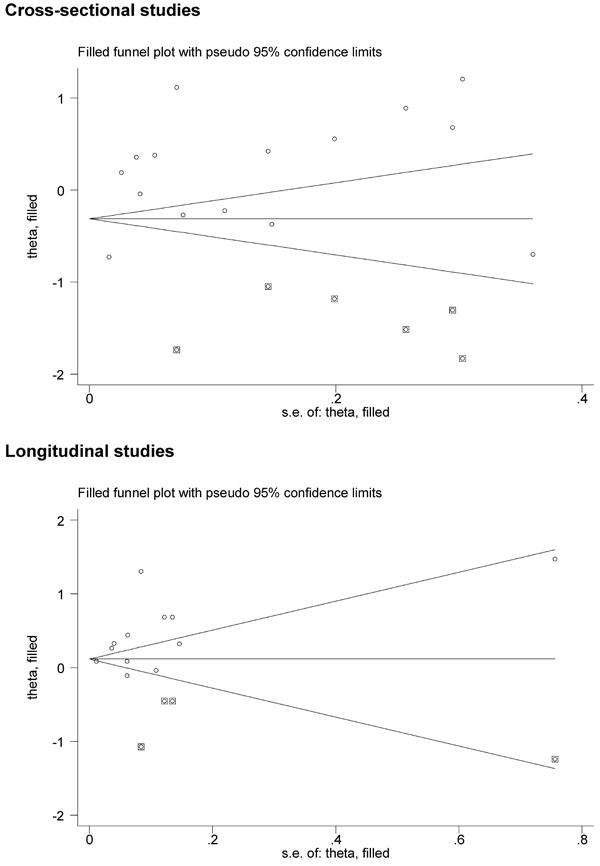
Figure 3: The filled funnel plots for the prevalence and incidence of CKD conferred by the presence of HCV infection. Actual studies are denoted by the hollow circles, and potential missing studies in need to achieve symmetry are denoted by the solid squares. The theta in the y-axis represents the log(odds ratio) for cross-sectional studies and the log(hazard ratio) for longitudinal studies. The s.e. of theta in the x-axis represents the standard error of log(odds ratio or hazard ratio).
DISCUSSION
The most noteworthy finding of this meta-analysis is the significant risk of experiencing incident CKD after HCV infection, with the lower eGFR and longer HCV exposure time entailing a greater risk. As far as we know, this is to-date the largest comprehensive met-analysis that has assessed the predisposition of HCV exposure to the occurrence and severity of CKD in the current literature.
As opposed to the significant effect estimate in cross-sectional studies in the latest meta-analysis by Park et al [11], we utilized a large sample size and failed to support the contributory role of HCV infection in the prevalence of CKD, in agreement with another recent more comprehensive meta-analysis by Fabrizi et al [12]. Although we and Fabrizi et al [12] both observed the independent predictive capability of HCV infection for prevalent proteinuria, we additionally identified a graded risk for incident CKD with the lower eGFR and longer HCV exposure time. This tendency is clinically plausible as HCV infection was associated with a wide range of extra-hepatic manifestations in various organs including the kidneys and it is highly prevalent among CKD patients under hemodialysis and in kidney transplantation recipients [32]. Also this finding lent some indirect credence for the likely detrimental impact of HCV infection in the development of CKD. In theory, several possible pathways have been proposed for the predisposition of HCV to extra-hepatic manifestations. Experimental data indicated that HCV can be conveyed by infected B-lymphocytes or exosomes to enter renal tissue for replication [33, 34] and cause kidney injury through cryoglobulins, HCV-antibody immune complexes, or amyloid deposition [5]. Moreover, many ingredients required for HCV attachment were found to be abundantly expressed in renal parenchyma [5]. Although the exact molecular mechanisms of how HCV infection entails the risk of CKD remain unclear, it is possible that systemic immune response to HCV infection might be one of the pathophysiological mechanisms.
A note of caution, however, should be made when interpreting our findings, because unexpectedly HCV exposure was nonsignificantly associated with the prevalence of CKD when analysis was restricted to cross-sectional studies. Some studies even observed that HCV infection was a protective factor for the prevalence of CKD [6, 7, 15, 16, 30]. By contrast in longitudinal studies, HCV-infected individuals had a 45% significantly increased risk of experiencing incident CKD after adjusting for traditional risk factors during 2 to 9 years of follow-up and even restricting analysis to multivariate-adjusted effect estimates. Actually, it is not uncommon in the literature to encounter such divergence between longitudinal and cross-sectional designs, even in the same study population. For example, HCV infection was associated with an increased risk of incident end stage renal disease (ESRD, eGFR < 15 ml/min/1.73m2), but a reduced risk of prevalent CKD (eGFR < 60 ml/min/1.73m2) in the study by Tsui et al [16]. A possible explanation for this case is that most sources of error due to confounding and bias are more common in cross-sectional studies than in longitudinal studies. For this reason, the findings from cross-sectional studies are often criticized. Moreover, such divergence between longitudinal and cross-sectional studies may also be proposed as a rational explanation for the negative correlation between HCV infection and CKD risk observed in the previous meta-analysis by Fabrizi et al [10].
Several possible limitations should be acknowledged for the interpretation of our meta-analytical findings. Firstly, we selected eligible studies from only English-language literature, and some well-designed studies published in the other languages might introduce a possible selection bias. Secondly, we cannot fully rule out all potential biases due to the unavailability of individual participant data in this study. Thirdly, although stratified and meta-regression analyses were conducted to explore and interpret diversity among the results of different studies, there was still no material improvement in heterogeneity. Fourthly, both filled funnel plots and Egger’s tests indicated moderate evidence of publication bias; however taking into account the number and potential outcome of missing studies in the trim-and-fill analysis still produced significant effect sizes. Fifthly, it must be emphasized that nearly all eligible studies in this meta-analysis were conducted in the U.S. and Taiwan, thus the application of our findings cannot be extrapolated to populations in other continents.
In conclusion, this meta-analysis of 22 articles provides strong evidence for the significant risk of experiencing incident CKD after HCV infection, with the lower eGFR and longer HCV exposure time entailing a greater risk. It is of clinical importance to elucidate the molecular mechanisms underlying the HCV infection-CKD relationship, which will constitute an extremely promising field in life sciences. Importantly, treatment of HCV infection in CKD patients still remains a clinical challenge.
materials and METHODS
Checklist
The conduct of this meta-analysis adheres to the guidelines listed in the Preferred Reporting Items for Systematic Reviews and Meta-Analyses (PRISMA) statement [35] (see the PRISMA checklist in Supporting Table S1).
Search strategies
To ensure comprehensive literature coverage, we searched electronic databases including Medline (PubMed), EMBASE, Web of Science and Google-Scholar as of July 14, 2016 using the key terms ‘hepatitis C’, ‘HCV’, ‘anti-HCV positive status’, ‘chronic kidney disease’, ‘renal disease’, ‘CKD’, ‘renal/kidney impairment’, ‘renal/kidney insufficiency’, ‘renal/kidney failure’, ‘proteinuria’ and ‘microalbuminuria’. As a primary need, all potential articles gathered must be published in English language and performed in human beings. The reference lists of major original articles and reviews were manually checked to avoid potential missing hits.
Inclusion criteria
The retrieved article was included if a cross-sectional or longitudinal study was designed to assess the incidence or prevalence of CKD or its graded stages in HCV-infected patients in comparison with controls who were not infected by HCV. The primary effect size was, if available, the ultimately-adjusted odds ratio (OR) or hazard ratio (HR) and the corresponding 95% confidence interval (95% CI), or was derived from a 2×2 contingency table with the counts of subjects with and without CKD under the presence or absence of HCV infection.
Article selection
Based on pre-determined selection criteria, two authors (Min Li and Peiyuan Wang) independently identified eligible articles by reviewing the title or abstract of each retrieved article and if necessary the full text. If an article provided data on the basis of both cross-sectional and longitudinal scenarios or specific CKD stages, each was analyzed separately.
Data abstraction
From each eligible article, two authors (Min Li and Peiyuan Wang) were in charge of abstracting pre-determined relevant information according to the results of within-group discussion and for the sake of accuracy this process was independently completed and checked for consistency. Any disagreement was settled with a consensus reached.
Abstracted data included first author’s surname, year in publication, cohort or population name, follow-up time, the country where study subjects were enrolled, race/ethnicity, sample size, study design, the cutoff of eGFR to define CKD, adjusted effect estimate and its 95% CI, the counts of subjects with and without CKD under the presence or absence of HCV infection, age, gender, hypertension and diabetes mellitus if available.
Statistical analyses
The effect-size estimate of each independent study was summarized in random-effects model that used the DerSimonian and Laird method [36]. The magnitude of between-study heterogeneity was represented by inconsistency index (I2) statistic, which is defined as the percentage of observed variability between studies that can be explained by heterogeneity rather than a chance finding. Stratified analyses by study design (cross-sectional studies and longitudinal studies), country (the U.S., East Asia and Europe) and median follow-up time (in longitudinal studies only: short-term: < 5 years and long-term: ≥ 5 years). Meta-regression analyses were further conducted to account for potential sources of clinical heterogeneity. The probability of publication bias was visually inspected by the filled funnel plots and statistically examined by the Egger’s test at a significance level of 5%. The meta-analytical programs implemented in STATA software (StataCorp, TX, version 13.0) were employed for above statistical analyses. In addition, study power was estimated by the Power and Sample Size Calculations (PS) software (version 3.0) [37].
CONFLICTS OF INTEREST
The authors declare no conflicts of interest.
FUNDING
This work is supported by the Taishan Scholars Construction Engineering, National Natural Science Foundation of China (81400771, 81171303, 31671139), Shandong Provincial Natural Science Foundation (ZR2014HL033), Shandong Provincial Science & Technology Plan (J14LE01, J15LK03), Yantai Science & Technology Plan (2015ZH083) and Binzhou Medical University Scientific Research Funds (BY2013KYQD17, BY2013KYQD18).
Author contributions
XL, JM, GT planned and designed the study, and directed its implementation; JM, GT drafted the protocol; ML, PW contributed to data acquisition; CY, WJ, XW, XM, GT did the data preparation, quality control and data analysis; JM, GT wrote the manuscript. All authors approved the final version of the submitted manuscript.
REFERENCES
1. El-Shabrawi MH and Kamal NM. Burden of pediatric hepatitis C. World J Gastroenterol. 2013; 19:7880-7888.
2. Hu J, Xu Y, Li C, Hao J, Peng S, Chu X, Zhang D, Xu D and Meng S. A cross-talk between Hepatitis B virus and host mRNAs confers viral adaptation to liver. Sci Rep. 2015; 5:10572.
3. Littera R, Zamboni F, Tondolo V, Fantola G, Chessa L, Orru N, Sanna M, Valentini D, Cappai L, Mulargia M, Caocci G, Arras M, Floris A, Orru S, La Nasa G and Carcassi C. Absence of activating killer immunoglobulin-like receptor genes combined with hepatitis C viral genotype is predictive of hepatocellular carcinoma. Hum Immunol. 2013; 74:1288-1294.
4. Forns X, Bukh J and Purcell RH. The challenge of developing a vaccine against hepatitis C virus. J Hepatol. 2002; 37:684-695.
5. Barsoum RS. Hepatitis C virus: from entry to renal injury—facts and potentials. Nephrol Dial Transplant. 2007; 22:1840-1848.
6. Moe SM, Pampalone AJ, Ofner S, Rosenman M, Teal E and Hui SL. Association of hepatitis C virus infection with prevalence and development of kidney disease. Am J Kidney Dis. 2008; 51:885-892.
7. Dalrymple LS, Koepsell T, Sampson J, Louie T, Dominitz JA, Young B and Kestenbaum B. Hepatitis C virus infection and the prevalence of renal insufficiency. Clin J Am Soc Nephrol. 2007; 2:715-721.
8. Hofmann JN, Torner A, Chow WH, Ye W, Purdue MP and Duberg AS. Risk of kidney cancer and chronic kidney disease in relation to hepatitis C virus infection: a nationwide register-based cohort study in Sweden. Eur J Cancer Prev. 2011; 20:326-330.
9. Asrani SK, Buchanan P, Pinsky B, Rey LR, Schnitzler M and Kanwal F. Lack of association between hepatitis C infection and chronic kidney disease. Clin Gastroenterol Hepatol. 2010; 8:79-84.
10. Fabrizi F, Martin P, Dixit V and Messa P. Hepatitis C virus infection and kidney disease: a meta-analysis. Clin J Am Soc Nephrol. 2012; 7:549-557.
11. Park H, Adeyemi A, Henry L, Stepanova M and Younossi Z. A meta-analytic assessment of the risk of chronic kidney disease in patients with chronic hepatitis C virus infection. J Viral Hepat. 2015; 22:897-905.
12. Fabrizi F, Verdesca S, Messa P and Martin P. Hepatitis C Virus Infection Increases the Risk of Developing Chronic Kidney Disease: A Systematic Review and Meta-Analysis. Dig Dis Sci. 2015.
13. Liangpunsakul S and Chalasani N. Relationship between hepatitis C and microalbuminuria: results from the NHANES III. Kidney Int. 2005; 67:285-290.
14. Huang JF, Chuang WL, Dai CY, Ho CK, Hwang SJ, Chen SC, Lin ZY, Wang LY, Chang WY and Yu ML. Viral hepatitis and proteinuria in an area endemic for hepatitis B and C infections: another chain of link? J Intern Med. 2006; 260:255-262.
15. Tsui JI, Vittinghoff E, Shlipak MG and O’Hare AM. Relationship between hepatitis C and chronic kidney disease: results from the Third National Health and Nutrition Examination Survey. J Am Soc Nephrol. 2006; 17:1168-1174.
16. Tsui JI, Vittinghoff E, Shlipak MG, Bertenthal D, Inadomi J, Rodriguez RA and O’Hare AM. Association of hepatitis C seropositivity with increased risk for developing end-stage renal disease. Arch Intern Med. 2007; 167:1271-1276.
17. Ishizaka N, Ishizaka Y, Seki G, Nagai R, Yamakado M and Koike K. Association between hepatitis B/C viral infection, chronic kidney disease and insulin resistance in individuals undergoing general health screening. Hepatol Res. 2008; 38:775-783.
18. Gordon SC, Moonka D, Brown KA, Rogers C, Huang MA, Bhatt N and Lamerato L. Risk for renal cell carcinoma in chronic hepatitis C infection. Cancer Epidemiol Biomarkers Prev. 2010; 19:1066-1073.
19. Lee JJ, Lin MY, Yang YH, Lu SN, Chen HC and Hwang SJ. Association of hepatitis C and B virus infection with CKD in an endemic area in Taiwan: a cross-sectional study. Am J Kidney Dis. 2010; 56:23-31.
20. Yanik EL, Lucas GM, Vlahov D, Kirk GD and Mehta SH. HIV and proteinuria in an injection drug user population. Clin J Am Soc Nephrol. 2010; 5:1836-1843.
21. Butt AA, Wang X and Fried LF. HCV infection and the incidence of CKD. Am J Kidney Dis. 2011; 57:396-402.
22. Satapathy SK, Lingisetty CS and Williams S. Higher prevalence of chronic kidney disease and shorter renal survival in patients with chronic hepatitis C virus infection. Hepatol Int. 2011.
23. Peters L, Grint D, Lundgren JD, Rockstroh JK, Soriano V, Reiss P, Grzeszczuk A, Sambatakou H, Mocroft A, Kirk O and Euro SiE. Hepatitis C virus viremia increases the incidence of chronic kidney disease in HIV-infected patients. AIDS. 2012; 26:1917-1926.
24. Su FH, Su CT, Chang SN, Chen PC, Sung FC, Lin CC and Yeh CC. Association of hepatitis C virus infection with risk of ESRD: a population-based study. Am J Kidney Dis. 2012; 60:553-560.
25. Chen YC, Chiou WY, Hung SK, Su YC and Hwang SJ. Hepatitis C virus itself is a causal risk factor for chronic kidney disease beyond traditional risk factors: a 6-year nationwide cohort study across Taiwan. BMC Nephrol. 2013; 14:187.
26. Chen YC, Lin HY, Li CY, Lee MS and Su YC. A nationwide cohort study suggests that hepatitis C virus infection is associated with increased risk of chronic kidney disease. Kidney Int. 2014; 85:1200-1207.
27. Lee JJ, Lin MY, Chang JS, Hung CC, Chang JM, Chen HC, Yu ML and Hwang SJ. Hepatitis C virus infection increases risk of developing end-stage renal disease using competing risk analysis. PLoS One. 2014; 9:e100790.
28. Li WC, Lee YY, Chen IC, Wang SH, Hsiao CT and Loke SS. Age and gender differences in the relationship between hepatitis C infection and all stages of Chronic kidney disease. J Viral Hepat. 2014; 21:706-715.
29. Molnar MZ, Alhourani HM, Wall BM, Lu JL, Streja E, Kalantar-Zadeh K and Kovesdy CP. Association of hepatitis C virus infection with incidence and progression of chronic kidney disease in a large cohort of US veterans. Hepatology. 2014.
30. Kurbanova N and Qayyum R. Association of Hepatitis C Virus Infection with Proteinuria and Glomerular Filtration Rate. Clin Transl Sci. 2015.
31. Thompson SG and Higgins JP. How should meta-regression analyses be undertaken and interpreted? Stat Med. 2002; 21:1559-1573.
32. Carvalho-Filho RJ, Feldner AC, Silva AE and Ferraz ML. Management of hepatitis C in patients with chronic kidney disease. World J Gastroenterol. 2015; 21:408-422.
33. Valli MB, Serafino A, Crema A, Bertolini L, Manzin A, Lanzilli G, Bosman C, Iacovacci S, Giunta S, Ponzetto A, Clementi M and Carloni G. Transmission in vitro of hepatitis C virus from persistently infected human B-cells to hepatoma cells by cell-to-cell contact. J Med Virol. 2006; 78:192-201.
34. Masciopinto F, Giovani C, Campagnoli S, Galli-Stampino L, Colombatto P, Brunetto M, Yen TS, Houghton M, Pileri P and Abrignani S. Association of hepatitis C virus envelope proteins with exosomes. Eur J Immunol. 2004; 34:2834-2842.
35. Moher D, Liberati A, Tetzlaff J and Altman DG. Preferred reporting items for systematic reviews and meta-analyses: the PRISMA statement. PLoS Med. 2009; 6:e1000097.
36. DerSimonian R and Laird N. Meta-analysis in clinical trials. Control Clin Trials. 1986; 7:177-188.
37. Dupont WD and Plummer WD, Jr. Power and sample size calculations. A review and computer program. Control Clin Trials. 1990; 11:116-128.