
INTRODUCTION
Colorectal cancer (CRC) is the third most common cancer and the third leading cause of cancer death for men and women individually and the second leading cause for men and women combined in the USA [1]. Half of all CRC patients will present with stage II or stage III disease, and 20%-50% of them will develop disease recurrence. Of those, 74% will develop recurrence within the first 3 years of diagnosis, despite curative surgical intervention and adjuvant chemotherapy [2, 3]. Although clinic-pathological risk factors such as T4 or N2 disease, poorly differentiated histology, and suboptimal lymph node dissection are considered poor prognostic factors for recurrence, no predictive markers have been identified for patients who are likely to benefit from adjuvant chemotherapy [4–8]. Despite the FDA approval of Oncotype DX as a prognostic tool for locally advanced colon cancer, it is not heavily utilized as it has no predictive value for benefit of adjuvant chemotherapy. Biomarkers that could add both prognostic and predictive value to existing clinico-pathological risk factors is urgently needed for locally advanced disease, notably stage II colon cancer [9, 10].
MicroRNAs (miRNAs), the small non-coding RNAs that are associated with the development of cancer [11], have been shown to be potential biomarkers in various types of cancer, including CRC [12]. Examinations of miRNA profiles in tumor versus normal tissues and in the circulating blood have resulted in the discovery of various miRNAs that are associated with tumor progression and patient survival [9, 13–15]. Exosomes have been attracting major interest as potential diagnostic and prognostic biomarkers of cancer. Exosomes can be isolated from many body fluids, including both plasma and serum [16]. Tumor-derived exosomes are emerging as mediators of metastasis [17]. The isolation of cancer-specific exosomes in body fluids could enable the identification of DNA, RNA, miRNA, and proteins that aid in the treatment and management of cancer [18]. The role of serum exosomal miRNA as a prognostic marker for CRC recurrence was explored in one reported study conducted in six patients [19]. In this small study, one miRNA, miR-19a, was identified as a prognostic marker.
The purpose of this study was to prospectively evaluate the prognostic and predictive value of serum exosomal miRNA in patients with stage II and III colon cancer utilizing RNA sequencing of serum exosomal miRNAs, followed by a quantitative reverse transcription polymerase chain reaction (qRT-PCR) assay.
RESULTS
Eighty-four patients were included in the study, with a median follow-up duration of 51 months (interquartile range: 45-64 months). Twenty-seven patients (32.1%) developed recurrent disease (14 local and 13 metastatic). The median age of the study population was 57 years. There was no significant difference in the distribution of demographics and major clinical factors between patients with or without tumor recurrence except number of positive lymph nodes and tumor location (Table 1). The recurrent group had a significantly higher frequency of >5 metastatic lymph nodes than did the non-recurrent group (P=0.03). The recurrent group also had a higher frequency of tumors of the sigmoid and ascending (right side) colon and a lower frequency of tumors of the cecum, transverse and the descending (left side) colon than did the non-recurrent group (P=0.029). Forty-seven out of 57 (82%) of the non-recurrent patients and 19/27 (70%) of the recurrent patients received FOLFOX adjuvant chemotherapy, 8/57 (14%) versus 5/27 (19%), respectively, received other types of chemotherapy and 5 patients did not receive any chemotherapy. The differences in recurrence rate were not statistically significant between any two subgroups in terms of adjuvant chemotherapy (Table 1).
Table 1: Demographic and clinical features of the study population
Variable |
Non-recurrent, n (%) |
Recurrent, n (%) |
P valuea |
|---|---|---|---|
Age (years) |
|||
≤57 |
28 (49) |
16 (59) |
0.385 |
>57 |
29 (51) |
11 (41) |
|
Sex |
|||
Male |
36 (63) |
17 (63) |
0.986 |
Female |
21 (37) |
10 (37) |
|
Race |
|||
White |
39 (68) |
16 (59) |
0.409 |
Non-white |
18 (32) |
11 (41) |
|
Location |
|||
Cecum/transverse/descending colon |
19 (33) |
2 (7) |
0.029b |
Ascending colon |
17 (30) |
10 (37) |
|
Sigmoid |
21 (37) |
15 (56) |
|
CEA (μg/L) |
|||
≤5 |
52 (91) |
22 (82) |
0.279 |
>5 |
5 (9) |
5 (19) |
|
Tumor stage |
|||
IIA |
6 (11) |
3 (11) |
0.191b |
IIB, IIC |
2 (4) |
0 (0) |
|
IIIA |
4 (7) |
0 (0) |
|
IIIB |
33 (58) |
13 (48) |
|
IIIC |
12 (21) |
11 (41) |
|
Tumor differentiation |
|||
Moderate to well, well |
44 (77) |
22 (82) |
0.655 |
Moderate to poor, poor |
13 (23) |
5 (19) |
|
Lymph vascular invasion |
|||
No |
45 (79) |
23 (85) |
0.497 |
Yes |
12 (21) |
4 (15) |
|
Perineural invasion |
|||
No |
42 (74) |
19 (70) |
0.750 |
Yes |
15 (26) |
8 (30) |
|
Margin positive |
|||
No |
23 (40) |
8 (30) |
0.342 |
Yes |
34 (60) |
19 (70) |
|
Lymph nodes resected |
|||
2-10 |
32 (56) |
15 (56) |
0.664 |
11-25 |
5 (9) |
1 (4) |
|
25-65 |
20 (35) |
11 (41) |
|
Lymph nodes involved |
|||
0 |
7 (12) |
3 (11) |
0.030 |
1-5 |
40 (70) |
12 (44) |
|
>5 |
10 (18) |
12 (44) |
|
Adjuvant chemotherapy |
|||
None or missing |
2 (4) |
3 (11) |
0.424 |
FOLFOX |
47 (82) |
19 (70) |
|
Other |
8 (14) |
5 (19) |
|
aTwo-sided Chi-square test. bFisher’s exact test.
The time (mean ± SD) between tumor resection and blood collection was 44.5±15.5 days for non-recurrent patients versus 45.0±14.0 days for recurrent patients (P=0.889). The total follow-up duration (from date of diagnosis to last follow-up) was 56.0±16.7 and 51.6±14.0 months for non-recurrent and recurrent patients, respectively (P=0.241). The median time from colon resection to the development of recurrent disease was 17.6 months (interquartile range: 8.7-26.3 months). Nine of the 27 recurrent patients and none of the 57 non-recurrent patients have died at the time of last follow-up; all deaths were related to colon cancer. Cox regression analyses of time to tumor recurrence and overall survival demonstrated that tumor location and CEA levels were significant clinical predictors (Figure 1).
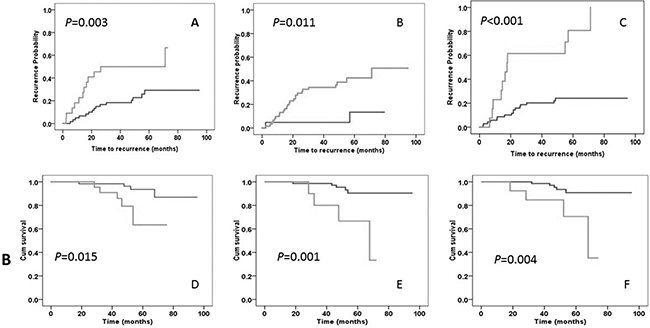
Figure 1: Kaplan-Meier plot of time to tumor recurrence (panels A-C) and overall survival duration (panels D-F). Panels A, B, and C represent comparisons of time to recurrence by lymph node (≤5 vs. >5 positive nodes), tumor location (cecum/transverse/left vs sigmoid/right colon), and mir-4772-3p (< vs. ≥27.88 ΔCT) status, respectively. Panels D, E, and F represent comparisons of overall survival duration by lymph node (≤5 vs. >5 positive nodes), CEA (≤5 vs. >5 mg/L), and mir-4772-3p (< vs. ≥27.88 ΔCT) status, respectively. P values are from a log-rank test.
The presence of exosome populations in the serum extracts was confirmed by scanning electron microscopy (Supplementary Figure S1) and expression of canonical exosome surface markers including CD9, CD63, and CD81 as detected by Western blots (Supplementary Figure S2). Nanoparticle-tracking analysis showed that the median and mean size of the particles was 74.5 and 81.1, respectively. A concentration of 2.1 x10⁹ to 4.8 ×10¹¹ particles per ml of serum was detected in the four tested serum samples (Supplementary Figure S3).
The quality control data of the eight pooled serum exosomal RNA samples are presented in Supplementary Figure S4. MiRNAs comprised 6% to 20% of the total RNAs. RNA-seq showed that all samples had more than 20 million total reads (Supplementary Table S1). The four pooled samples from non-recurrent patients (numbers 1-4) had higher numbers (mean=584) of known miRNAs with ≥5x coverage than did those from recurrent patients (numbers 5-8) (mean=502). In the differential expression analysis, two pooled samples (numbers 2 and 6) were excluded because they had either the lowest amount of miRNA content (Supplementary Figure S4) or the smallest number of mature miRNAs detected (Supplementary Table S1). A differential expression analysis between the non-recurrent and recurrent patients was conducted using both edgeR and DeSeq software; the top 13 differentially expressed miRNAs are listed in Table 2. An edgeR analysis identified 145 differentially expressed mature miRNAs with P<0.05 and 50 with FDR<0.05 (Supplementary Table S2). On the other hand, an analysis using DeSeq detected only 11 miRNAs with FDR<0.10 (two with FDR<0.05) (Table 2). Table 2 lists the miRNAs with FDR<0.05 (by edgeR) and the highest fold change between recurrent and non-recurrent patients. An Ingenuity Pathway Analysis of the 145 miRNAs with nominal significance by edgeR identified several cellular functions that were over-represented by the differentially expressed miRNAs, i.e., cellular development, cellular growth and proliferation, cell cycle, cellular movement, and cell death and survival (Supplementary Table S3).
Table 2: Top differentially expressed miRNAs, as detected by RNA sequencing
MiRNA |
EdgeR |
DeSeq |
|||||
|---|---|---|---|---|---|---|---|
log2ratioa |
P value |
FDR |
log2ratio |
P value |
FDR |
||
hsa-miR-451a |
-1.41 |
7.19E-07 |
0.0004 |
-1.45 |
5.72E-05 |
0.0327 |
|
hsa-miR-107 |
-1.32 |
2.74E-06 |
0.0008 |
-1.36 |
1.26E-04 |
0.0361 |
|
hsa-miR-4732-5p |
-1.69 |
5.27E-06 |
0.0010 |
-1.73 |
6.47E-04 |
0.0683 |
|
hsa-miR-3688-3p |
-2.56 |
1.43E-05 |
0.0016 |
-2.64 |
8.73E-04 |
0.0683 |
|
hsa-miR-485-3p |
1.63 |
1.43E-05 |
0.0016 |
1.60 |
4.11E-04 |
0.0681 |
|
hsa-miR-4306 |
-1.47 |
5.37E-05 |
0.0051 |
-1.51 |
8.98E-04 |
0.0683 |
|
hsa-miR-486-5p |
-1.16 |
7.81E-05 |
0.0062 |
-1.20 |
4.77E-04 |
0.0681 |
|
hsa-miR-3143 |
-1.56 |
8.90E-05 |
0.0062 |
-1.62 |
1.88E-03 |
0.0975 |
|
hsa-miR-4433b-5p |
1.57 |
9.72E-05 |
0.0062 |
1.55 |
9.56E-04 |
0.0683 |
|
hsa-miR-96-5p |
-1.16 |
3.33E-04 |
0.0150 |
-1.20 |
1.34E-03 |
0.0784 |
|
hsa-miR-370-3p |
1.29 |
3.42E-04 |
0.0150 |
1.25 |
1.37E-03 |
0.0784 |
|
hsa-miR-151b |
-1.31 |
2.65E-04 |
0.0150 |
||||
hsa-miR-451b |
-5.68 |
3.24E-04 |
0.0150 |
||||
Top down-regulated |
Top up-regulated |
||||||
MiRNA |
log2ratio |
P value |
FDR |
MiRNA |
log2ratio |
P value |
FDR |
hsa-miR-451b |
-5.68 |
3.24E-04 |
0.0150 |
hsa-miR-370-3p |
1.29 |
3.42E-04 |
0.0150 |
hsa-miR-4482-3p |
-4.54 |
9.41E-04 |
0.0256 |
hsa-miR-758-3p |
1.35 |
3.09E-03 |
0.0414 |
hsa-miR-548ac |
-3.72 |
1.11E-03 |
0.0287 |
hsa-miR-136-5p |
1.40 |
3.45E-03 |
0.0437 |
hsa-miR-3688-3p |
-2.56 |
1.43E-05 |
0.0016 |
hsa-miR-429 |
1.42 |
3.14E-03 |
0.0414 |
hsa-miR-3200-5p |
-2.21 |
7.30E-04 |
0.0236 |
hsa-miR-654-5p |
1.46 |
7.91E-04 |
0.0236 |
hsa-miR-4732-5p |
-1.69 |
5.27E-06 |
0.0010 |
hsa-miR-369-5p |
1.47 |
2.72E-03 |
0.0409 |
hsa-miR-3143 |
-1.56 |
8.90E-05 |
0.0062 |
hsa-miR-4433b-5p |
1.57 |
9.72E-05 |
0.0062 |
hsa-miR-4448 |
-1.52 |
2.27E-03 |
0.0403 |
hsa-miR-485-3p |
1.63 |
1.43E-05 |
0.0016 |
hsa-miR-3143 |
-1.56 |
8.90E-05 |
0.0062 |
hsa-miR-337-3p |
1.85 |
1.86E-03 |
0.0380 |
We tested the expression of 10 differentially expressed miRNAs (Table 3) in 84 individual samples using a qRT-PCR assay. MiR-4772-3p showed 5.91-fold lower expression in recurrent than in non-recurrent patients, with a P value of 0.002 by both the parametric t test and non-parametric Mann-Whitney U-tests (Table 3), which was statistically significant after Bonferroni correction. MiR-4732-5p was upregulated in the recurrent group by 1.8-fold, and the P value was 0.044 and 0.144 in the parametric and non-parametric tests, respectively. Mir-451b was under-expressed by 2.95-fold in the recurrent group, but the difference did not reach statistical significance (P=0.093 and 0.074 in the U test and t test, respectively). The expression of the other seven markers did not significantly differ between the two groups.
Table 3: MiRNA expression by qRT-PCR in non-recurrent and recurrent patients
MiRNA |
Non-recurrent, n=57 |
Recurrent,a n=27 |
Fold changeb |
P valuec |
P valued |
|---|---|---|---|---|---|
hsa-miR-4732-5p |
10.40±3.92 |
8.60±3.45 |
1.80 |
0.144 |
0.044 |
hsa-miR-451a |
4.79±4.31 |
3.90±3.03 |
0.89 |
0.569 |
0.336 |
hsa-miR-3200-3p |
22.50±7.10 |
22.92±10.11 |
-0.42 |
0.882 |
0.845 |
hsa-miR-3143 |
32.57±6.71 |
34.34±4.63 |
-1.78 |
0.524 |
0.217 |
hsa-miR-485-3p |
12.80±4.02 |
11.04±7.80 |
1.76 |
0.129 |
0.276 |
hsa-miR-4772-3p |
19.71±5.52 |
25.62±8.71 |
-5.91 |
0.002 |
0.002 |
hsa-miR-1255b-5p |
8.09±3.38 |
8.42±3.68 |
-0.33 |
0.966 |
0.686 |
hsa-miR-1180-3p |
13.02±6.14 |
13.12±7.49 |
-0.10 |
0.629 |
0.950 |
hsa-miR-451b |
22.84±6.51 |
25.80±7.84 |
-2.95 |
0.093 |
0.074 |
hsa-miR-3200-5p |
13.65±3.80 |
14.22±2.69 |
-0.58 |
0.248 |
0.480 |
aRelative expression presented as mean ± standard deviation of ΔCT.
bFold difference (2-ΔΔCT) between the non-recurrent and recurrent groups. A negative value indicates under-expression, and a positive value indicates over-expression in the recurrent group.
cNon-parametric Mann-Whitney U-tests.
dStudent’s t test.
A logistic regression model was built using tumor recurrence status as the dependent variable. The ROC curve was constructed for miR-4772-3p as a predictor of tumor recurrence. Compared to tumor location and lymph node metastasis, the two known clinical predictors for recurrence, miR-4772-3p had better performance in both tests, i.e. a smaller P value for OR and a greater AUC (Table 4). Using the 60th percentile of the ΔCT value (27.88) of miR-4772-3p in the recurrent group as the cut-off, patients with a lower level of expression (higher ΔCT value) of miR-4772-3P had a significantly increased risk of tumor recurrence (OR: 11.3, 95% CI: 2.38-53.2, P<0.001) (Table 4). An ROC analysis was performed on miR-4774-3p to discriminate recurrent from non-recurrent patients; the AUC was 0.72 (95% CI: 0.59-0.85, P=0.001), and the sensitivity and specificity were 78.6% and 77.1%, respectively (Table 4).
Table 4: Logistic regression and ROC analyses of risk of tumor recurrence
Variable |
Non-recurrent n (%) |
Recurrent n (%) |
Logistic regression OR (95% CI) |
P value |
ROC, AUC (95% CI) |
P value |
|---|---|---|---|---|---|---|
miR-4772-3p |
||||||
<27.88 |
54 (95) |
16 (59) |
1.0 |
|||
≥27.88 |
3 (5) |
11 (41) |
11.3 (2.38-53.2) |
0.002 |
0.72 (0.59-0.85) |
0.001 |
Tumor site |
||||||
Cecum/transverse/descending |
19 (33) |
2 (7) |
1.0 |
|||
Ascending/sigmoid |
38 (67) |
25 (93) |
6.02 (1.14-31.8) |
0.034 |
0.63 (0.51-0.75) |
0.062 |
Lymph node positive |
||||||
≤5 |
47 (83) |
15 (56) |
1.0 |
|||
>5 |
10 (17) |
12 (44) |
2.77 (0.84-9.17) |
0.095 |
0.65 (0.51-0.78) |
0.034 |
Mir-4772-3p was dichotomized using the 60th percentile of the ΔCT value of recurrence patients.
The variables mir-4772-3p expression, CEA level, and lymph node status were all included in the multivariate logistic regression model.
CEA and the AJCC stage were dropped due to insignificance.
A Kaplan-Meier plot and the log-rank test showed that patients with a lower level of miR-4772-3p expression (≥27.88 ΔCT) had a significantly shorter time to recurrence (mean ± standard error=32.5±7.4 months) than did those with a higher expression level (77.0±3.9), P<0.001 (Figure 1). Tumor location and CEA levels were also significantly associated with a shorter time to recurrence and increased risk of recurrence (Figure 1 and Table 5). With a low frequency of death (n=9), the median overall survival duration could not be calculated; however, the mean ± standard error for overall survival was 87.4±2.6 months, which was significantly shorter in patients with low miR-4772-3p expression (60.9±5.3) than in those with high expression (90.9±2.0), P=0.004 (Figure 1). A multivariate Cox regression model that included miR-4772-3p (< vs. ≥27.88 ΔCT), tumor location (cecum/transverse/descending colon vs. ascending/sigmoid), and serum CEA levels (≤ 5 vs. >5 mg/L) revealed that patients with reduced expression of miR-4772-3p had a 5.48-fold increased risk of tumor recurrence (95% CI: 2.49-12.1), P<0.001 (Table 5). Furthermore, low miR-4772-3p and high CEA levels, but not tumor location, were significantly related to an increased risk of death in this patient population (Table 5).
Table 5: Analysis of time to recurrence and overall survival duration by Cox regression analysis
Variable |
# of recurrences/ # of patients |
Time to recurrence (mean ± standard error)a |
Risk of recurrence, HR (95% CI) |
# of deaths/# of patients |
Survival duration (mean ± standard error)a |
Risk of death, HR (95% CI) |
|---|---|---|---|---|---|---|
miR-4772-3p |
||||||
<27.88 |
16/70 |
77.0±3.9 |
1.0 |
5/70 |
90.9±2.0 |
1.0 |
≥27.88 |
11/14 |
32.5±7.4 |
5.48 (2.49-12.1) |
4/14 |
60.9±5.3 |
6.19 (1.50-25.5) |
P value |
<0.001 |
0.012 |
||||
Tumor site |
||||||
Cecum/transverse/descending |
2/21 |
73.7±4.0 |
1.0 |
1/21 |
79.2±2.1 |
1.0 |
Ascending/sigmoid |
25/63 |
62.1±6.0 |
7.42 (1.64-33.5) |
8/83 |
86.7±2.9 |
7.37 (0.74-73.3) |
P value |
<0.001 |
0.089 |
||||
CEA (mg/L) |
||||||
≤5 |
22/74 |
70.3±4.4 |
1.0 |
5/74 |
90.6±2.1 |
1.0 |
>5 |
5/10 |
43.2±8.8 |
2.87 (1.04-7.94) |
4/10 |
59.0±5.4 |
9.57 (2.29-39.9) |
P value |
0.042 |
0.002 |
||||
aBecause median time to recurrence and overall survival duration could not be calculated for the low-risk groups, means and standard error values are presented for all groups.
The distribution of tumor recurrence rate by subgroups of chemotherapy, tumor stage, and miR-4772-3p expression levels were presented in Supplementary Table S4. The number of patients with stage II disease, patients that did not receive any adjuvant therapy, or other adjuvant chemotherapy other than FOLFOX were too small to make a meaningful comparison. The only significant difference in tumor recurrence rate by miR-4772-3p expression level was observed in the group of patients with stage III tumor who had received adjuvant FOLFOX. Patients with a low level of miR-4772-3p expression had a much higher tumor recurrence rate (90%) than those with a high level of expression (18%) (P<0.001).
Using TargetScanHuman version 7.0 software [20], we identified several potential target genes of miR-4772-3p; the top 20 are listed in Supplementary Table S5. The top two genes were TFRC (transferrin receptor) and RTN4 (reticulon 4), with total context++ scores of -1.2 and -1.03, respectively. Other genes included RAB9A (a member of the ras oncogene family), with a score of 0.93.
DISCUSSION
The aims of this study were to identify specific serum exosomal miRNAs that can serve as prognostic biomarkers of recurrent stage II and stage III colon cancer as well as predictive markers for response to adjuvant therapy. In this study of 84 stage II and stage III colon cancer patients by RNA-seq and RT-PCR, the baseline level of serum exosomal miR-4772-3p was significantly lower in the 27 patients with recurrent disease than in that of the 57 patients without recurrence. The lower level of miR-4772-3p expression at baseline was significantly associated with a 5.48-fold shorter time to recurrence and 6.19-fold increased risk of death after adjusting for other clinical factors. Because this marker was readily measurable in the circulating blood at baseline, before any adjuvant therapy, it has great potential value for identifying stage II and stage III colon cancer patients who have a high risk of tumor recurrence. Although we observed supporting evidence for miR-4772-3p as a potential predictive marker in patients who received FOLFOX adjuvant therapy, because 94% of the 84 patients underwent adjuvant chemotherapy, this study could not distinguish whether miR-4772-3p was truly a predictive marker for response to FOLFOX or it is a prognostic marker for tumor recurrence only. A future study is required to clarify this issue and is being planned for validation.
Compared to microarray technology, RNA-seq has the advantage of higher sensitivity and the ability to detect new miRNAs that have not been previously reported [21]. The current study using RNA-seq identified a large number of differentially expressed mature miRNAs between recurrent and non-recurrent colon cancer patients. Because of the cost-effectiveness consideration, only a small number of the top hit miRNAs were evaluated in the validation study. A quantitative RT-PCR assay confirmed that one of the selected markers, miR-4772-3p, was significantly under-expressed in recurrence patients; this difference was statistically significant after adjusting for multiple testing. Logistic regression modeling and a ROC analysis demonstrated that this miRNA had better performance than did other clinical factors, such as tumor location and lymph node metastasis, in predicting tumor recurrence. MiR-4772-3p has previously been reported to be differentially expressed in tumor versus normal breast tissues [22] and in patients with and without Alzheimer disease [23]. Although the functional significance of miR-4772-3p remains unknown, a number of genes have been predicted to be targets of this miRNA, with high context scores and high relevance to tumor progression (Supplementary Table S5). For example, the RTN4 (aka NOGO) gene has been implicated in lung cancer [24], hepatocellular carcinoma [25], and cervical cancer [26] and has diverse roles in epithelial-mesenchymal transition, cell adhesion, and migration [27]. The RAB9A gene is an important member of the ras oncogene superfamily. Other genes are involved in membrane trafficking, inflammation, apoptosis, and mitochondrial functions, which are all involved in tumor progression and metastasis.
Exosomes have the capacity to protect miRNAs [28] and other cellular contents from degradation in circulation and function as carriers to transmit the donor cells’ contents to recipient cells [29]. Thus, serum exosomal miRNA profiles may reflect the condition of tumor cells, and under-expression of miR-4772-3p may lead to the overexpression of oncogenes and the genes that promote tumor progression and metastasis [30]. Further investigation into the regulatory effects of miR-4772-3p on these genes and their role in CRC progression is warranted.
The strength of our study includes the prospective collection of blood specimens from a relatively homogenous study population. Most studies of this kind used blood samples collected after tumor recurrence, which may lead to the discovery of biomarkers that are either depending on the tumor volume or affected by adjuvant treatment. Using blood samples collected after tumor resection but before receiving any adjuvant chemotherapy is clinically relevant since this is the juncture when clinical decision is made regarding the use of adjuvant chemotherapy. Because all patients were treated at MD Anderson under the same treatment regimen, and several criteria were applied at patient enrollment, we expect minimum selection bias. The limitations of the study include small number of miRNAs in the validation study and lack of miRNA expression data in the tumor tissues. It is essential that our findings be validated in other study populations with a larger sample size. Correlating serum exosomal miRNA expression with that of tumor tissues is also highly desirable.
Overall, this is the first study to report serum exosomal miRNA profiling by RNA-seq and qRT-PCR in stage II and III colon cancer patients. Our findings identified a potential prognostic/predictive marker of tumor recurrence. Further validation of these findings in tumor tissue samples and additional blood samples are underway. If confirmed in a larger patient population, the level of miR-4772-3p could be helpful in determining the role of adjuvant FOLFOX therapy as well the interval of diagnostic imaging in patients with stage II or III colon cancer who are considered to be at high risk following surgical resection. Furthermore, if validated, miR-4772-3p should be evaluated in patients undergoing metastatic surgical resection, in which the role of adjuvant chemotherapy remains a subject of debate. In addition, a further functional analysis of miR-4772-3p may provide the fundamental information required for future targeted therapy.
MATERIALS AND METHODS
Study population
Patients with stage II and stage III colon cancer were prospectively recruited from the Colorectal Cancer Center at The University of Texas MD Anderson Cancer Center (Houston, Texas) from September 2006 to April 2011. The study design was approved by the institutional review board of MD Anderson. All patients signed an informed consent form for interviewing and for collection of blood and residual tissue samples for research. All patients had histologically proven AJCC (version 7) stage II (T3-4N0M0) or III (TxN1-3M0) adenocarcinoma of the colon and were aged 18 years or older. Patients with a known history of familial adenomatous polyposis, hereditary non-polyposis CRC, other hereditary polyposis syndromes (e.g., Muir Torre or Gardner’s syndrome); a diagnosis of rectal cancer; or prior malignancies (excluding non-melanoma skin neoplasms) over the past 5 years were excluded. Patients agreed to be followed up for a surveillance period of up to 2 years. Peripheral blood samples were collected within 12 weeks of surgical resection and before the initiation of adjuvant chemotherapy. The primary endpoint was the occurrence of local recurrent or distant metastasis, determined radiologically or histologically.
Exosome isolation and characterization
After blood was drawn, serum was immediately separated from the cellular fraction by centrifugation at 3000g for 10 min at ambient temperature and stored at -80°C until use.
Exosomes were extracted from 250-μl serum samples using the ExoQuick kit (SBI, Mountain View, CA, USA) according to the manufacturer’s instructions. An aliquot of the exosomes was fixed in Formaldehyde/Glutaraldehyde, 2.5% each in 0.1M Sodium Cacodylate Buffer, pH 7.4 for 15 minutes for electronic microscopy imaging. Digital images were obtained using the AMT Imaging System (Advanced Microscopy Techniques Corp., Danvers, MA) by the High Resolution Electron Microscopy Facility at MD Anderson. The remaining exosome pellets were suspended in PBS and serially diluted to the optimum dynamic range of the Zetaview nanoparticle analyzer (Particle Metrix, Diessen, Germany) for measurement of size and particle density. A separate exosome preparation from 250-μl serum samples was used to examine exosome markers by Western blotting with the following primary antibodies 1:1000 CD63, 1:1000 CD81, and 1:1000 CD9 (CD63, CD81, and CD9 rabbit anti-human from EXO-AB System bioscience). The detailed experimental protocols of these assays have previously been described [31].
RNA extraction and RNA-seq
Exosomal RNA was extracted using the SeraMir exosome RNA kit (SBI, Mountain View, CA, USA) according to the manufacturer’s instructions. The quality and quantity of the RNA was determined using the Small RNA Chip and Agilent Bioanalyzer 2100 (Agilent Technologies, Santa Clara, CA). Samples with an RNA integrity number of >7.0 were eligible for RNA-seq. Twenty patients each in the recurrent and non-recurrent groups were matched by age, sex, race, and tumor stage. Five RNA samples from each group were pooled, and 8 were subjected to RNA-seq. The library was prepared using the NEBNext Small RNA Library Prep Set for Illumina, following the manufacturer’s protocol (New England BioLabs, Ipswich, MA). The constructed libraries were quality checked using a bioanalyzer and pooled, followed by size selection in a range of 130 bp and 166 bp using a 3% agarose gel cassette on a BluePippin (Saga Science, Beverly, MA). RNA-seq was conducted on an Illumina HiSeq 2000 at the Science Park NGS facility. The quality of the sequencing data was analyzed by the bioinformatics team associated with the sequencing core. In brief, the reads were first trimmed by removing the adaptor sequences and then mapped to human miRNAs from miRBase Release 21 [32] using miRDeep2 (version 2.007) [33], which used the short read aligner Bowtie (version 1.0.0) [34] internally. The number of reads in each miRNA was enumerated by miRDeep2, and differences in expression between groups were statistically assessed by DeSeq (version 1.16.0) [35] and edgeR (version 3.6.1) [36]. A pathway analysis was conducted on the differentially expressed miRNAs with nominal significance using Ingenuity Pathway Analysis software (Ingenuity Systems, Redwood City, CA).
Validation test by quantitative real-time PCR
Ten differentially expressed miRNA species were selected for validation on the basis of the criteria of >1.5-fold change, P<0.05, and false-positive reporting probability <0.05 or on the results of a literature search suggesting relevance to human cancer. An RT-PCR validation assay was conducted in samples from all 84 patients using an ABI PRISM 7900 HT real-time RT-PCR system (Applied Biosystems, Foster City, CA). In brief, 5 ml of exosomal RNA was reverse transcribed to cDNA using small RNA assays and miRNA-specific primers (Thermo Fisher Scientific, Waltham, MA), according to the manufacturer’s instructions. The primer sequences for each tested miRNA are presented in Supplementary Table S6. MiR-16 was included as an internal standard, as suggested by the results of previous studies [37]. Each sample was analyzed in triplicate in an RT-PCR assay, and the mean threshold cycle (Ct) value of the triplicates was used in the final data analysis. The RT-PCR results were first normalized to the Ct value of miR-16, referred to as ΔCt. The fold change in miRNA expression in the recurrent group compared to that in the non-recurrent group was expressed as 2-Δ ΔCt. The potential target genes of miRNAs were predicted using TargetScan 7.0 [20].
Statistical analysis
Student’s t-test and nonparametric Mann-Whitney U-tests were used to compare the differences in serum miRNA expression between the recurrent and non-recurrent groups according to the variable distribution. The predictive value of the markers was evaluated by constructing logistic regression models, Cox proportional hazard regression models, and receiver operating curves (ROCs). Time to recurrence and overall survival curves were generated using the Kaplan-Meier method, and the statistical significance of the differences was determined using Gehan’s modification of the Wilcoxon signed-rank test. The risk of recurrence and risk of death were estimated using univariate and multivariate hazard ratios (HRs), and 95% confidence intervals (CIs) were calculated using Cox proportional hazard models.
All tests used SPSS software 21.0 (SPSS, Inc., Chicago, IL, USA), and a P<0.05 was considered statistically significant. To control the false-positive detection rate associated with multiple testing, a Bonferroni correction was applied. A P<0.005 (0.05/10 [number of samples tested]) was considered as multiple comparison adjusted significant.
ACKNOWLEDGMENTS
We thank Ann M. Sutton for editing this manuscript. We thank Hector Alvarez, Dong Kim, Vincent Bernard, and Jonathan Castillo for technical guidance and help on the exosome characterization experiments.
DISCLOSURE
The authors have nothing to disclose.
GRANT SUPPORT
Supported by NIH/NCI Cancer Center Support Grant P30CA016672, CPRIT Core Facility Support Grant RP120348 (JS), a philanthropic grant from the Urbieta Family Colon Cancer Fund (CE), and a National Natural Science Foundation of China Grant 81570506 (FW).
REFERENCES
1. Siegel R, Ma J, Zou Z and Jemal A. Cancer statistics, 2014. CA Cancer J Clin. 2014; 64:9-29.
2. Midgley R and Kerr D. Colorectal cancer. Lancet. 1999; 353:391-399.
3. Sargent D, Wieand S and Benedetti J. Disease-free survival (DFS) vs. overall survival (OS) as a primary endpoint for adjuvant colon cancer studies: Individual patient data from 12,915 patients on 15 randomized trials. Proc Annu Meet Am Soc Clin Oncol. 2004; 22:a3502.
4. O’Connor ES, Greenblatt DY, LoConte NK, Gangnon RE, Liou JI, Heise CP and Smith MA. Adjuvant chemotherapy for stage II colon cancer with poor prognostic features. J Clin Oncol. 2011; 29:3381-3388.
5. Gill S, Loprinzi CL, Sargent DJ, Thome SD, Alberts SR, Haller DG, Benedetti J, Francini G, Shepherd LE, Francois Seitz J, Labianca R, Chen W, Cha SS, Heldebrant MP and Goldberg RM. Pooled analysis of fluorouracil-based adjuvant therapy for stage II and III colon cancer: who benefits and by how much? J Clin Oncol. 2004; 22:1797-1806.
6. Compton C, Fenoglio-Preiser CM, Pettigrew N and Fielding LP. American Joint Committee on Cancer Prognostic Factors Consensus Conference: Colorectal Working Group. Cancer. 2000; 88:1739-1757.
7. Morris EJ, Maughan NJ, Forman D and Quirke P. Who to treat with adjuvant therapy in Dukes B/stage II colorectal cancer? The need for high quality pathology. Gut. 2007; 56:1419-1425.
8. Group QC. Adjuvant chemotherapy versus observation in patients with colorectal cancer: a randomised study. Lancet. 2007; 370:2020-2029.
9. Zhang J-X, Song W, Chen Z-H, Wei J-H, Liao Y-J, Lei J, Hu M, Chen G-Z, Liao B, Lu J, Zhao H-W, Chen W, He Y-L, Wang H-Y, Xie D and Luo J-H. Prognostic and predictive value of a microRNA signature in stage II colon cancer: a microRNA expression analysis. Lancet Oncol. 2013; 14:1295-1306.
10. Dalerba P, Sahoo D, Paik S, Guo X, Yothers G, Song N, Wilcox-Fogel N, Forgo E, Rajendran PS, Miranda SP, Hisamori S, Hutchison J, Kalisky T, Qian D, Wolmark N, Fisher GA, et al. CDX2 as a Prognostic Biomarker in Stage II and Stage III Colon Cancer. N Engl J Med. 2016; 374:211-222.
11. Wang J, Zhang KY, Liu SM and Sen S. Tumor-associated circulating microRNAs as biomarkers of cancer. Molecules. 2014; 19:1912-1938.
12. Wu WKK, Law PTY, Lee CW, Cho CH, Fan D, Wu K, Yu J and Sung JJY. MicroRNA in colorectal cancer: from benchtop to bedside. Carcinogenesis. 2011; 32:247-253.
13. Schepeler T, Reinert JT, Ostenfeld MS, Christensen LL, Silahtaroglu AN, Dyrskjot L, Wiuf C, Sorensen FJ, Kruhoffer M, Laurberg S, Kauppinen S, Orntoft TF and Andersen CL. Diagnostic and prognostic microRNAs in stage II colon cancer. Cancer Res. 2008; 68:6416-6424.
14. Shivapurkar N, Weiner LM, Marshall JL, Madhavan S, Mays AD, Juhl H and Wellstein A. Recurrence of Early Stage Colon Cancer Predicted by Expression Pattern of Circulating microRNAs. PloS one. 2014; 9:1-6.
15. Zanutto S, Pizzamiglio S, Ghilotti M, Bertan C, Ravagnani F, Perrone F, Leo E, Pilotti S, Verderio P, Gariboldi M and Pierotti MA. Circulating miR-378 in plasma: a reliable, haemolysis-independent biomarker for colorectal cancer. Br J Cancer. 2014; 110:1001-1007.
16. Thery C. Cancer: Diagnosis by extracellular vesicles. Nature. 2015; 523:161-162.
17. Saleem SN and Abdel-Mageed AB. Tumor-derived exosomes in oncogenic reprogramming and cancer progression. Cell Mol Life Sci. 2015; 72:1-10.
18. Melo SA, Luecke LB, Kahlert C, Fernandez AF, Gammon ST, Kaye J, LeBleu VS, Mittendorf EA, Weitz J, Rahbari N, Reissfelder C, Pilarsky C, Fraga MF, Piwnica-Worms D and Kalluri R. Glypican-1 identifies cancer exosomes and detects early pancreatic cancer. Nature. 2015; 523:177-182.
19. Matsumura T, Sugimachi K, Iinuma H, Takahashi Y, Kurashige J, Sawada G, Ueda M, Uchi R, Ueo H, Takano Y, Shinden Y, Eguchi H, Yamamoto H, Doki Y, Mori M, Ochiya T, et al. Exosomal microRNA in serum is a novel biomarker of recurrence in human colorectal cancer. Br J Cancer. 2015; 113:275-281.
20. Agarwal V, Bell GW, Nam JW and Bartel DP. Predicting effective microRNA target sites in mammalian mRNAs. eLife. 2015; 4.
21. Berezikov E, Cuppen E and Plasterk RHA. Approaches to microRNA discovery. Nat Genet. 2006.
22. Persson H, Kvist A, Rego N, Staaf J, Vallon-Christersson J, Luts L, Loman N, Jonsson G, Naya H, Hoglund M, Borg A and Rovira C. Identification of new microRNAs in paired normal and tumor breast tissue suggests a dual role for the ERBB2/Her2 gene. Cancer Res. 2011; 71:78-86.
23. Lugli G, Cohen AM, Bennett DA, Shah RC, Fields CJ, Hernandez AG and Smalheiser NR. Plasma Exosomal miRNAs in Persons with and without Alzheimer Disease: Altered Expression and Prospects for Biomarkers. PloS one. 2015; 10:e0139233.
24. Lu DY, Mao XH, Zhou YH, Yan XL, Wang WP, Zheng YB, Xiao JJ, Zhang P, Wang JG, Ashwani N, Ding WL, Jiang H, Shang Y and Wang MH. RTN4 3’-UTR insertion/deletion polymorphism and susceptibility to non-small cell lung cancer in Chinese Han population. Asian Pac J Cancer Prev. 2014; 15:5249-5252.
25. Hao CQ, Zhou Y, Wang JP, Peng MJ, Xie YM, Kang WZ, Sun L, Wang PZ, Wan CL, He L, Cai L and Jia ZS. Role of NogoA in the regulation of hepatocellular carcinoma SMMC7721 cell apoptosis. Mol Med Rep. 2014; 9:1743-1748.
26. Xiao W, Zhou S, Xu H, Li H, He G, Liu Y and Qi Y. Nogo-B promotes the epithelial-mesenchymal transition in HeLa cervical cancer cells via Fibulin-5. Oncol Rep. 2013; 29:109-116.
27. Schmandke A, Mosberger AC, Schmandke A, Celen Z and Schwab ME. The neurite growth inhibitory protein Nogo-A has diverse roles in adhesion and migration. Cell Adh Migr. 2013; 7:451-454.
28. Li Y, Zheng Q, Bao C, Li S, Guo W, Zhao J, Chen D, Gu J, He X and Huang S. Circular RNA is enriched and stable in exosomes: a promising biomarker for cancer diagnosis. Cell Res. 2015; 25:981-984.
29. Salido-Guadarrama I, Romero-Cordoba S, Peralta-Zaragoza O, Hidalgo-Miranda A and Rodriguez-Dorantes M. MicroRNAs transported by exosomes in body fluids as mediators of intercellular communication in cancer. Onco Targets Ther. 2014; 7:1327-1338.
30. Ma H, Liang C, Wang G, Jia S, Zhao Q, Xiang Z, Li Y, Cho WC, Pestell RG, Liang L and Yu Z. MicroRNA-mediated cancer metastasis regulation via heterotypic signals in the microenvironment. Curr Pharm Biotechnol. 2014; 15:455-458.
31. San Lucas FA, Allenson K, Bernard V, Castillo J, Kim DU, Ellis K, Ehli EA, Davies GE, Petersen JL, Li D, Wolff R, Katz M, Varadhachary G, Wistuba I, Maitra A and Alvarez H. Minimally invasive genomic and transcriptomic profiling of visceral cancers by next-generation sequencing of circulating exosomes. Ann Oncol. 2016; 27:635-641.
32. Griffiths-Jones S, Saini HK, van Dongen S and Enright AJ. miRBase: tools for microRNA genomics. Nucleic Acids Res. 2008; 36:D154-158.
33. Friedlander MR, Mackowiak SD, Li N, Chen W and Rajewsky N. miRDeep2 accurately identifies known and hundreds of novel microRNA genes in seven animal clades. Nucleic Acids Res. 2012; 40:37-52.
34. Langmead B, Trapnell C, Pop M and Salzberg SL. Ultrafast and memory-efficient alignment of short DNA sequences to the human genome. Genome Biol. 2009; 10:R25.
35. Anders S and Huber W. Differential expression analysis for sequence count data. Genome Biol. 2010; 11:R106.
36. Robinson MD, McCarthy DJ and Smyth GK. edgeR: a Bioconductor package for differential expression analysis of digital gene expression data. Bioinformatics. 2010; 26:139-140.
37. Davoren PA, McNeill RE, Lowery AJ, Kerin MJ and Miller N. Identification of suitable endogenous control genes for microRNA gene expression analysis in human breast cancer. BMC Mol Biol. 2008; 9:76.