
Introduction
Breast cancer patients have long received the benefit of prognostic gene expression-based classifiers such as Oncotype DX [1] (16 genes), Prosigna [2] (50 genes) and MammaPrint [3] (70 genes). The MammaPrint test, for example, divides early-stage breast cancer patients into two approximately equal groups; those patients that can forego ACT, without significant risk of decreased survival, and those that are likely to benefit from ACT. These tests save healthcare dollars, reduce the morbidity of ACT in low-risk patients, and assure high-risk patients that ACT is the right choice for them. In spite of the fact that lung cancer accounts for more deaths per year in the US, than breast, colon, prostate, and pancreatic cancer combined [4], lung cancer patients do not generally benefit from similar biomarkers [5]. Clinicians routinely prescribe adjuvant chemotherapy (ACT) for resected NSCLC patients; however, ACT only improves the proportion of five-year disease-free survivors in stage I-III non-small cell lung cancer by 5-15% when no markers are used to select patients for chemotherapy [6-12]. The remaining 85-95% of patients derive no measurable benefit and suffer the adverse effects and risks of treatment. While tumor stage [6] and histological subtype within adenocarcinomas [13] can guide the decision to treat with ACT, a robust, well-validated marker that could clearly identify which patients should receive adjuvant chemotherapy and which should be targeted for other strategies (observation, clinical trials, novel agents) would be of significant clinical value.
The majority of lung cancers (~85%) are classified as non-small cell lung cancer (NSCLC). The most common histological subtype of NSCLC is lung adenocarcinoma. We and others have demonstrated that proliferative capacity drives patient outcome and aggressiveness in lung adenocarcinomas, and gene expression signatures reflecting this capacity have been shown to be highly prognostic [14-17]. With proliferation tightly regulated by the E2F pathway [18], direct assessment of the E2F pathway deregulation in clinical samples should provide prognostic information. Furthermore, the E2F pathway is central to the cellular response to DNA damaging agents [19, 20] and other compounds [21] used in the treatment of lung adenocarcinoma. Based on these observations, we hypothesized that an accurate measurement of E2F pathway activation in lung adenocarcinoma could potentially serve as a prognostic biomarker as well as a predictive biomarker for the benefit of ACT.
To explore this hypothesis, a 74-gene E2F signature was developed and trained for application with RNA from both fresh-frozen (FF) and formalin-fixed paraffin-embedded (FFPE) tissues. This 74-gene E2F signature was cross-validated as prognostic in seven different survival datasets. Most importantly, data from two independent phase III, randomized clinical trials were used to validate the signature as predictive of benefit of ACT: the JBR10 trial [22] and the (Neo)Adjuvant Taxol/Carboplatin Hope (NATCH) trial [7].
Results
E2F Signature development and optimization
The overall schema used to develop an E2F pathway scoring system is highlighted in Figure 1. Multiple datasets (Tables S1-S3) were used to develop and validate the final 74 gene E2F signature (Tables S4-5) as described in the Materials and Methods and in greater detail in the Supplementary Materials. Specifically, siRNAs were used to knock down E2F pathway components (E2F1, E2F3A, E2F3B, both 3A and 3B, E2F4, and Rb) in model cell lines. Gene-specific knock down was confirmed by Western blotting (see Figure S1). Microarray analysis compared siRNA-treated knockdown versus control A549 and H1299 cell lines and applied a number of filters to identify 119 coding genes (145 probesets). Biologically these were highly correlated with cell cycle and DNA damage response by GeneGo analysis (see Table S6). Among the 119 genes, 106 genes were found well-annotated and thus incorporated into a NanoString assay. Comparison of individual gene expression between FF and FFPE in the “MLTO” cohort revealed 32 genes with poor individual correlation (r < 0.5; Table S7 and Figure S2), and led to a 74-gene signature. The PC1 scores derived from the 74 gene signature and the original 106 genes had strong correlations (FF: r = 0·99, p < 0·001; FFPE: r = 0·98-0.99, p < 0·001; Figure S3; with a similar percentage of total variation; 29-30%; Figure S4), suggesting that the remaining 74 genes reflected the original biology of the larger list. Further correlation analysis (Figure S5) among FF in microarray and FF and FFPE in NanoString showed a weak to moderate reproducibility in PC1 score of the 74-gene signature (r = 0.3-0.78), indicating non-negligible variation by tissue type.
To adjust for variation due to tissue types, and therefore allow comparison of data from diverse cohorts, the E2F scoring system was developed in two platforms based on either FF or FFPE tissue. Both platforms used the PC1 loading coefficients (gene weights) to calculate the E2F score. The gene weights were derived using the MLOS cohort for the FF platform while the MLCom cohort was used to obtain the gene weights for the FFPE platform. The percentage of total variation for PC1 between the two platforms was comparable (24-26%; Figure S6). While the correlation of the two platforms was weak (r = 0.25-0.28; Figure S7 and Table S8), both platforms gave a similar range of gene weights (-0.165 to 0.223 in FF and -0.165 to 0.210 in FFPE).
Evaluation of the median threshold was performed in the two training cohorts: the MLOS cohort for the FF platform and the MLCom cohort for the FFPE platform. In the FF platform, the classification by the median E2F score was significantly associated with OS in non-ACT patients of the MLOS cohort with poor OS in high E2F group (p < 0.001). Interestingly, other cutoffs (25th-75th percentiles) also had a significant association, indicating that the E2F score is generally robust in prognosis (Figure S8). Similarly, in the FFPE platform, the median-cutoff classification was able to significantly separate the low and high E2F groups in non-ACT patients of the MLCom cohort in terms of OS and PFS (p = 0.041 for OS and p = 0.044 for PFS). In comparison, other cutoffs were significant only in the range of 40th-60th percentiles for OS and in the range of 25th-75th percentiles for PFS (Figure S9). While the median-cutoff did not give the smallest p value, the median-cutoff E2F classification was associated with OS or PFS in both platforms, justifying the median threshold for risk classification. The post-hoc evaluation of training and validation cohorts also support the validity of a median-cutoff classification for the E2F score (Figure S8-9 and Table S9-12).
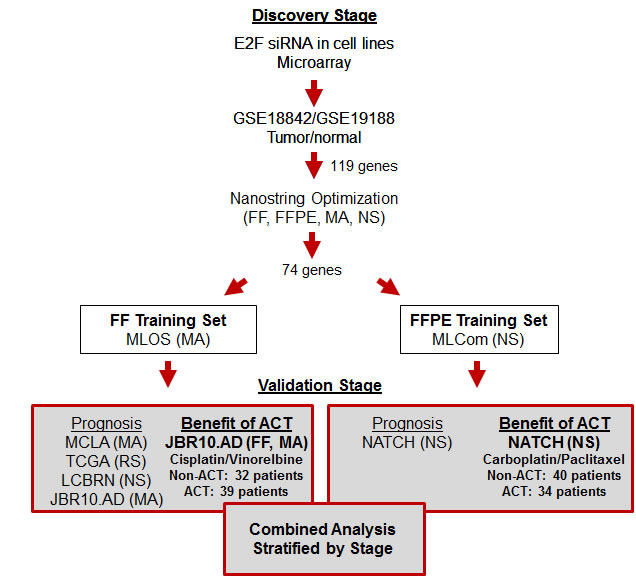
Figure 1: Study Overview. This figure highlights the discovery steps used to define the 74 genes in the E2F scoring system and the subsequent steps and datasets used to validate the prognostic and predictive effects of the E2F score. Experiments that highlight the ability of the E2F assay to predict the benefit of ACT in lung adenocarcinoma surgical patients are in bold. Abbreviations: FF: Fresh Frozen; FFPE: Formalin-Fixed Paraffin-Embedded; MA: Microarray; RS: RNA sequencing; NS: NanoStringTM; ACT: Adjuvant chemotherapy; MCLA: Molecular Classification of Lung Adenocarcinoma; TCGA: The Cancer Genome Atlas; JBR10: National Cancer Institute of Canada, Cancer Center Therapeutics Group; JBR10.AD: the adenocarcinoma subset of JBR10; LCBRN: Lung Cancer Bio-specimen Resource Network; NATCH: (Neo)Adjuvant Taxol/Carboplatin Hope.
The E2F Score is a prognostic marker
The derived E2F score was first tested as a prognostic marker in seven cohorts of resected lung adenocarcinoma patients who did not receive adjuvant chemotherapy. These data, summarized in Table 1, reveal the prognostic value of the E2F score by the log-rank test (Table S13 presents detailed analysis within each cohort, including PFS). Specifically, in the FF platform, each of the five cohorts showed a significant prognostic effect with poor OS in all non-ACT patients with a high E2F score. For stage-specific analysis, the combined FF cohorts (MLOS, MCLA, TCGA, JBR10.AD and LCBRN) demonstrated a strong association between OS and E2F scores in all non-ACT patients and in Stage I non-ACT patients (p < 0.001; HR = 2.38 for all stages and HR = 2.22 for stage I; Table 1) and this significance continued even with covariate adjustment (p < 0.001; HR = 1.88 and 2.16 for all stages and stage I, respectively; Table S14). The median survival time (MST) was 42.9 months in high E2F group and never reached within the study in low E2F group for all stage. MST was never reached for stage I due to longer survival in this subpopulation. For this reason, we used the 5-year survival rate for comparison. The 5-year survival rate increased at least 20% in low-E2F patients (all stages: low E2F: 64% (95% CI: 57% - 71%) versus high E2F: 41% (95% CI: 35% - 48%); stage I: low E2F: 75% (95% CI: 68% - 82%) versus high E2F: 54% (95% CI: 46% - 63%); Table I, Figure 2A and 2B). A similar prognostic trend was observed in stage II and combined stage III/IV patients, but the results were not statistically significant.
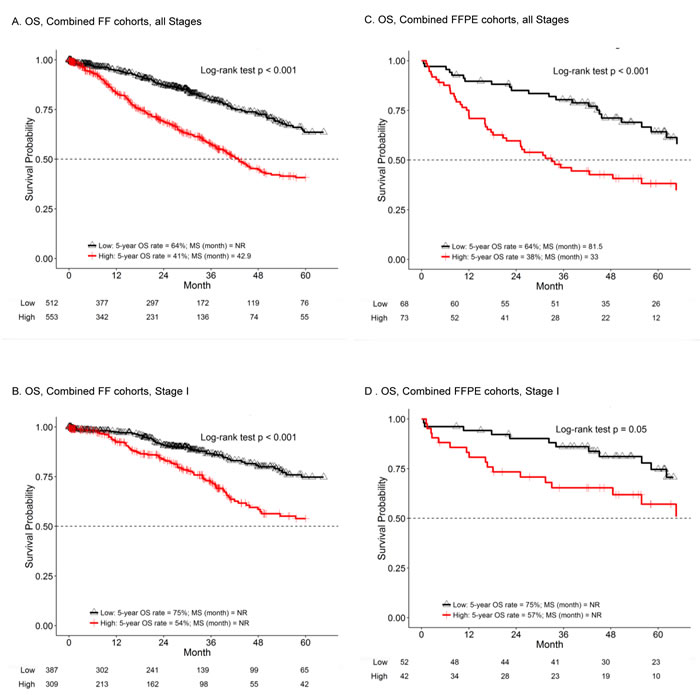
Figure 2: The E2F score is prognostic in multiple lung adenocarcinoma datasets. K-M analysis of OS in the indicated combined cohorts was performed comparing patients with high (red line) or low E2F score (black line). Results for 5-year survival and the log-rank test p value are included in each panel. Numbers at the bottom of the graph indicate the number of patients in each group at risk at 12-month intervals. MS represents median survival time and NR means the MS was never reached. Graphs are truncated at 60 months. A. and B. represent combined FF cohorts. C. and D. represent FFPE cohorts. A and C include patients of all stages. B and D include only stage I patients.
Both FFPE-based cohorts (MLCom and NATCH) had a significant association of the E2F score with OS (p = 0.01-0.04; HR = 1.87-3.26; Table 1) and PFS (p = 0.03-0.04; HR = 1.75-2.57; Table S13) in all non-ACT patients (stages I-IV). The combined cohort (MLCom + NATCH) also exhibited statistically significant association with OS (p < 0.001; HR = 2.29; Table 1) and PFS (p < 0.001; HR = 2.14; Table S13) in all patients. Patients with low E2F had a longer survival than the high E2F patients (MST = 81.5 months versus 33 months). For stage I patients, the significance level was borderline for OS (p = 0.0495; HR = 2.04; Table 1) and PFS (p = 0.046; HR = 1.84; Table S13). Covariate-adjusted association was significant (OS or PFS) in the NATCH cohort (p = 0.03-0.04; HR = 2.59-2.94; Table S14) and the combined cohort (p = 0.01-0.03; HR = 1.80-1.81; Table S14) in all stage patients. In terms of 5-year survival rate, it increased at least 15% in low-E2F patients (all stages: low E2F: 64% (95% CI: 53% - 78%) versus high E2F: 38% (95% CI: 28% - 52%); stage I: low E2F: 75% (95% CI: 62% - 89%) versus high E2F: 57% (95% CI: 43% - 77%); Table 1, Figure 2C and 2D). Additional analysis in the combined FF and FFPE cohorts (JBR10.AD + NATCH) from the two randomized clinical trials again exhibited statistically significant association with OS (with or without covariate adjustment) in all stages (p = 0.004 to < 0.001; HR = 2.87-3.75) and stage I (p = 0.01-0.008; HR = 4.29-4.41) for non-ACT patients (Table S15-16).
Table 1: Prognostic effects of the E2F score in resected lung adenocarcinoma patients who did not receive adjuvant chemotherapy
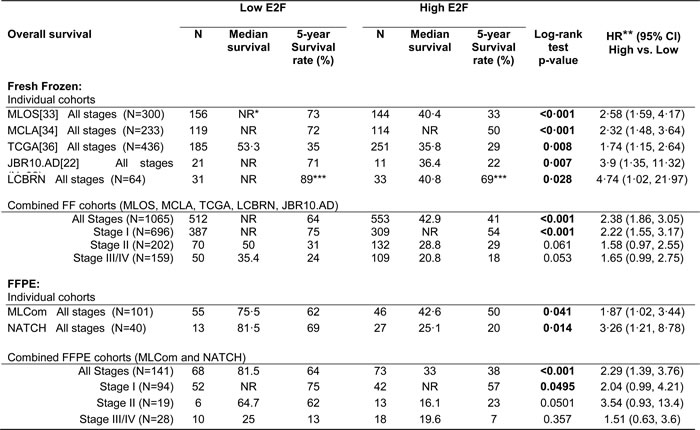
NR*: median survival time not reached within the study
HR**: hazard ratio
*** indicates 3-year survival cutoff since 5-year survival rate was not estimated due to short follow-up
Significant P values are in bold text
The E2F score predicts benefit of ACT
The E2F score was next tested as a predictive marker using two cohorts of lung adenocarcinoma patients, the JBR10 and NATCH trials, that were randomized to either surgery only or surgery followed by ACT. The predictive findings, summarized in Table 2, reveal the predictive value of the E2F score (see Tables S17-18 for additional details for each individual cohort and for PFS outcomes, as well as after adjustment for the effect of tissue type). Specifically, the combined cohort (JBR10.AD and NATCH) exhibited a significant differential ACT treatment effect in all stage patients (with or without covariate adjustment: p = 0.016-0.02 for the interaction effect; Table 2, Table S19, and Figure 3A). Subgroup analysis in the high E2F score group also showed a longer survival in patients with ACT (HR = 0.51 with p = 0.023-0.028; Table 2, Table S19, and Figure 3A). Moreover, the predictive effect was even stronger when considering only stage II patients (with or without covariate adjustment: p = 0.015-0.02 for the interaction effect and HR = 0.21-0.22 with p = 0.012-0.028 in the high E2F score group; Table 2, Table S19, and Figure 3B). Specifically, high-E2F patients demonstrated an increase in MST and 5-year survival (non-ACT: MST = 18 months and a 5-year survival rate of 18% (95% CI: 5% - 64%); ACT: MST = never reached and 5-year survival rate of 81% (95% CI: 60% - 100%); Table 2 and Figure 3B). In contrast, low-E2F patients demonstrated an opposite pattern: patients without ACT had a MST of 73.2 months and a 5-year survival rate of 57% (95% CI of 30% - 100%) while patients with ACT had a MST of 57.8 months and a 5-year survival rate of 41% (95% CI: 20% - 83%) (Table 2 and Figure 3D). Although the ACT treatment effect in stage I patients did not reach statistical significance, stage I patients with high E2F, 5-year survival increased from 31% without ACT to 61% with ACT. In contrast, in stage I patients with low E2F, 5-year survival was 83% in untreated patients and 77% in ACT-treated patients.
Table 2: Predictive effects of the E2F score in resected lung adenocarcinoma patients
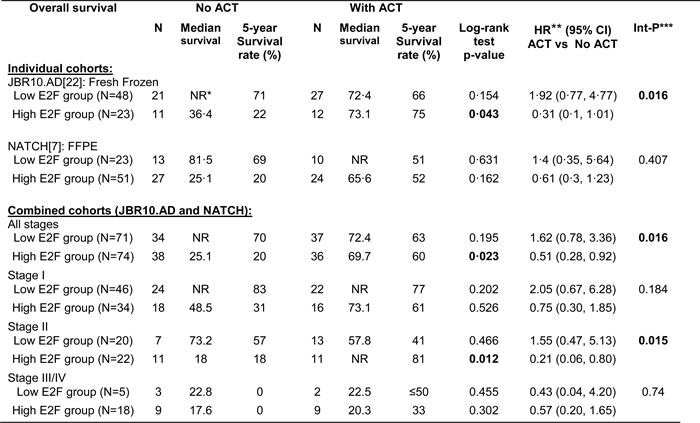
NR*: median survival time not reached within the study
HR**: hazard ratio
Int-P***: P value of interaction effect
Significant P values are in bold text
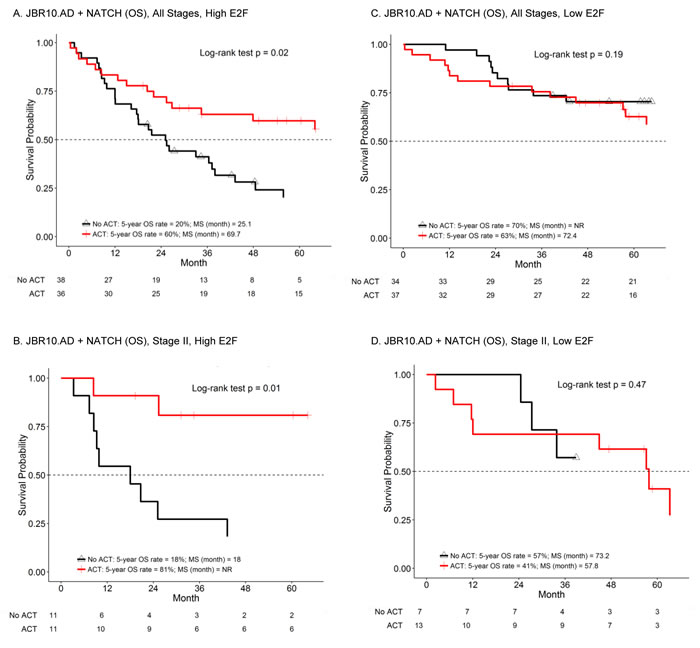
Figure 3: The E2F score predicts benefit of ACT in two randomized clinical trials. K-M analysis of OS in the indicated combined cohorts was performed comparing patients with high E2F A. and B. with ACT (red line) or without ACT (black line) or low E2F C. and D. with ACT (red line) or without ACT (black line). Results for 5-year survival and the log-rank test p value are included in each panel. Numbers at the bottom of the graph indicate the number of patients in each group at risk at 12-month intervals. MS represents median survival time and NR means the MS was never reached. Graphs are truncated at 60 months. A and C represent patients of all stages. B and D represent stage II patients only.
Discussion
We have explored the possibility that a measurement of E2F deregulation, an E2F score, could identify “under-treated” stage I patients likely to benefit from ACT and “over-treated” stage II patients unlikely to benefit from ACT. The resulting E2F score is based on 74 E2F-regulated genes and contains 18 internal control genes. The pathway-based E2F score originated using a targeted siRNA approach in cell lines and was validated using multiple cohorts and platforms. GeneGO analysis (Table S6) demonstrates that the predominant biological pathways downstream of E2F are proliferation and apoptosis, as expected. However, two of the genes in the E2F signature with high loading coefficients and independent predictive power are LAMC2 (laminin C2) and PLAUR (plasminogen activator urokinase receptor), which are not directly tied to cell cycle or apoptosis. Serum levels of LAMC2 have previously been shown to be prognostic in NSCLC [23] and LAMC2 has been shown to drive metastatic potential of lung adenocarcinoma [24] in support of our findings. Likewise, components of the plasminogen activator pathway are thought to contribute to tissue remodeling in the context of tumorigenesis and PLAUR has specifically been implicated as a prognostic biomarker in NSCLC [25].
We have tested the E2F signature in two contexts, 1) as a prognostic biomarker in large number of patients and 2) as a predictive biomarker in patients randomized to surgery only or surgery plus ACT, in two clinical trials. As a prognostic biomarker, E2F-high patients demonstrate a significantly shorter survival than the low E2F-group when considering all patients, and more importantly when considering only stage I patients. Current clinical standard of care does not offer ACT treatment for the majority of stage I patients because this group is considered low-risk. However, the E2F signature was able to identify a subset of stage I patients with poor survival who may benefit from traditional ACT or from a therapy, such as treatment with a cyclin-dependent kinase inhibitor [26], that might counteract the aggressiveness of this E2F-driven disease. Although we cannot directly compare our findings to many other biomarkers [27, 28] in lung adenocarcinoma, such as histological subtype [13], our results indirectly support other investigations that have addressed the potential of proliferation-related genes as prognostic biomarkers. In particular, two products (PervenioTM from Life Technologies and MyPlanTM from Myriad Genetics) have been described for estimating an early-stage NSCLC patient’s likelihood of survival (prognosis) based upon gene expression signatures [16, 17]. Together these studies support the central role that E2F-driven proliferation plays in patient outcome and demonstrate that the E2F pathway is a relevant target to promote patient survival in lung adenocarcinomas.
As a predictive biomarker, the E2F score demonstrated a favorable ACT treatment effect in patients with high E2F when patients of all stages are considered. Further subgroup analysis indicates that the signature retains its predictive power in stage II patients. The benefit from cisplatin-based ACT in resected stage II lung adenocarcinoma patients as a whole has been established by several randomized clinical trials [6-12]. However, these studies also suggest that only a subset of these patients truly benefit from ACT [13]. Our data suggest that stage II patients can be classified as high-E2F patients who are likely to benefit from ACT and low-E2F patients who are unlikely to benefit. Although other gene signatures in lung cancer [15, 22, 29, 30] have been developed for this purpose, none have been validated in two independent randomized trials.
Given that the number of randomized clinical trials in early-staged lung cancer is limited, it was necessary for us to adapt the E2F signature for application to FF tissue to allow the use of the many available datasets, especially JBR10. However, in the future we foresee applying the E2F signature only to FFPE tissues. Informal surveys with practice groups in which we explain the usefulness our test suggest that the test is most likely to be utilized in high-risk stage I patients wishing to improve outcome. While we have not proven that the test is predictive in stage I patients at this point. We suggest that our prognostic data in stage I and predictive data in stage II justify a prospective clinical trial in which stage I lung adenocarcinoma patients with high-E2F scores would be randomized to surgery only or surgery plus ACT. Such a trial should also include other potential predictive markers [13, 27, 28]. Given that the number of patients examined in FFPE format is relatively small, we foresee further optimizing the data analysis component of the assay in a manner that will allow training on new data to be obtained in the future. In the NanoString format, the E2F assay is technically similar to the FDA-approved ProsignaTM assay [2] for prognosis in breast cancer which is being adopted by many CLIA facilities where the assay is performed locally and the data analyzed centrally with fast turnaround.
In conclusion, we have identified and validated an E2F pathway-based scoring system that is a prognostic biomarker in stage I and a predictive biomarker in stage II lung adenocarcinoma patients. The NanoString-based E2F assay described herein represents a potential decision-support tool that would provide valuable information in the choice of ACT in early-stage lung adenocarcinoma patients.
Materials and Methods
Study cohorts
Multiple datasets were used to develop and validate the E2F gene signature in this study (Figure 1 and Table S1). In particular, cells lines and RNAi were used to identify E2F regulated genes, and then two GEO datasets GSE18842 [31] (45 adjacent normal tissues and 46 tumors) and GSE19188 [32] (58 adjacent normal tissues and 87 tumors) were used to identify E2F-regulated genes that were measurably different between tumor and adjacent normal lung tissue. Four published datasets, that reported OS (overall survival) as primary outcome, were used to test the prognostic and/or predictive effects of the E2F signature. The MLOS dataset (Moffitt Lung Adenocarcinoma, Overall Survival) [33] includes 398 patients with available OS from the original 442 Moffitt lung adenocarcinoma patients with microarray gene expression data from fresh frozen (FF) RNA (Accession# GSE72094). The MCLA dataset (Molecular Classification of Lung Adenocarcinoma) [34] includes 442 lung adenocarcinoma patients with microarray gene expression data from FF RNA (Accession# GSE68465). The TCGA dataset (the Cancer Genome Atlas project, lung adenocarcinoma) [35, 36] includes 436 patients. TCGA utilized FF tissue and RNASeq was used to measure gene expression. The JBR10 dataset (National Cancer Institute of Canada Clinical Trials Group) [22] is a subset of the original JBR10 study representing 133 stage IB-II NSCLCs patients for which microarray data from FF tissue is available (Accession# GSE14814). Since this cohort is a mixture of lung adenocarcinomas and squamous cell carcinomas, we analyzed the data in two ways: JBR10 (adenocarcinomas and squamous) and JBR10.AD (adenocarcinoma only).
Three novel patient cohorts were used to test the prognostic/predictive potential of the E2F NanoString assay using OS and PFS (progression-free survival, reported only in the Supplementary Material). Detailed clinical characteristics of all seven cohorts are provided in Table S2 and S3. The LCBRN cohort (Lung Cancer Biospecimen Resource Network) includes 99 lung adenocarcinoma patients with RNA from FF tissue and was used to explore the prognostic effect. The MLCom cohort (Moffitt Lung Adenocarcinoma, Complete) [37] was used to test the prognostic effect and as the training dataset for RNA from FFPE. This cohort includes 150 lung adenocarcinoma patients and is referred to as “complete” since NanoString results were acquired and detailed medical chart review was performed. Although previously reported [37] this is the first time this cohort has been explored with respect to survival. The NATCH cohort [(Neo)-Adjuvant Taxol/Carboplatin Hope] [7] was used for both prognostic and predictive effects. The NATCH trial was a randomized trial including three arms: 1) surgery only, 2) surgery followed by paclitaxel-carboplatin ACT and 3) paclitaxel-carboplatin followed by surgery. Herein, NATCH includes a 74-patient lung adenocarcinoma subset from Arms 1 and 2 for which FFPE blocks were available. An additional cohort, referred to as MLTO (Moffitt Lung Adenocarcinoma Technical Optimization) consisted of 36 lung adenocarcinoma patients for which we obtained matching FF and FFPE tissue for direct comparison. It does not overlap with any other cohorts and was used only for methods optimization.
RNA preparation from tissue samples
RNA from Moffitt patients was acquired through Moffitt’s Tissue Core Facility, an established honest broker system under the supervision of USF’s Institutional Review Board and Moffitt’s Scientific Review Committee. Tissue blocks were reviewed by a certified staff pathologist for confirmation of a diagnosis of adenocarcinoma, and percent malignancy, cellularity, stroma, and immune infiltration. Three 10-μm and one 5-μm sections of each FFPE block were cut. The 5-μm section was stained with hematoxylin and eosin (H&E) and the staff pathologist marked approximate tumor margins using the H&E stained slide. The tumor regions of the three 10-μm slides were excised and subjected to RNA extraction using Qiagen’s RNeasy FFPE kit (as previously reported) [38, 39].
NanoString experiments
NanoString Assays were performed with 150-ng aliquots of RNA using the NanoString nCounter Analysis system (NanoString Technologies, Seattle, WA). Generic codesets (Table S4) were obtained directly from NanoString Technologies and gene-specific oligonucleotides were obtained from IDT (Integrated DNA Technologies, Coralville, Iowa). After codeset hybridization overnight, the samples were washed and immobilized to a cartridge using the NanoString nCounter Prep Station. Cartridges were scanned in the nCounter Digital Analyzer at 555 fields of view for the maximum level of sensitivity. Ultimately, 18 highly invariant genes were selected to serve as internal controls for normalization between samples and 74 genes represented the E2F pathway (Table S5).
Derivation and validation of an E2F scoring system
The overall E2F scoring system was generated by principal component analysis (PCA) [15] with the first principal component (PC1) of the E2F-regulated genes representing the E2F score. First, PCA was performed to derive PC1 in the FF and FFPE training cohorts. Next, PC1 from the training cohort was used to calculate an E2F score in the validation cohorts. Utilization of the median E2F score as the cutoff was justified by systematically comparing various cutoffs. To validate the prognostic and predictive effects of the E2F signature, each platform used the corresponding training cohort to classify patients into low or high E2F groups. The high and low groups in each cohort (or combined cohort) were then used for subsequent analyses. For validation of the prognostic effect, the E2F signature was analyzed to identify survival differences between the high and low E2F groups using the log-rank test or by Cox proportional hazards model for covariate adjustment. For validation of the predictive E2F signature, the Cox proportional hazards model was used to identify any differential treatment effect by testing interaction effect while the log-rank test was used to test the treatment effect (ACT versus non-ACT) in each risk group (low or high E2F).
Statistical analysis
Microarray data processing in patient samples included IRON [40] and COMBAT [41] methods for normalization. NanoStringNorm R package [42] was used to NanoString data. For optimization of the E2F signature in NanoString, Spearman and Pearson correlation analysis was used to remove poorly correlated genes (between FF and FFPE) and to evaluate effects by platforms (microarray and NanoString) and by tissue type (FF and FFPE) using the MLTO cohort. To validate the E2F signature, we employed a training and validation scheme. Specifically, we used the MLOS cohort and the MLCom cohort as the training set for FF and FFPE tissues, respectively. The validation cohorts were MCLA, TCGA, LCBRN and JBR10.AD for the FF platform and the NATCH cohort for the FFPE platform. PCA was used to derive the E2F scoring system as described previously. Log-rank test and Cox proportional hazards model were used for survival analysis. Proportional hazards assumption was performed for the Cox model analyses. OS was defined as from date of surgery (or randomization for JBR10 and NATCH) to date of death or last date of follow-up for those patients still alive. PFS was defined as from date of surgery to date of recurrence, progression, or death. Those alive with no evidence of disease at last follow-up were censored. When information was unknown or unavailable, analyses were performed on the largest possible subset. Sample size justification: For the prognostic effect, we used non-ACT patients from the 5 combined cohorts (MLOS, MCLA, TCGA, JBR10.AD, and LCBRN: 1065 non-ACT patients with 287 events) in fresh frozen platform and 2 cohorts (MLCom and NATCH: N = 141 non-ACT patients with 68 events) in FFPE platform. Assuming 50% prevalence of high E2F in each combined cohort, the sample size of 1065 non-ACT patients with 287 events will have 80% power to detect a hazard ratio of 1.4 (HR: high vs. low E2F) with two-sided 5% type I error. The power for the sample size of 141 non-ACT patients with 68 events will be 80% to detect a HR of 2.03. For the predictive effect, we combined two randomized trials (JBR10.AD and NATCH: N = 145 with 77 events, an overall 5-year survival rate of 53%, and 50% patients in ACT). With this information and assumption of 50% prevalence of high E2F in the ACT and non-ACT, this sample size will have 80% power to detect a hazard ratio of 0.26 (HR in high E2F/HR in low E2F, assuming a 5-year survival rate of 66% and 20% for low and high E2F, respectively, in the control group, and 66% for both low and high E2F in the treatment group) with a two-sided 5% type I error. Power calculation is based on the functions, powerCT.default0 (for the prognostic effect) by R package powerSurvEpi [43] and PowerPredictiveBiomarker.shiny (for the predictive effect) by R package PowerPredictiveBiomarker [44] (github.com/dungtsa/PowerPredictiveBiomarker).
Acknowledgments
We acknowledge the invaluable technical assistance of Moffitt Cancer Center Research staff including: Tania Mesa, Katie Fellows, Michelle Fournier, Marek Wloch, Herman Hernandez, and Noel Clark.
CONFLICTS OF INTEREST
The authors declare that there is no conflict(s) of interest associated with this manuscript
Grant Support
This work was funded by multiple sources, including; La Caixa Foundation and Redes Temáticas en Cancer (RTICC) (RD12/0036/0072) (R. R. and J. L. R.), the James and Esther King Biomedical Research Program Grant (5JK06) from the Florida Department of Health (W.D.C.), the National Institutes of Health/National Cancer Institute grant CA90489 (W.D.C.), a Specialized Programs of Research Excellence (SPORE) P50 CA119997 (E. H. and W.D.C.), a U54 Partnership Grant CA163068 (T.M-A and W.D.C), a USF Presidential Fellowship (B.E.E.), Moffitt’s Lung Cancer Center of Excellence and by the Tissue Core and Molecular Genomics Facilities at the H. Lee Moffitt Cancer Center & Research Institute, an NCI-designated Comprehensive Cancer Center (P30-CA076292).
Editorial note
This paper has been accepted based in part on peer-review conducted by another journal and the authors’ response and revisions as well as expedited peer-review in Oncotarget.
References
1. Cronin M, Sangli C, Liu ML, Pho M, Dutta D, Nguyen A, Jeong J, Wu J, Langone KC, Watson D. Analytical validation of the Oncotype DX genomic diagnostic test for recurrence prognosis and therapeutic response prediction in node-negative, estrogen receptor-positive breast cancer. Clinical Chemistry 2007; 53: 1084-91. doi: clinchem.2006.076497 [pii] 10.1373/clinchem.2006.076497.
2. Gnant M, Filipits M, Greil R, Stoeger H, Rudas M, Bago-Horvath Z, Mlineritsch B, Kwasny W, Knauer M, Singer C, Jakesz R, Dubsky P, Fitzal F, et al. Predicting distant recurrence in receptor-positive breast cancer patients with limited clinicopathological risk: using the PAM50 Risk of Recurrence score in 1478 postmenopausal patients of the ABCSG-8 trial treated with adjuvant endocrine therapy alone. Ann Oncol. 2014; 25: 339-45. doi: mdt494 [pii] 10.1093/annonc/mdt494.
3. Beumer I, Witteveen A, Delahaye L, Wehkamp D, Snel M, Dreezen C, Zheng J, Floore A, Brink G, Chan B, Linn S, Bernards R, van ‘t Veer L, et al. Equivalence of MammaPrint array types in clinical trials and diagnostics. Breast Cancer Res Treat. 2016; 156: 279-87. doi: 10.1007/s10549-016-3764-5.
4. Siegel R, Ma J, Zou Z, Jemal A. Cancer Statistics, 2014. CA Cancer J Clin. 2014; 64: 9-29. doi: 10.3322/caac.21208.
5. Wallerek S, Sorensen JB. Biomarkers for efficacy of adjuvant chemotherapy following complete resection in NSCLC stages I-IIIA. Eur Respir Rev. 2015; 24: 340-55. doi: 10.1183/16000617.00005814.
6. Pignon JP, Tribodet H, Scagliotti GV, Douillard JY, Shepherd FA, Stephens RJ, Dunant A, Torri V, Rosell R, Seymour L, Spiro SG, Rolland E, Fossati R, et al. Lung adjuvant cisplatin evaluation: a pooled analysis by the LACE Collaborative Group. J Clin Oncol. 2008; 26: 3552-9. doi: JCO.2007.13.9030 [pii] 10.1200/JCO.2007.13.9030.
7. Felip E, Rosell R, Maestre JA, Rodriguez-Paniagua JM, Moran T, Astudillo J, Alonso G, Borro JM, Gonzalez-Larriba JL, Torres A, Camps C, Guijarro R, Isla D, et al. Preoperative chemotherapy plus surgery versus surgery plus adjuvant chemotherapy versus surgery alone in early-stage non-small-cell lung cancer. J Clin Oncol. 2010; 28: 3138-45. doi: JCO.2009.27.6204 [pii] 10.1200/JCO.2009.27.6204.
8. Arriagada R, Bergman B, Dunant A, Le Chevalier T, Pignon JP, Vansteenkiste J. Cisplatin-based adjuvant chemotherapy in patients with completely resected non-small-cell lung cancer. N Engl J Med. 2004; 350: 351-60. doi: 10.1056/NEJMoa031644 350/4/351 [pii].
9. Winton T, Livingston R, Johnson D, Rigas J, Johnston M, Butts C, Cormier Y, Goss G, Inculet R, Vallieres E, Fry W, Bethune D, Ayoub J, et al. Vinorelbine plus cisplatin vs. observation in resected non-small-cell lung cancer. N Engl J Med. 2005; 352: 2589-97. doi: 352/25/2589 [pii] 10.1056/NEJMoa043623.
10. Douillard JY, Rosell R, De Lena M, Carpagnano F, Ramlau R, Gonzales-Larriba JL, Grodzki T, Pereira JR, Le Groumellec A, Lorusso V, Clary C, Torres AJ, Dahabreh J, et al. Adjuvant vinorelbine plus cisplatin versus observation in patients with completely resected stage IB-IIIA non-small-cell lung cancer (Adjuvant Navelbine International Trialist Association [ANITA]): a randomised controlled trial. Lancet Oncol. 2006; 7: 719-27. doi: S1470-2045(06)70804-X [pii] 10.1016/S1470-2045(06)70804-X.
11. Scagliotti GV, Fossati R, Torri V, Crino L, Giaccone G, Silvano G, Martelli M, Clerici M, Cognetti F, Tonato M, Adjuvant Lung Project Italy/European Organisation for Research Treatment of Cancer-Lung Cancer Cooperative Group I. Randomized study of adjuvant chemotherapy for completely resected stage I, II, or IIIA non-small-cell Lung cancer. J Natl Cancer Inst. 2003; 95: 1453-61.
12. Waller D, Peake MD, Stephens RJ, Gower NH, Milroy R, Parmar MK, Rudd RM, Spiro SG. Chemotherapy for patients with non-small cell lung cancer: the surgical setting of the Big Lung Trial. Eur J Cardiothorac Surg. 2004; 26: 173-82. doi: 10.1016/j.ejcts.2004.03.041 S1010794004002404.
13. Tsao MS, Marguet S, Le Teuff G, Lantuejoul S, Shepherd FA, Seymour L, Kratzke R, Graziano SL, Popper HH, Rosell R, Douillard JY, Le-Chevalier T, Pignon JP, et al. Subtype Classification of Lung Adenocarcinoma Predicts Benefit From Adjuvant Chemotherapy in Patients Undergoing Complete Resection. J Clin Oncol. 2015; 33: 3439-46. doi: 10.1200/JCO.2014.58.8335.
14. Xie Y, Xiao G, Coombes K, Behrens C, Solis LM, Raso MG, Girard L, Erickson HS, Roth JA, Heymach JV, Moran C, Danenberg KD, Minna JD, et al. Robust Gene Expression Signature from Formalin-Fixed Paraffin-Embedded Samples Predicts Prognosis of Non-Small-Cell Lung Cancer Patients. Clin Cancer Res. 2011; 17: 5705-14. doi: 1078-0432.CCR-11-0196 [pii] 10.1158/1078-0432.CCR-11-0196.
15. Chen DT, Hsu YL, Fulp WJ, Coppola D, Haura EB, Yeatman TJ, Cress WD. Prognostic and predictive value of a malignancy-risk gene signature in early-stage non-small cell lung cancer. J Natl Cancer Inst. 2011; 103: 1859-70. doi: djr420 [pii] 10.1093/jnci/djr420.
16. Kratz JR, He J, Van Den Eeden SK, Zhu ZH, Gao W, Pham PT, Mulvihill MS, Ziaei F, Zhang H, Su B, Zhi X, Quesenberry CP, Habel LA, et al. A practical molecular assay to predict survival in resected non-squamous, non-small-cell lung cancer: development and international validation studies. Lancet. 2012; 379: 823-32. doi: S0140-6736(11)61941-7 [pii] 10.1016/S0140-6736(11)61941-7.
17. Wistuba, II, Behrens C, Lombardi F, Wagner S, Fujimoto J, Raso MG, Spaggiari L, Galetta D, Riley R, Hughes E, Reed J, Sangale Z, Swisher SG, et al. Validation of a Proliferation-based Expression Signature as Prognostic Marker in Early Stage Lung Adenocarcinoma. Clin Cancer Res. 2013; 19: 6261-71. doi: 1078-0432.CCR-13-0596 [pii] 10.1158/1078-0432.CCR-13-0596.
18. Johnson DG, Schwarz JK, Cress WD, Nevins JR. Expression of transcription factor E2F1 induces quiescent cells to enter S phase. Nature. 1993; 365: 349-52.
19. Wang C, Chen L, Hou X, Li Z, Kabra N, Ma Y, Nemoto S, Finkel T, Gu W, Cress WD, Chen J. Interactions between E2F1 and SirT1 regulate apoptotic response to DNA damage. Nat Cell Biol. 2006; 8: 1025-31.
20. Cress WD. E2F1: A new role in the DNA damage response. Cell Cycle. 2011; 10: 1718. doi: 15687.
21. Kurtyka CA, Chen L, Cress WD. E2F inhibition synergizes with paclitaxel in lung cancer cell lines. PLoS ONE. 2014; 9: e96357. doi: 10.1371/journal.pone.0096357.
22. Zhu CQ, Ding K, Strumpf D, Weir BA, Meyerson M, Pennell N, Thomas RK, Naoki K, Ladd-Acosta C, Liu N, Pintilie M, Der S, Seymour L, et al. Prognostic and predictive gene signature for adjuvant chemotherapy in resected non-small-cell lung cancer. J Clin Oncol. 2010; 28: 4417-24. doi: JCO.2009.26.4325 [pii] 10.1200/JCO.2009.26.4325.
23. Korbakis D, Dimitromanolakis A, Prassas I, Davis GJ, Barber E, Reckamp KL, Blasutig I, Diamandis EP. Serum LAMC2 enhances the prognostic value of a multi-parametric panel in non-small cell lung cancer. Br J Cancer. 2015; 113: 484-91. doi: 10.1038/bjc.2015.171.
24. Moon YW, Rao G, Kim JJ, Shim HS, Park KS, An SS, Kim B, Steeg PS, Sarfaraz S, Changwoo Lee L, Voeller D, Choi EY, Luo J, et al. LAMC2 enhances the metastatic potential of lung adenocarcinoma. Cell Death Differ. 2015; 22: 1341-52. doi: 10.1038/cdd.2014.228.
25. Zheng W, Jiang C, Li R. Integrin and gene network analysis reveals that ITGA5 and ITGB1 are prognostic in non-small-cell lung cancer. OncoTargets and Therapy. 2016; 9: 2317-27.
26. O’Leary B, Finn RS, Turner NC. Treating cancer with selective CDK4/6 inhibitors. Nat Rev Clin Oncol. 2016; 13: 417-30. doi: 10.1038/nrclinonc.2016.26.
27. Graziano SL, Gu L, Wang X, Tatum AH, Vollmer RT, Strauss GM, Kratzke R, Dudek AZ, Vokes EE, Green MR, Cancer, Leukemia Group B, North Central Cancer Treatment G, et al. Prognostic significance of mucin and p53 expression in stage IB non-small cell lung cancer: a laboratory companion study to CALGB 9633. J Thorac Oncol. 2010; 5: 810-7.
28. Reiman T, Lai R, Veillard AS, Paris E, Soria JC, Rosell R, Taron M, Graziano S, Kratzke R, Seymour L, Shepherd FA, Pignon JP, Seve P, et al. Cross-validation study of class III beta-tubulin as a predictive marker for benefit from adjuvant chemotherapy in resected non-small-cell lung cancer: analysis of four randomized trials. Ann Oncol. 2012; 23: 86-93. doi: 10.1093/annonc/mdr033.
29. Tang H, Xiao G, Behrens C, Schiller J, Allen J, Chow CW, Suraokar M, Corvalan A, Mao J, White MA, Wistuba, II, Minna JD, Xie Y. A 12-Gene Set Predicts Survival Benefits from Adjuvant Chemotherapy in Non-Small Cell Lung Cancer Patients. Clin Cancer Res. 2013; 19 1577-86. doi: 1078-0432.CCR-12-2321 [pii] 10.1158/1078-0432.CCR-12-2321.
30. Van Laar RK. Genomic signatures for predicting survival and adjuvant chemotherapy benefit in patients with non-small-cell lung cancer. BMC Med Genomics. 2012; 5: 30. doi: 10.1186/1755-8794-5-30.
31. Sanchez-Palencia A, Gomez-Morales M, Gomez-Capilla JA, Pedraza V, Boyero L, Rosell R, Farez-Vidal ME. Gene expression profiling reveals novel biomarkers in nonsmall cell lung cancer. Int J Cancer. 2011; 129: 355-64. doi: 10.1002/ijc.25704.
32. Hou J, Aerts J, den Hamer B, van Ijcken W, den Bakker M, Riegman P, van der Leest C, van der Spek P, Foekens JA, Hoogsteden HC, Grosveld F, Philipsen S. Gene expression-based classification of non-small cell lung carcinomas and survival prediction. PLoS ONE. 2010; 5: e10312. doi: 10.1371/journal.pone.0010312.
33. Schabath MB, Welsh EA, Fulp WJ, Chen L, Teer JK, Thompson ZJ, Engel BE, Xie M, Berglund AE, Creelan BC, Antonia SJ, Gray JE, Eschrich SA, et al. Differential association of STK11 and TP53 with KRAS mutation-associated gene expression, proliferation and immune surveillance in lung adenocarcinoma. Oncogene. 2016; 35: 3209-16. doi: 10.1038/onc.2015.375.
34. Shedden K, Taylor JM, Enkemann SA, Tsao MS, Yeatman TJ, Gerald WL, Eschrich S, Jurisica I, Giordano TJ, Misek DE, Chang AC, Zhu CQ, Strumpf D, et al. Gene expression-based survival prediction in lung adenocarcinoma: a multi-site, blinded validation study. Nat Med. 2008; 14: 822-7.
35. Hammerman PS, Hayes DN, Wilkerson MD, Schultz N, Bose R, Chu A, Collisson EA, Cope L, Creighton CJ, Getz G, Herman JG, Johnson BE, Kucherlapati R, et al. Comprehensive genomic characterization of squamous cell lung cancers. Nature. 2012; 489: 519-25. doi: nature11404 [pii] 10.1038/nature11404.
36. TCGA. Comprehensive molecular profiling of lung adenocarcinoma. Nature. 2014; 511: 543-50. doi: nature13385 [pii] 10.1038/nature13385.
37. Chen L, Engel BE, Welsh EA, Yoder SJ, Brantley SG, Chen DT, Beg AA, Cao C, Kaye FJ, Haura EB, Schabath MB, Cress WD. A sensitive NanoString-based assay to score STK11 (LKB1) pathway disruption in lung adenocarcinoma. J Thorac Oncol. 2016; 11: 838-49. doi: 10.1016/j.jtho.2016.02.009.
38. Northcott PA, Shih DJ, Remke M, Cho YJ, Kool M, Hawkins C, Eberhart CG, Dubuc A, Guettouche T, Cardentey Y, Bouffet E, Pomeroy SL, Marra M, et al. Rapid, reliable, and reproducible molecular sub-grouping of clinical medulloblastoma samples. Acta Neuropathol. 2011; 123: 615-26. doi: 10.1007/s00401-011-0899-7.
39. Bohmann K, Hennig G, Rogel U, Poremba C, Mueller BM, Fritz P, Stoerkel S, Schaefer KL. RNA extraction from archival formalin-fixed paraffin-embedded tissue: a comparison of manual, semiautomated, and fully automated purification methods. Clin Chem. 2009; 55: 1719-27. doi: clinchem.2008.122572 [pii] 10.1373/clinchem.2008.122572.
40. Welsh EA, Eschrich SA, Berglund AE, Fenstermacher DA. Iterative rank-order normalization of gene expression microarray data. BMC Bioinformatics. 2013; 14: 153. doi: 1471-2105-14-153 [pii] 10.1186/1471-2105-14-153.
41. Johnson WE, Li C, Rabinovic A. Adjusting batch effects in microarray expression data using empirical Bayes methods. Biostatistics. 2007; 8: 118-27. doi: 10.1093/biostatistics/kxj037.
42. Waggott D, Chu K, Yin S, Wouters BG, Liu FF, Boutros PC. NanoStringNorm: An Extensible R Package For the Pre-Processing of NanoString mRNA and miRNA Data. Bioinformatics. 2012; 28: 1546-8. doi: bts188 [pii] 10.1093/bioinformatics/bts188.
43. Schmoor C, Sauerbrei W, Schumacher M. Sample size considerations for the evaluation of prognostic factors in survival analysis. Stat Med. 2000; 19: 441-52.
44. Chen DT, Huang PY, Lin HY, Haura EB, Antonia SJ, Cress WD, Gray JE. Strategies for power calculations in predictive biomarker studies in survival data. Oncotarget. 2016; 7:80373-81. doi: 10.18632/oncotarget.12124.