
INTRODUCTION
Gastric adenocarcinoma is one of the most common causes of cancer-related death, especially in Eastern Asia, Central and Eastern Europe, and South America. [1] Although the incidence of gastric adenocarcinoma has declined dramatically, gastric cancer is the second most common cause of cancer death worldwide [2].
Cytotoxic T-lymphocyte-associated antigen 4 (CTLA-4; also known as CD152) is expressed on T-cells and is known to act as an inhibitory receptor competing with the T-cell costimulatory receptor, CD28. CTLA-4 shares the same ligands, CD80 and CD86, which are expressed on antigen-presenting cells (APCs), and blocks the early stages of T cell activation as a result [3]. CTLA-4 is also involved in tumor immunity associated with negative regulation of T-cell receptors [4]. Additionally, constitutive CTLA-4 expression in various human malignant solid tumor cell lines enabled not only its role in negative control of immune responses but also in the neoplastic process [5].
Programmed cell death protein 1 (PD-1; also known as CD279), a member of the B7-CD28 family, is another key inhibitory receptor expressed on activated T-cells, particularly cytotoxic T-cells, B-cells, monocytes, and natural killer cells, and harbors two ligands, programmed death-ligand 1 (PD-L1) (B7-H1, CD274) and PD-L2 (B7-DC) [6]. Among these, PD-L1 expressed in tumor cells or APCs binds to PD-1 receptors on activated T-cells and inhibits T-cell responses by inhibiting antigen receptor signaling [7]. The PD-1/PD-L1 pathway is thought to be the key regulator of tumor-induced immune suppression [8]. Expression of PD-L1 is reported to be associated with poor prognosis in various tumors [9–11].
The purpose of cancer immunotherapy research is the development of methods to enhance existing host anti-tumor responses. Cancer immunotherapy, by blocking inhibitory receptors such as CTLA-4 and PD-1/PD-L1, is being actively studied and applied to the treatment of various cancers, including melanoma, and lung and kidney cancers [12].
The Cancer Genome Atlas Research Network defined four molecular subtypes of gastric adenocarcinomas: tumors positive for Epstein–Barr virus, microsatellite unstable tumors, genomically stable tumors, and tumors with chromosomal instability [13]. Tumors positive for Epstein–Barr virus showed elevated PD-L1 expression, suggesting the rolls of immune checkpoint inhibitors in gastric cancer.
In this study, we conducted immunohistochemical (IHC) studies of CTLA-4, PD-1, PD-L1, and CD8 using 464 gastric cancer tissue microarrays and evaluated the expression of molecular markers related to immune checkpoint inhibition. We also analyzed the correlations between molecular-marker expression, clinicopathologic factors, and survival outcomes.
RESULTS
Expression of molecular markers and correlation with clinicopathological features
In total, representative tumor sections from 464 gastric adenocarcinoma tissues were constructed from FFPE tissue, but thirteen cases were excluded because of loss of tissue cores during cutting, mounting, or the IHC staining process. The representative microscopic images from IHC staining are shown in Figure 1. Clinicopathologic characteristics of patients in relation to molecular markers are shown in Table 1.
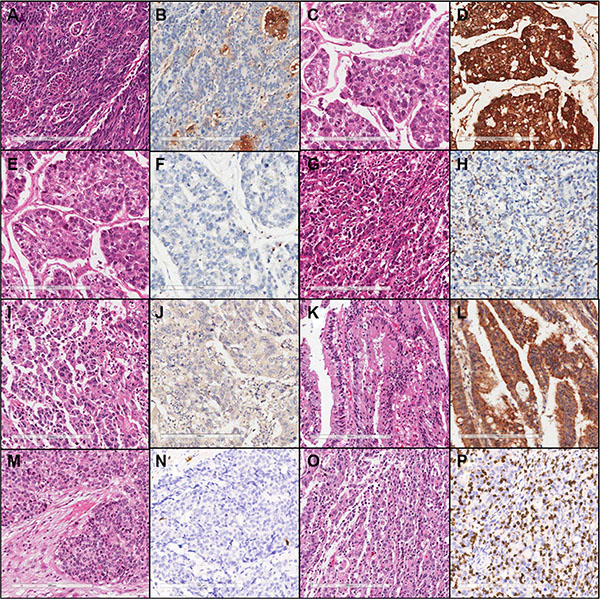
Figure 1: Representative microscopic images of hematoxylin & eosin and immunohistochemical staining (×200) of low PD-L1 (A, B), high PD-L1 (C, D), low PD-1 (E, F), high PD-1 (G, H), low CTLA-4 (I, J), high CTLA-4 (K, L), low CD8 (M, N), and high CD8 expression (O, P).
Table 1: Associations of PD-L1, PD-1, CD8, and CTLA-4 expression levels with clinicopathological factors
PD-L1 (%) |
PD-1 (%) |
CD8 (%) |
CTLA-4 (%) |
|||||||||
|---|---|---|---|---|---|---|---|---|---|---|---|---|
Low |
High |
p-value |
Low |
High |
p-value |
Low |
High |
p -value |
Low |
High |
p-value |
|
Age (yr. ) |
0. 453 |
0. 429 |
0. 489 |
0. 840 |
||||||||
≤ 65 |
94 (68. 12) |
201 (64. 22) |
143 (63. 56) |
152 (67. 26) |
151 (67. 11) |
144 (63. 72) |
174 (64. 93) |
121 (66. 12) |
||||
> 65 |
44 (31. 88) |
112 (35. 78) |
82 (36. 44) |
74 (32. 74) |
74 (32. 89) |
82 (36. 28) |
94 (35. 07) |
62 (33. 88) |
||||
T-stage |
< 0. 001* |
0. 021* |
0. 225 |
0. 031* |
||||||||
Tis, T1 |
108 (78. 26) |
65 (20. 77) |
101 (44. 89) |
72 (31. 86) |
96 (42. 67) |
77 (34. 07) |
96 (35. 82) |
77 (42. 08) |
||||
T2 |
11 (7. 97) |
51 (16. 29) |
24 (10. 67) |
38 (16. 81) |
26 (11. 56) |
36 (15. 93) |
30 (11. 19) |
32 (17. 49) |
||||
T3 |
6 (4. 35) |
60 (19. 17) |
33 (14. 67) |
33 (14. 60) |
33 (14. 67) |
33 (14. 6) |
40 (14. 93) |
26 (14. 21) |
||||
T4 |
13 (9. 42) |
137 (43. 77) |
67 (29. 78) |
83 (36. 73) |
70 (31. 11) |
80 (35. 4) |
102 (38. 06) |
48 (26. 23) |
||||
Tumor grade |
< 0. 001* |
< 0. 001* |
< 0. 001* |
0. 003* |
||||||||
WD |
51 (36. 96) |
20 (6. 39) |
50 (22. 22) |
21 (9. 29) |
49 (21. 78) |
22 (9. 73) |
31 (11. 57) |
40 (21. 86) |
||||
MD |
66 (47. 83) |
96 (30. 67) |
92 (40. 89) |
70 (30. 97) |
96 (42. 67) |
66 (29. 2) |
93 (34. 70) |
69 (37. 70) |
||||
PD |
21 (15. 22) |
197 (62. 94) |
83 (36. 89) |
135 (59. 73) |
80 (35. 56) |
138 (61. 06) |
144 (53. 73) |
74 (40. 44) |
||||
Lauren histologic type |
< 0. 001* |
0. 001* |
0. 001* |
0. 034* |
||||||||
Intestinal |
130 (94. 20) |
166 (53. 04) |
164 (72. 89) |
132 (58. 41) |
46 (42. 99) |
132 (58. 41) |
165 (61. 57) |
131 (71. 58) |
||||
Diffuse, mixed, and indeterminate |
8 (5. 80) |
147 (46. 96) |
61 (27. 11) |
94 (41. 59) |
61 (57. 01) |
94 (41. 59) |
103 (38. 43) |
52 (28. 42) |
||||
Lymph-node metastasis |
< 0. 001* |
0. 221 |
0. 638 |
0. 250 |
||||||||
NO |
114 (82. 61) |
117 (37. 38) |
122 (54. 22) |
109 (48. 23) |
118 (52. 44) |
113 (50) |
131 (48. 88) |
100 (54. 64) |
||||
N1 to N3 |
24 (17. 39) |
196 (62. 62) |
103 (45. 78) |
117 (51. 77) |
107 (47. 56) |
113 (50) |
137 (51. 12) |
83 (45. 36) |
||||
Lymphatic invasion |
< 0. 001* |
0. 013* |
0. 486 |
0. 479 |
||||||||
Negative |
117 (84. 78) |
182 (58. 15) |
162 (72) |
137 (60. 62) |
153 (68) |
146 (64. 6) |
174 (64. 93) |
125 (68. 31) |
||||
Positive |
21 (15. 22) |
131 (41. 85) |
63 (28) |
89 (39. 38) |
72 (32) |
80 (35. 4) |
94 (35. 07) |
58 (31. 69) |
||||
Venous invasion |
0. 333 |
0. 656 |
0. 828 |
0. 265 |
||||||||
Negative |
134 (97. 10) |
296 (94. 57) |
216 (96) |
214 (94. 69) |
214 (95. 11) |
213 (95. 52) |
258 (96. 27) |
172 (93. 99) |
||||
Positive |
4 (2. 90) |
17 (5. 43) |
9 (4) |
12 (5. 31) |
11 (4. 89) |
10 (4. 48) |
10 (3. 73) |
11 (6. 01) |
||||
Perineural invasion |
< 0. 001* |
0. 089 |
0. 089 |
0. 031* |
||||||||
Negative |
126 (91. 30) |
204 (53. 04) |
173 (76. 89) |
157 (69. 47) |
173 (76. 89) |
157 (69. 47) |
186 (69. 40) |
144 (78. 69) |
||||
Positive |
12 (8. 70) |
109 (34. 82) |
52 (23. 11) |
69 (30. 53) |
52 (23. 11) |
69 (30. 53) |
82 (30. 60) |
39 (21. 31) |
||||
*Statistically significant p-values are indicated in boldface type.
Abbreviations: WD, well differentiated; MD, moderately differentiated; PD, poorly differentiated
Statistically significant correlations were found in association with PD-1, PD-L1, and CD8 expressions. CTLA-4 expression was correlated negatively with PD-L1 (p value = 0. 012, r = −0.118; Table 2).
Table 2: Intercorrelation between PD-L1, PD1, CTLA-4, and CD8+ tumor-infiltrating lymphocytes
PD-L1 |
CTLA-4 |
CD8+ TILs |
|||||||
|---|---|---|---|---|---|---|---|---|---|
Low |
High |
p-value |
Low |
High |
p-value |
Low |
High |
p-value |
|
PD-1 |
0. 034* |
0. 376 |
< 0. 001* |
||||||
Low |
74 |
134 |
119 |
89 |
150 |
58 |
|||
High |
64 |
179 |
149 |
94 |
75 |
168 |
|||
CD8+ TILs |
0. 023* |
0. 66 |
|||||||
Low |
80 |
145 |
136 |
89 |
|||||
High |
58 |
168 |
132 |
94 |
|||||
CTLA-4 |
0. 012* |
||||||||
Low |
70 |
198 |
|||||||
High |
68 |
115 |
|||||||
*Statistically significant p-values are indicated in boldface type.
Abbreviations: TILs, tumor infiltrating lymphocytes.
Prognostic value of CTLA-4, PD-L1, PD-1, and CD8 expression
Analyzing all patients, Kaplan-Meier analyses showed that the high-expression groups for PD-L1 and PD-1 had worse overall survival (OS) at five years than low-expression groups for PD-L1 and PD-1. (p value < 0.001 and 0.032; Figure 2). Other pathologic factors, such as Lauren histologic grade (p value <0. 001), advanced gastric carcinoma (AGC) (p value <0. 001), lymph node metastasis (p value <0. 001), lymphatic invasion (p value < 0. 001), and perineural invasion (p value < 0. 001) also had statistically significant prognostic effects on five-year OS in univariate Kaplan–Meier analyses. CTLA-4 and CD8+ TILs (tumor infiltrating lymphocytes) expressions were not statistically significant.
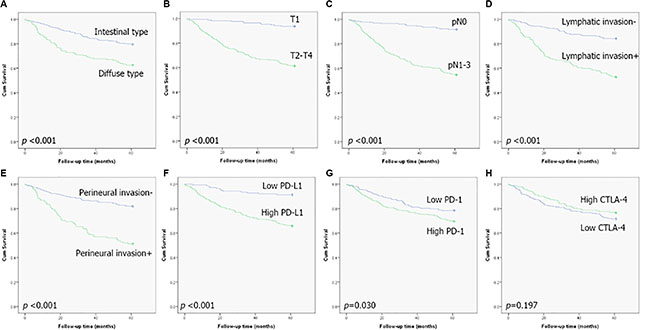
Figure 2: Kaplan-Meier plots of five-year survival for all patients. (A) Lauren classification, (B) early versus advanced stage, (C) lymph-node metastasis, (D) lymphatic invasion, (E) perineural invasion, (F) PD-L1 expression, (G) PD-1 expression, and (H) CTLA-4 expression.
In Cox multivariate analyses, expression of PD-L1 and PD-1 showed no significant independent prognostic effect on five-year OS (Table 3).
Table 3: Multivariate analyses of variables in relation to five-year overall survival of all patients
Variables |
Parameter |
Hazard ratio (95% CI) |
p-value |
|---|---|---|---|
Lauren classification |
Diffuse vs. intestinal |
1. 044 (0. 707–1. 544) |
0. 827 |
Tumor stage |
pT2-4 vs. pT1 |
0. 423 (0. 200–0. 895) |
0. 024* |
Lymph-node metastasis |
Present vs. absent |
0. 346 (0. 193−0. 621) |
< 0. 001* |
Lymphatic invasion |
Present vs. absent |
0. 581 (0. 390−0. 866) |
0. 008* |
Perineural invasion |
Present vs. absent |
0. 682 (0. 462−1. 005) |
0. 053 |
PD-L1 |
High vs. low |
0. 647 (0. 335−1. 250) |
0. 195 |
PD1 |
High vs. low |
1. 345 (0. 922−1. 963) |
0. 124 |
*Statistically significant p-values are indicated in boldface type.
Abbreviations: CI, confidence interval.
For survival analyses to assess the combination of PD-L1 overexpression and CD8+ TILs, we classified patients into four groups: CD8-/PD-L1-, CD8-/PD-L1+, CD8+/PD-L1-, and CD8+/PD-1+ (Figure 3). Kaplan-Meier survival curves were then used to roughly separate the patients into two groups: 1) CD8-/PD-L1-, CD8+/PD-L1- and 2) CD8-/PD-L1+, CD8+/PD-1+ (p value < 0.001). The high PD-L1 expression group (CD8-/PD-L1+, CD8+/PD-1+) showed poor survival compared to the low PD-L1 expression group (CD8-/PD-L1-, CD8+/PD-L1-).
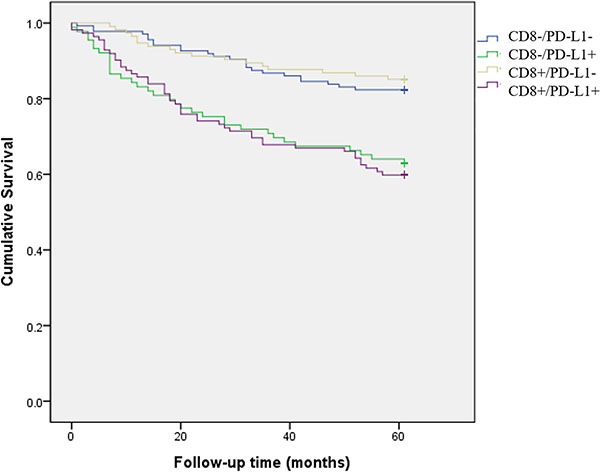
Figure 3: Kaplan-Meier plots of five-year survival for four patient groups: CD8-/PD-L1-, CD8-/PD-L1+, CD8+/PD-L1-, and CD8+/PD-1+. The high PD-L1 expression group (CD8-/PD-L1+, CD8+/PD-1+) showed poor survival compared to the low PD-L1 expression group (CD8-/PD-L1-, CD8+/PD-L1-).
Next, we performed a subgroup analysis dividing the patients into two groups in terms of high CD8+ and low CD8+ TILs. In the high CD8+ TIL group, high PD-L1 expression was significantly related to lower five-year OS in univariate analysis. (Figure 4) Multivariate analyses using Cox proportional hazard regression also revealed the independent prognostic value of PD-L1 expression (Table 4). In the CD8 low-expression group, a significant adverse survival effect was also seen for the high PD-L1 expression group in a univariate analysis (p value < 0. 001) but Cox multivariate analyses revealed no statistical significance.
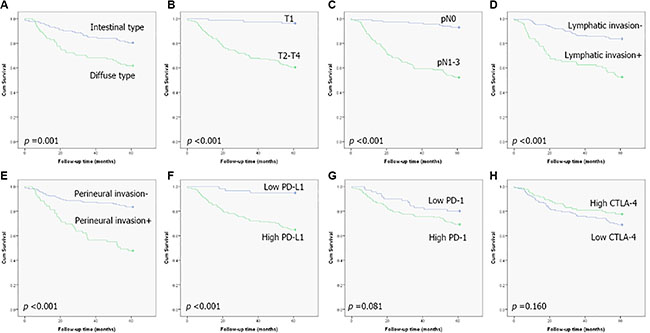
Figure 4: Kaplan-Meier plots of five-year survival for patients with high CD8+ tumor-infiltrating lymphocytes: (A) Lauren classification, (B) early versus advanced stage, (C) lymph-node metastasis, (D) lymphatic invasion, (E) perineural invasion, (F) PD-L1 expression, (G) PD-1 expression, and (H) CTLA-4 expression.
Table 4: Multivariate analyses of variables in relation to five-year overall survival of patients with high CD8+ tumor-infiltrating lymphocytes
Variables |
Parameter |
Hazard ratio (95% CI) |
p-value |
|---|---|---|---|
Lauren classification |
Diffuse vs. intestinal |
1. 102 (0. 647−1. 878) |
0. 72 |
Tumor stage |
pT2-4 vs. pT1 |
0. 282 (0. 081−0. 986) |
0. 047* |
Lymph node metastasis |
Present vs. absent |
0. 285 (0. 125−0. 651) |
0. 003* |
Lymphatic invasion |
Present vs. absent |
0. 633 (0. 367−1. 093) |
0. 101 |
Perineural invasion |
Present vs. absent |
0. 602 (0. 355−1. 022) |
0. 06 |
PD-L1 |
High vs. low |
0. 045 (0. 089−0. 974) |
0. 045* |
*Statistically significant p-values are indicated in boldface type.
Abbreviations: CI, confidence interval.
DISCUSSION
This study used IHC staining to assess the prognostic significance of PD-1, PD-L1, and CTLA-4 in gastric adenocarcinoma samples.
We examined PD-L1 and CTLA-4 expression in tumor cells and CD8 and PD-1 expression in TILs in 464 cases of primary operable gastric adenocarcinoma using IHC analysis. PD-L1 and PD-1 expression was significantly correlated with several adverse prognostic pathologic factors, including higher T-stage, diffuse type of Lauren histologic type, and lymphatic invasion.
PD-L1 and PD-1 expression was also significantly correlated with high CD8+ TILs. PD-1 and PD-L1 expression showed a statistically significant correlation with each other.
Previously published results explored different tumor types with controversial or even directly conflicting results regarding the prognostic role of PD-1/PD-L1 expression. Although mainly poor treatment or survival outcomes associated with high PD-1/PD-L1 expression have been reported, a favorable prognostic value of this expression profile was reported in association with HPV-positive head-and-neck cancer patients and for some hematologic tumors [14, 15].
In a previous study of gastric cancer, high expression of PD-L1 in tumor cells was found to be significantly correlated with a worse prognosis [11]. Herein, our complete case analysis revealed that high PD-L1 and PD-1 expression had an adverse effect on five-year OS in univariate analyses. However, multivariate analyses failed to find statistically significant survival differences based on expression. We expected to find differences between patient subgroups; thus, we performed subgroup analyses by dividing patients into low and high CD8+ TIL groups and evaluating the prognostic differences in PD-1/PD-L1 expression between these groups. In our analyses, PD-L1 was a significant prognostic factor in the high CD8+ TIL group only.
According to a phase-2 colon-cancer clinical trial, tumors with mismatch-repair deficiency had better treatment outcomes than tumors without mismatch-repair deficiency after administration of pembrolizumab, an anti-PD-1 immune checkpoint inhibitor [16]. The authors suggest these results are due to a mutation-associated neoantigen, resulting in dense lymphocytic infiltration and a Th1-associated cytokine-rich environment of a mismatch-repair deficient tumor. In lung cancer cases, based on a multicenter phase-I clinical trial, the response of anti-PD-1 antibodies was correlated with higher PD-L1 tumor expression in advanced non-small-cell lung cancer patients [17]. However there is still no consensus about how to measure PD-L1 expression level and lack of PD-L1 expression does not exclude a potential response to anti-PD-1 antibodies. Many clinical trials have been conducted with gastric cancer patients. For example, a phase-lb trial for pembrolizumab, a monoclonal antibody of PD-1, is ongoing and there are not yet results indicating which patient subgroups may best benefit from checkpoint blockade immunotherapy [18]. The result of this study may help us better determine which patients are more likely to respond to immune checkpoint inhibitors in gastric cancer. Further research and clinical trials are needed to further evaluate the clinical usefulness of our findings.
The effect on CD8+ T-cell function through the PD-1/PD-L1 pathway remains to be clarified and our study indicated that there are no significant correlations between CD8+ TILs and five-year survival rates. The prognostic significance of CD8+ TIL for cancer is controversial. High CD8+ TIL levels are thought to be a good predictor of patient survival for a diverse set of human cancers, including gastric and ovarian cancer [19, 20]. However, adverse prognostic effects were also reported for ovarian cancer patients [9].
The value of anti-CTLA-4 monotherapy has been evaluated for many human cancers with varying results; it is likely to be particularly effective for intrinsically immunogenic tumors with a lower tumor burden [21]. In addition to T-cells, CTLA-4 expression is known to be present in a variety of cell types, including tumor cells, but the functional pathway is still unknown [5, 22, 23]. In breast cancer cases, CTLA-4 expression was associated with axillary lymph-node metastases and higher tumor stages [23]. Conversely in this study, CTLA-4 expression was correlated with lower T-stage, well-differentiated histologic grade, and intestinal Lauren histologic type. Ultimately, the prognostic role of CTLA-4 was not found to be statistically significant.
Our study has several potential limitations. We performed digital image analyses for our assessment of PD-1 and CD8 IHC outcomes to eliminate inter-observer variation, which could be problematic for obtaining accurate positive cell counts and intensity levels. However for CTLA-4 and PD-L1, we performed visual pathologic evaluations instead of digital-image analyses because of the inaccuracies in recognizing positive cells in digital image analyses due to diffuse staining patterns. Also, the proportions of tumor and stroma were different between all core and stromal cells were not completely excluded from counting during digital analysis.
In conclusion, we found statistically significant correlations between PD-1, PD-L1, and CD8+ TILs in gastric adenocarcinoma patients and revealed the prognostic value of PD-L1 expression in patients with high CD8+ TIL levels. More research using large randomized samples or independently validated cohorts are required for practical application.
MATERIALS AND METHODS
Patients and clinicopathologic data
In total, 464 formalin-fixed paraffin-embedded (FFPE) gastric adenocarcinoma tissue samples from patients who underwent surgical treatment at Korea University Guro Hospital from 2002 to 2005 were evaluated. Clinical data, including age, sex, disease specific survival, metastasis, and recurrence, were obtained through chart review. Pathologic data, including TNM stage, histological grade, Lauren classification, and presence of perivascular or perineural invasion were evaluated by slide review. Tumor staging was assessed according to the seventh edition of the American Joint Committee on Cancer (AJCC) [24]. This study was approved by the Institutional Review Board of Korea University Guro Hospital (KUGH12225).
Tissue microarray block construction and immunohistochemical staining
Tissue microarray (TMA) blocks were constructed using tissue cores with 0. 2-mm diameters punched from the representative tumor area of the donor block. The TMA blocks were paired with normal-tissue controls. Serial 4-μm-thick sections were cut from the TMA block and mounted on electrostatic slides for IHC staining. IHC staining was performed using a standard streptavidin-biotin-peroxidase complex method. After deparaffinization with xylene, the tissues were rehydrated through a graded alcohol series and treated with 3% hydrogen peroxide for 20 minutes for endogenous peroxidase blocking. Next, antigen retrieval was done using 10mM citrate buffer (pH 6. 0) for 20 minutes. A BOND-MAX autostainer (Leica, Wetzlar, Germany) was used for IHC studies.
Analysis of immunohistochemical staining
IHC staining revealed that PD-1 and PD-L1 had a membranous expression pattern, while CTLA-4 had a cytoplasmic expression pattern. CD8 had both a cytoplasmic and membranous expression pattern. For assessment of CTLA-4 and PD-L1 expression in tumor cells, IHC results were assessed and graded on a four-tier scale based on the intensity of positive cells (0, negative; 1, weak; 2, moderate; and 3, strong) by two experienced pathologists (KBH and CHY) who were blinded to all patient clinical data. Grades 0 and 1 were defined as low expression and grades 2 and 3 were defined as high expression. For evaluation of CD8 and PD-1 expression in T-lymphocytes, digital image analyses were done. For digital image analyses, whole-slide scans were done using a slide scanner (ScanScope CS, Aperio, CA, USA) and an image analysis program (Aperio ScanScopeTM, CA, USA). Using the image analysis program, the IHC intensity score was classified on a 4-tier system (0, negative; 1, weak; 2, moderate; and 3, strong). A score of 2 and 3 was considered positive. A median positive cell count of all tissue cores was used as a cutoff point and we stratified patients into two groups for each antibody. The antibodies used for IHC were: anti-PD-L1 antibody (1:100, rabbit polyclonal; Abcam, Cambridge, MA, USA), anti-PD-1 antibody (1:100, clone NAT105, mouse monoclonal; Abcam), anti-CD8 antibody (1:200, clone 4B11, mouse monoclonal; Leica Microsystems, Wetzlar, Germany), and anti-CTLA-4 antibody (1:50, clone F-8, mouse monoclonal; Santa Cruz Biotechnology, Dallas, TX, USA).
Statistical analyses
Relationships between clinicopathologic factors and IHC results were sought using the chi-squared test or Fisher’s exact test for categorical variables, and the Mann-Whitney test or Student’s t-test for continuous variables. Five-year overall survival (OS) was used as the clinical outcome. The Kaplan-Meier method and the log-rank test were used to compare survival curves. For factors identified as statistically significant in univariate analyses, multivariate survival analyses were conducted to determine outcomes based on predictors. Multivariate analyses were performed with the Cox proportional hazards regression model for adjusting the hazard ratio of the IHC profile with established clinicopathologic factors. In all statistical analyses, significance was defined as p < 0. 05 (two-sided). All statistical analyses were performed using SPSS version 20 (IBM, Chicago, IL, USA).
ACKNOWLEDGMENTS
The biospecimens for this study were provided by the Korea University Guro Hospital, a member of the National Biobank of Korea.
CONFLICTS OF INTEREST
We declare that we have no conflicts of interest in the authorship or publication of this contribution.
GRANT SUPPORT
This study was supported by a faculty research grant from Korea University College of Medicine (K1325461).
REFERENCES
1. Torre LA, Bray F, Siegel RL, Ferlay J, Lortet-Tieulent J, Jemal A. Global cancer statistics, 2012. CA Cancer J Clin. 2015; 65:87–108.
2. Karimi P, Islami F, Anandasabapathy S, Freedman ND, Kamangar F. Gastric cancer: descriptive epidemiology, risk factors, screening, and prevention. Cancer Epidemiol Biomarkers Prev. 2014; 23:700–713.
3. Pardoll DM. The blockade of immune checkpoints in cancer immunotherapy. Nature reviews. Cancer. 2012; 12:252–264.
4. Chikuma S, Imboden JB, Bluestone JA. Negative regulation of T cell receptor-lipid raft interaction by cytotoxic T lymphocyte-associated antigen 4. J Exp Med. 2003; 197:129–135.
5. Contardi E, Palmisano GL, Tazzari PL, Martelli AM, Fala F, Fabbi M, Kato T, Lucarelli E, Donati D, Polito L, Bolognesi A, Ricci F, Salvi S, et al. CTLA-4 is constitutively expressed on tumor cells and can trigger apoptosis upon ligand interaction. Int J Cancer. 2005; 117:538–550.
6. Kim JW, Eder JP. Prospects for targeting PD-1 and PD-L1 in various tumor types. Oncology (Williston Park, NY). 2014; 28:15–28.
7. Brahmer JR, Drake CG, Wollner I, Powderly JD, Picus J, Sharfman WH, Stankevich E, Pons A, Salay TM, McMiller TL, Gilson MM, Wang C, Selby M, et al. Phase I study of single-agent anti-programmed death-1 (MDX-1106) in refractory solid tumors: safety, clinical activity, pharmacodynamics, and immunologic correlates. J Clin Oncol. 2010; 28:3167–3175.
8. McDermott DF, Atkins MB. PD-1 as a potential target in cancer therapy. Cancer Med. 2013; 2:662–673.
9. Hamanishi J, Mandai M, Iwasaki M, Okazaki T, Tanaka Y, Yamaguchi K, Higuchi T, Yagi H, Takakura K, Minato N, Honjo T, Fujii S. Programmed cell death 1 ligand 1 and tumor-infiltrating CD8+ T lymphocytes are prognostic factors of human ovarian cancer. Proc Natl Acad Sci USA. 2007; 104:3360–3365.
10. Thompson RH, Kuntz SM, Leibovich BC, Dong H, Lohse CM, Webster WS, Sengupta S, Frank I, Parker AS, Zincke H, Blute ML, Sebo TJ, Cheville JC, et al. Tumor B7-H1 is associated with poor prognosis in renal cell carcinoma patients with long-term follow-up. Cancer Res. 2006; 66:3381–3385.
11. Wu C, Zhu Y, Jiang J, Zhao J, Zhang XG, Xu N. Immunohistochemical localization of programmed death-1 ligand-1 (PD-L1) in gastric carcinoma and its clinical significance. Acta Histochem. 2006; 108:19–24.
12. Dolan DE, Gupta S. PD-1 pathway inhibitors: changing the landscape of cancer immunotherapy. Cancer Control. 2014; 21:231–237.
13. Comprehensive molecular characterization of gastric adenocarcinoma. Nature. 2014; 513:202–209.
14. Badoual C, Hans S, Merillon N, Van Ryswick C, Ravel P, Benhamouda N, Levionnois E, Nizard M, Si-Mohamed A, Besnier N, Gey A, Rotem-Yehudar R, Pere H, et al. PD-1-expressing tumor-infiltrating T cells are a favorable prognostic biomarker in HPV-associated head and neck cancer. Cancer Res. 2013; 73:128–138.
15. Carreras J, Lopez-Guillermo A, Roncador G, Villamor N, Colomo L, Martinez A, Hamoudi R, Howat WJ, Montserrat E, Campo E. High numbers of tumor-infiltrating programmed cell death 1-positive regulatory lymphocytes are associated with improved overall survival in follicular lymphoma. J Clin Oncol. 2009; 27:1470–1476.
16. Le DT, Uram JN, Wang H, Bartlett BR, Kemberling H, Eyring AD, Skora AD, Luber BS, Azad NS, Laheru D, Biedrzycki B, Donehower RC, Zaheer A, et al. PD-1 Blockade in Tumors with Mismatch-Repair Deficiency. N Engl J Med. 2015; 372:2509–2520.
17. Garon EB, Rizvi NA, Hui R, Leighl N, Balmanoukian AS, Eder JP, Patnaik A, Aggarwal C, Gubens M, Horn L, Carcereny E, Ahn MJ, Felip E, et al. Pembrolizumab for the treatment of non-small-cell lung cancer. N Engl J Med. 2015; 372:2018–2028.
18. Muro K, Bang Y, Shankaran V, Geva R, Catenacci DVT, Gupta S, Eder JP, Berger R, Gonzalez EJ, Pulini J, Ray AB, Dolled-Filhart M, Emancipator K, et al. LBA15A PHASE 1B STUDY OF PEMBROLIZUMAB (PEMBRO; MK-3475) IN PATIENTS (PTS) WITH ADVANCED GASTRIC CANCER. Ann Oncol. 2014; 25.
19. Lee HE, Chae SW, Lee YJ, Kim MA, Lee HS, Lee BL, Kim WH. Prognostic implications of type and density of tumour-infiltrating lymphocytes in gastric cancer. Br J Cancer. 2008; 99:1704–1711.
20. Sato E, Olson SH, Ahn J, Bundy B, Nishikawa H, Qian F, Jungbluth AA, Frosina D, Gnjatic S, Ambrosone C, Kepner J, Odunsi T, Ritter G, et al. Intraepithelial CD8+ tumor-infiltrating lymphocytes and a high CD8+/regulatory T cell ratio are associated with favorable prognosis in ovarian cancer. Proc Natl Acad Sci USA. 2005; 102:18538–18543.
21. Grosso JF, Jure-Kunkel MN. CTLA-4 blockade in tumor models: an overview of preclinical and translational research. Cancer Immun. 2013; 13:5.
22. Salvi S, Fontana V, Boccardo S, Merlo DF, Margallo E, Laurent S, Morabito A, Rijavec E, Dal Bello MG, Mora M, Ratto GB, Grossi F, Truini M, et al. Evaluation of CTLA-4 expression and relevance as a novel prognostic factor in patients with non-small cell lung cancer. Cancer Immunol Immunother. 2012; 61:1463–1472.
23. Mao H, Zhang L, Yang Y, Zuo W, Bi Y, Gao W, Deng B, Sun J, Shao Q, Qu X. New insights of CTLA-4 into its biological function in breast cancer. Curr Cancer Drug Targets. 2010; 10:728–736.
24. Edge SB, Compton CC. The American Joint Committee on Cancer: the 7th edition of the AJCC cancer staging manual and the future of TNM. Ann Surg Oncol. 2010; 17:1471–1474.