
INTRODUCTION
Brain tumors represent an important cause of cancer-related morbidity and mortality in the United States, with malignant gliomas being among the most aggressive and difficult to treat [1]. Although they rarely metastasize, malignant gliomas are locally invasive tumors. The median survival for patients with glioblastoma (GBM), the most common histological subtype of glioma in adults, is ~15 months and has remained this dismal for decades [1]. Adjuvants to surgical resection, including chemotherapy and radiation therapy, currently provide little improvement in the disease course and outcome for GBM patients, and few patients are ever cured [2]. Patients with recurrent GBM have an even bleaker prognosis [3]. Thus, treatment of GBM patients is a significant clinical problem requiring molecular insights into tumor progression and novel therapeutic approaches.
STAT proteins are the downstream effectors of the interferon (IFN) family of cytokines that recognize promoter elements in IFN-stimulated genes (ISGs) to directly activate their transcription [4-6]. IFNs are endogenous antiviral proteins, which also have anticancer activity in vitro and have clinical efficacy in the treatment of human cancer, which involves the inhibition of cell proliferation [7] and regulation of cellular responses to inducers of apoptosis [8]. The IFN/STAT1-regulated gene signature predicts poor survival outcomes in certain molecular subtypes of glioblastoma patients [9]. Defects in the IFN system can lead to increased susceptibility to cancer through mechanisms that are incompletely understood [10]. ISGs are inducible by radiation and chemotherapy and regulate therapeutic resistance in preclinical cancer models [11-14]. Interestingly, STAT1 has been reported to have both tumor suppressive [15, 16] and protumorigenic activity [17, 18].
MicroRNAs (miRNAs) are abundant, endogenous, small (20 to 24 nucleotide) single-stranded RNAs that suppress the expression of genes implicated in such fundamental biological processes as differentiation, proliferation and apoptosis [19, 20]. Although individual miRNAs do not encode protein, they control cellular protein expression by the perfect or imperfect binding of their seed sequences to the 3’ untranslated region (UTR) of target mRNAs, promoting their cleavage or inhibiting mRNA translation, respectively [19, 21]. Through loss and gain of function studies, miRNAs have been shown to play key roles in cancer initiation, progression and metastasis [20, 22]. Patterns of miRNA expression are often predictive of tumor classification and prognosis, and miRNAs apparently are involved in regulating the sensitivity of tumor cells to radiation and chemotherapeutic drugs [23].
In general, miRNAs that promote tumorigenesis are overexpressed in cancer, while miRNAs that inhibit the tumorigenic process are underexpressed. For example, miR21 is frequently overexpressed in various human tumors and silences the expression of tumor suppressors; miR21 plays an important role in the oncogenic process and is associated with high proliferation, low apoptosis, high invasion and metastatic potential [24-33]. While oncogenic miRNAs have been studied in depth, tumor suppressor miRNAs which tend to be underexpressed in cancer have been relatively poorly characterized. We recently identified miR203 to have tumor suppressive activity in ovarian cancer by targeting Slug/snail2 and inhibiting epithelial to mesenchymal transition [34]. In the present study we found that miR203 was expressed at especially low levels in GBM. Gene profiling of GBM cell lines with enforced miR203 expression identified STAT1 as a potential miR203 target gene, which was validated by reporter constructs driven by the miR203 binding sequence in 3’UTR of STAT1 mRNA. In addition, enforced miR203 expression in glioma cells silenced STAT1 expression, and decreased the expression of STAT1 regulated genes. Overexpression of miR203 or STAT1 knockdown inhibited the growth of GBM tumors in immunocompromised mice. Furthermore, miR203 expression is inversely related to STAT1 levels in patient samples from glioma, and high STAT1 expression closely correlates with poor patient survival and prognosis. Our findings demonstrate that miR203 has tumor suppressive activity by silencing pro-tumorigenic STAT1. MiR203 is underexpressed, while STAT1 is overexpressed in glioblastoma patients, thereby promoting tumorigenesis.
RESULTS
MiR203 expression in GBM patient samples
To examine the potential role of miR203 in brain cancer, we examined miR203 expression in patient specimens from low grade glioma (LGG) and the most malignant form of glioma, GBM, in The Human Cancer Genome (TCGA) database. As shown in Figure 1A, miR203 expression was present at consistently low levels in GBM when compared to its expression in LGG. However, it is important to note that in LGG, a subset of patients with relatively low miR203 expression could be discerned. When the LGG patient samples with accompanying survival data in the TCGA database were grouped according to miR203 expression (Figure 1B), high miR203 LGG patients had significantly longer survival (~4-fold) as compared to patients with low miR203 expression (mean of 1370 and 349 days, respectively). To further characterize miR203 expression in brain cancer RNA was isolated from FFPE specimens from five LGG, GBM and histologically normal brain samples and miR203 expression was determined by qPCR. As shown in Figure 1C, there was a statistically significant differences in miR203 expression, with lowest expression in GBM and highest expression in normal brain tissue.
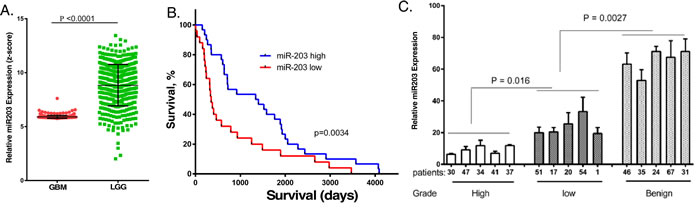
Figure 1: MiR203 expression in cancer patient samples, and the relationship to patient survival. A. miR203 expression in the TCGA database for glioblastoma (GBM) and low grade glioma (LGG). B. miR203 expression in the TCGA database of 60 LGG patient samples with accompanying patient survival information was related to patient survival. C. RNA was extracted from five individual de-identified formalin fixed paraffin embedded patient biopsies identified as GBM, LGG or normal brain tissue, and miR203 expression was determined by qPCR (n = 3), and normalized to U6A expression [36].
The effects of enforced miR203 expression on glioma cell proliferation, migration and sensitivity to induction of apoptosis
Since miR203 was underexpressed in GBM, we examined the biological consequences of enforced miR203 expression in MT330 and SJG2 human GBM cell lines with low basal miR203 expression. Cells were transduced with miR203-encoding lentivirus, and stable pools were isolated after puromycin selection. Since miR203 was reported to be IFN-inducible [35], we also treated GBM cells with IFN, isolated RNA and determined miR203 expression by quantitative real-time PCR (qPCR). Both MT330 and SJG2 transduced GBM cells have significantly higher miR203 expression than empty vector (EV)-transduced cells, and IFN induced an increase in miR203 expression in both EV and miR203 expressing cells (Figure 2A). Moreover, while IFN-induced miR21 expression in both GBM cell lines (Figure 2B) as we have previously shown [36-40], enforced miR203 expression had no effect on miR21 expression (Figure 2C). The effect of enforced miR203 expression on the proliferation of EV and miR203-transduced GBM cells was monitored daily by cell counting, and found to inhibit cell proliferation (Figure 3A). By cell migration assays, we found that enforced miR203 expression also inhibited cell migration (Figure 3B). Since cell adhesion is a complex process involved in cell migration/invasion, we also performed fibronectin adhesion assays and found that enforced miR203 expression as well as IFN treatment markedly reduced cell adhesion, and together they had an even greater effect on cell adhesion (Figure 3C). Since we previously found that apoptosis in cancer cell lines is counterbalanced by a miRNA-regulated cell survival pathway [36], apoptosis in GBM cells with enforced miR203 expression was determined by a cell-death ELISA. Cells were treated with IFN or temozolomide (TMZ), the frontline chemotherapy for GBM that induces apoptosis through DNA strand breaks [41]. While basal apoptosis was slightly increased by enforced miR203 expression, apoptosis induced by IFN and TMZ was markedly increased in both MT330 and SJG2 cells with enforced miR203 expression (Figure 3D). These results taken together are consistent with the hypothesis that miR203 inhibits GBM cell proliferation and cell migration and adhesion, and enhances sensitivity of GBM cells to inducers of apoptosis.
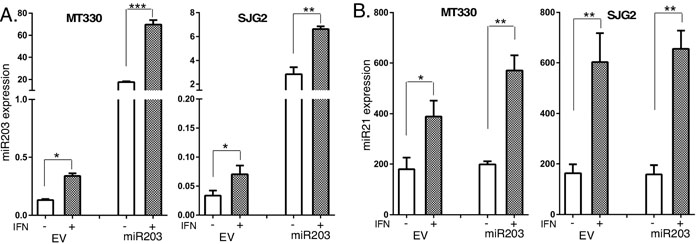
Figure 2: IFN induces miR203 expression. A., B. Total RNA was prepared from empty vector (EV) and miR203 enforced GBM cell lines, which were not treated (con) or treated with IFN (1,000 IU/ml for 6 hr), and the expression of miR203 (A) and miR21(B) determined by qPCR.
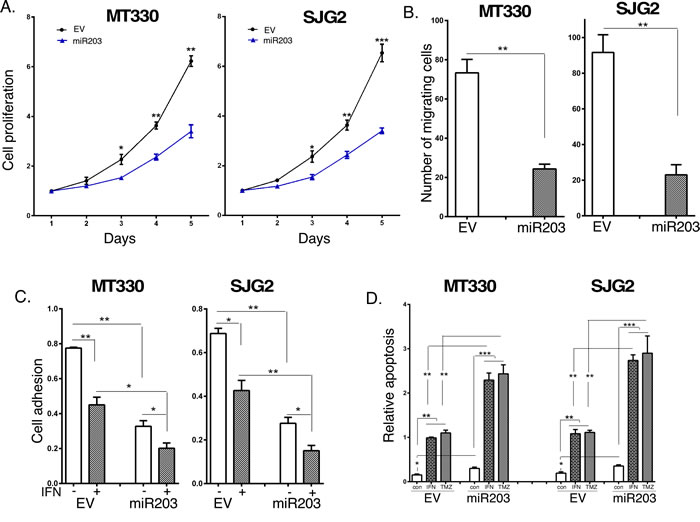
Figure 3: The effects of Enforced miR203 expression on glioma cell proliferation, migration and sensitivity to induction of apoptosis. Cell proliferation A. migration B. and fibronectin cell adhesion C. of EV and miR203-enforced GBM cells. The effect on cell adhesion was also measured in the presence or absence of IFN treatment (1,000 IU/ml for 24 hr). D. EV and miR203-enforced GBM cells were treated for 24 hr with IFN (1,000 IU/ml) or TMZ (100 µM) and analyzed for apoptosis by cell death detection ELISA assays.
Identification of STAT1 as a miR203 target gene
MiRNAs control cellular protein expression by binding to target mRNAs and silencing their expression. To identify potential miR203 targets, we isolated RNA from MT330 and SJG2 cells with enforced miR203 expression, performed microarray analysis, and found that, although the expression of several hundred genes were down-regulated by enforced miR203 expression, the expression of STAT1, IVNS1ABP and PI3KCA were consistently downregulated in both GBM cell lines. Most interesting is that, while IVNS1ABP and PI3KCA were identified by bioinformatics algorithms such as TargetScan as having miR203 binding sites in their 3’UTR, STAT1 was not identified by this analysis. To determine whether these genes were silenced by enforced miR203 expression, whole cell lysates were prepared from EV and miR203 transduced GBM cells, and protein expression determined by immunoblotting. As shown in Figure 4A, while the levels of STAT1, PI3KCA and IVNS1ABP were reduced in GBM cells with enforced miR203 expression, expression of the miR21 target gene IGFBP3 was unaffected by miR203 expression. We focused our analysis on STAT1 as a miR203 target gene because the role of STAT1 in IFN signaling, and STAT1 has been reported to have both tumor suppressive [15, 16], and protumorigenic activity [17, 18]. To determine whether expression of STAT proteins was globally suppressed by miR203 expression, whole cell lysates were also immunoblotted for different STATs. While STAT1 expression is markedly lower in cells with enforced miR203 expression, both STAT2 and STAT3 are unaffected by miR203 expression (Figure 4A). Moreover, while STAT1 was a miR203 target gene in GBM cells, as shown in Figure 4B Snai2/Slug was not consistently silenced by miR203 expression in GBM cells, although it was targeted by miR203 in ovarian cancer cells [34]. This finding is also consistent with our previous findings that miRNAs silence gene expression in a cell-type specific manner.
Using the miR203 core seed sequence (GUAAAGU) we identified two potential miR203 binding sites of CAUUUCA in the 3’ UTR of STAT1 (Figure 4C). To determine whether STAT1 was a direct miR203 target, the 3’UTR of STAT1 mRNA containing the two predicted miR203 target sequences as well as a corresponding mutated sequence were linked to luciferase, and a dual-luciferase (pcDNA3.1-Luc) reporter system was employed to evaluate miRNA:mRNA interactions. Overexpression of miR203 in HEK293T cells downregulated luciferase activity of the STAT1-driven wild-type reporter constructs, while luciferase constructs with two mutated miR203 binding sequences in STAT1 were unaffected by miR203 overexpression (Figure 4C). These results show that STAT1 is a bona fide miR203 target gene.
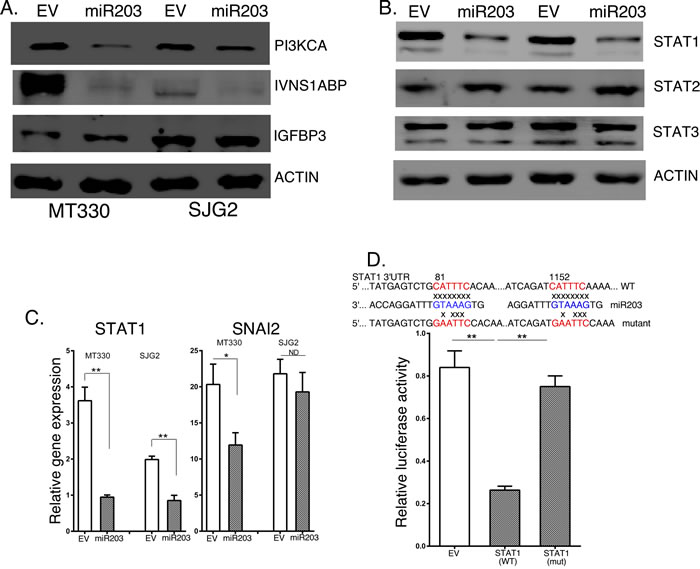
Figure 4: The effects of enforced miR203 expression on target genes. A. Lysates were prepared from EV and miR203 enforced GBM cells and immunoblotted as indicated. B. RNA was extracted from EV and miR203 enforced GBM cells, and gene expression determined by qPCR, and normalized to actin expression (n = 3). C. Upper Panel: Sequence alignment of the miR203 binding sequence with the 3’ UTR of STAT1 gene (wild-type) and a mutant STAT1 construct used for experiments. Lower Panel: 293T cells were transiently cotransfected with empty-vector (pcDNA3.1-Luc), or wild-type (pcDNA3.1-Luc-wtUTR) or mutant (pcDNA3.1-Luc-muUTR) STAT1 reporter plasmids, and with miR203 plasmid. pSV40-Renilla plasmid was cotransfected as an internal control. The ratio of luciferase and Renilla activities was determined at 24 h post-transfection using the dual luciferase reporter gene kit (Promega).
The effects of STAT1 knockdown on glioma cell proliferation, migration and sensitivity to induction of apoptosis
To characterize the functional role of STAT1 we knocked down (KD) STAT1 expression in GBM cell lines. In brief, MT330 and SJG2 cells were transduced with several STAT1 short hairpin RNA (shRNA)-miR lentiviral vector pGIPZ, which contain miR30 hairpin-based sh-miR structure against different regions of STAT1 (C3 and C4). Transduced cells were selected with puromycin, and after selection maintained without puromycin. Cell lysates were prepared, and immunoblotted with Abs against STATs and various STAT1-regulated proteins. As shown in Figure 5A, while the scrambled shRNA control had no effect on the levels of any of the proteins examined, both C3 and C4 STAT1-shRNAs inhibited the expression of STAT1 and known STAT1 regulated genes, including Epidermal Growth Factor Receptor (EGFR), c-Myc, N-Myc inhibitor (NMI), and programmed death ligand 1 (PD-L1). The selectivity of the STAT1KD was further supported by the findings that STAT2 and STAT3 expression was unaffected by STAT1KD. Similar results on gene expression were obtained by qPCR on RNA extracts of these cells. We then examined the effect of STAT1KD on the proliferation of MT330 and SJG2 glioma cells, and found that similar to the results with enforced miR203 expression STAT1KD resulted in a decrease in cell proliferation (Figure 5B) and cell migration (Figure 5C). We next compared basal apoptosis and apoptosis induced by IFN and TMZ in STAT1KD GBM cells. As shown in Figure 5D, while basal apoptosis was only slightly affected by STAT1KD, apoptosis induced by IFN and TMZ was markedly increased in both MT330 and SJG2 cells with STAT1KD. Taken together these results are consistent with the hypothesis that STAT1KD inhibits GBM cell proliferation, inhibits GBM cell migration and adhesion, and enhances sensitivity of GBM cells to inducers of apoptosis, and thus mirrors the effect of miR203 expression consistent with STAT1 being a miR203 target gene.
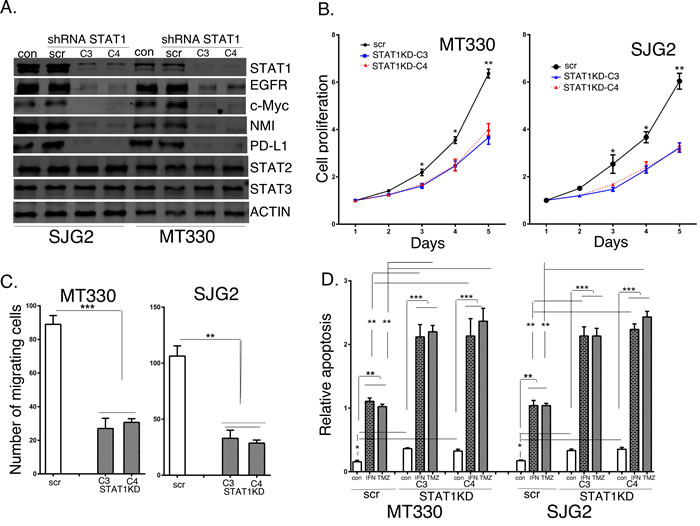
Figure 5: The effects of STAT1KD on STAT1 target gene expression and glioma cell proliferation, migration and sensitivity to induction of apoptosis. A. Lysates were prepared from GBM cells transduced with scrambled or shRNAs directed against two different regions of STAT1, and immunoblotted as indicated. Cell proliferation B., migration C., and apoptosis D. of scrambled shRNA transduced (scr) and STAT1KD GBM cells. In apoptosis experiments GBM cells were treated for 24 hr with IFN (1,000 IU/ml), and analyzed for apoptosis by cell death detection ELISA assays.
Enforced miR203 expression and STAT1 knockdown inhibits glioma tumor growth in vivo
We then sought to determine the roles of miR203 and STAT1 in the tumorigenicity of GBM cells in vivo. NSG mice were injected subcutaneously with MT330 and SJG2 GBM cells with enforced miR203 expression or STAT1KD, and tumor volume was determined by caliper measurement. Enforced miR203 expression or STAT1KD markedly suppressed tumor formation by both GBM cell lines (Figure 6A). Moreover, when tumors were weighed at six to seven weeks after injection, there was marked reduction in tumor weight in mice injected with GBM cells with miR203 enforced expression or STAT1KD. To validate that the inhibition of tumor formation reflected enforced miR203 expression, RNA and protein was extracted from three individual tumors of mice injected with EV and miR203 expressing SJG2 cells. Expression of the miR203 target genes, STAT1, PI3KCA and IVNS1ABP, was markedly inhibited in tumor extracts from mice injected with enforced miR203 expressing cells as determined by qPCR (Figure 6B), and immunoblotting (Figure 6C). Tumor tissue from mice injected with GBM cells with enforced miR203 expression had lower protein levels of miR203 targets (STAT1, PI3KCA and IVNS1ABP), but the levels of STAT3 and actin were unaffected. Furthermore, the effect of enforced miR203 expression or STAT1KD was also determined in the orthotopic (brain) microenvironment for GBM by intracranial injections of luciferase-expressing cells, and tumorigenesis followed by live animal imaging after D-luciferin injection. Although EV transduced MT330 exhibited significant bioluminescent signal throughout the brain of injected mice demonstrating tumor invasion, enforced miR203 expression or STAT1KD resulted in a marked reduction in bioluminescent signal which is localized around the injection site after intracranial injection of luciferase labeled cells (Figure 6D).
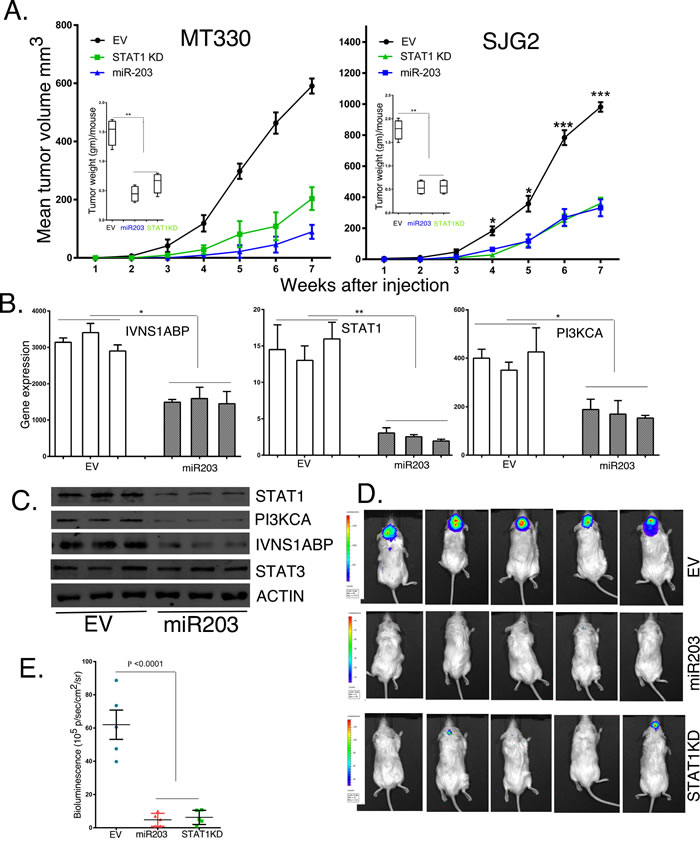
Figure 6: The effects of enforced miR203 expression and STAT1KD on tumor formation by GBM cell lines. A. NSG mice were injected subcutaneously with 106 EV, miR203 enforced or STAT1KD-C4 GBM cells, and tumor growth was determined by caliper measurements. Inset: weight of tumors at necropsy. Tumors were extracted from mice injected with EV or miR203 enforced SJG2 cells and assessed for RNA B. and protein C. levels of IVNS1ABP, STAT1 and PI3KA by qPCR and immunoblotting, respectively. D. Five NSG mice were injected intracranially with 106 EV, miR203 enforced or STAT1KD-C4 GBM cells, and tumor growth was determined by live animal imaging at 6 weeks. E. Quantification of the bioluminescent signal of injected mice.
STAT1 expression correlates with poor overall patient survival in GBM
We next examined the relationship between STAT1 expression to patient survival. In GBM samples in the TCGA database we found a statistically significant inverse relationship between STAT1 expression and patient survival using the Pearson correlation (Figure 7A), showing that high STAT1 expression is associated with poor patient survival (p < 0.001). Furthermore, if GBM patients are grouped into the top 10% and lowest 10% survival, the patients with the lowest overall survival have significantly higher STAT1 expression (p < 0.001) (Figure 7B). We next examined individual patient survival in the Repository of Molecular Brain Neoplasia Data (REMBRANT) for glioma patients. As shown in Figure 7C, patients bearing STAT1-high glioma had significantly shorter survival than those bearing STAT1-low glioma (p = 0.0009). Moreover, patients bearing STAT1-intermediate glioma have longer disease-specific survival when compared with STAT1-high glioma (p = 0.0023), and shorter disease-specific survival when compared with STAT-low glioma (p = 0.0279) (Figure 7C). To further characterize STAT1 expression in brain cancer, RNA was isolated from FFPE biopsy specimens from five LGG, GBM and histologically benign brain samples and STAT1 expression was determined by qPCR. As shown in Figure 7D, there were statistically significant differences in STAT1 expression with highest expression in GBM and lowest expression in benign brain tissue. Moreover, in the same patient specimens the expression of STAT1 (Figure 7D) and miR203 (Figure 1C) are inversely related.
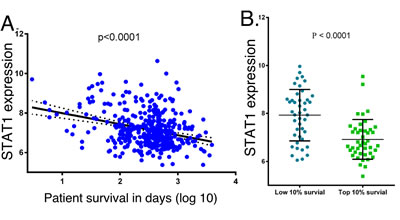
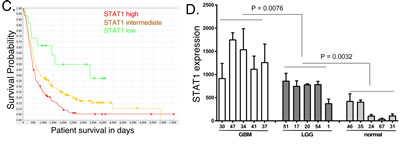
Figure 7: STAT1 expression in cancer patient samples, and the relationship to patient survival. A. STAT1 expression in the TCGA database for GBM patients was plotted against patient survival. B. GBM patients in the TCGA database with the lowest and highest survival were compared for STAT1 expression. C. Kaplan-Meier analysis of the survival of glioma patients in the REMBRANT database grouped according to relative STAT1 expression. D. RNA was extracted from five de-identified FFPE patient biopsies identified as GBM, LGG or normal brain tissue, and STAT1 expression was determined by qPCR (n = 3), and normalized to actin expression [36].
DISCUSSION
GBM is the most common primary brain malignancy and carries the worst prognosis. Despite improved molecular characterization of the disease, aggressive surgery, radiation, and chemotherapy are standard of care in GBM, and the median survival of GBM patients still remains only 12- to 15-months. Thus, identification of new molecular targets in GBM may lead to improved therapeutic approaches. In the present study, we found that miR203 was nearly universally expressed at extremely low levels in GBM patient samples in the TCGA database However, in the more benign form of brain cancer LGG, which overall has a better patient prognosis, there is a significant variation in miR203 expression, and we found that high miR203-expressing patients had significantly 4-fold longer survival than low miR203-expressing patients. These results suggest that miR203 may have value as a prognostic biomarker in brain cancer.
Moreover, we found that in vitro enforced miR203 expression inhibited GBM cell proliferation and migration, and increased sensitivity to apoptosis induced by the cytokine IFN and the chemotherapeutic agent TMZ, both of which have been used to treat GBM in the clinic. In addition, the tumorigenicity in vivo of GBM cells with enforced miR203 expression was markedly impaired when injected subcutaneously or intracranially into immunocompromised mice. Taken together these results indicate that miR203 may have tumor suppressive function in GBM. These findings are consistent with our previous study in ovarian cell lines, which show that miR203 has tumor suppressive function [34]. However, although Snai2/Slug is an important target of miR203 in ovarian cancer, we found that Snai2/Slug expression was not consistently suppressed by enforced miR203 expression in GBM cell lines. To identify new miR203 target genes we performed gene expression analysis on RNA samples of control and miR203-enforced GBM cell lines, and identified that STAT1 as a potential miR203 target gene. By luciferase reporter assays driven by wild-type and mutant 3’UTR of STAT1, we showed that STAT1 expression was directly regulated by miR203 expression. Our finding that STAT1 is a miR203 target gene is particularly interesting because STAT1 has been reported to have both tumor suppressive [15, 16], and protumorigenic activity [17, 18]. We hypothesized that STAT1 would be protumorigenic in glioma, which was consistent with our finding that STAT1 was expressed at high levels in GBM cells lines. Therefore, we knocked down STAT1 in GBM cell lines and found that this mimicked the effects of enforced miR203 expression. STAT1KD GBM cell lines showed inhibited proliferation and migration when compared to cells transduced with empty vector, as well as increased sensitivity to apoptosis induced by IFN and TMZ. Moreover, STAT1KD GBM cell lines showed diminished tumorigenicity when injected into immunocompromised mice. Taken together these results suggest that STAT1 promotes tumorigenicity in GBM. Interestingly, STAT1KD inhibited the expression of several known STAT1 regulated genes, including EGFR, c-Myc, NMI, and PD-L1. All of these genes are known to play important roles in the tumorigenicity of GBM. For example, high NMI expression has been found to predict poor prognosis and promotes tumor growth in human GBM [42]. High PD-L1 expression is correlated with poor outcome in GBM [43]. Dysregulation of the epidermal growth factor receptor (EFGR) is found in ~50% of GBM patient samples analyzed [44, 45]. In gliomas, c-Myc expression has been found to correlate with the grade of malignancy in brain cancer, with low expression in LGG and high expression in GBM [46].
We also examined the relationship between STAT1 expression in publically available databases on patient survival in glioma. We found that low STAT1-expressing glioma patients had the best overall survival when compared to high STAT1-expressing patients, with intermediate patients falling somewhere in between in overall survival. Moreover, when we examined GBM patients specifically, those with the worst overall survival had significantly higher STAT1 levels when compared to GBM patients with lowest STAT1 expression. These results suggest that high STAT1 expression predicts poor prognosis in GBM. Consistent with our findings an expression signature of IFN/STAT1 signaling genes was found to predict poor survival outcome in GBM patients [9].
In addition, there are clearly other forms of cancer besides glioma where the miR203/STAT1 pathway may play an important role. MiR203 expression in TCGA database was present at consistently low levels in GBM when compared to its expression in cancers of the ovary (OV), skin (SK), liver (HC), prostate (PR), cervix (CE) and breast (BR), as well as LGG (Figure S1). However, in nearly all the cancers examined, except prostate, breast and cervical cancer, a subset of patients with relatively low miR203 expression could be discerned. Moreover, in liver cancer both high miR203-expressing and low STAT1-expressing patients had a significantly longer survival than low miR203 expressing patients and high STAT1-expressing patients (Figure S2). Similarly, we previously showed that in ovarian cancer miR203 expression is significantly higher in patients with the best overall survival when compared to patients with the worst overall survival [34]. Thus, there are subsets of cancer patients with low miR203 expression for whom miR203 targeted therapies may have therapeutic benefit. The downregulation of a tumor-suppressive miRNA in cancer such as miR203 may be overcome by introducing synthetic oligonucleotides that are identical to the miRNA, known as miRNA mimics.
In summary, we identified STAT1 as a novel miR203 target gene in GBM, and characterized the role of the opposing actions of miR203 and STAT1 in GBM as well as in biopsy specimens from cancer patients, which suggests that miR203 inhibits GBM tumorigenesis through suppressing the expression of the tumor promoting activity of STAT1.
MATERIALS AND METHODS
Biological reagents and cell cultures
The biological activity of recombinant human interferon (IFNcon1, InterMune) was expressed in terms of international reference units/ml using the human NIH reference standard [47]. Antibodies against the following proteins were used: STAT1, STAT2, PTEN, IVNS1ABP, PI3KCA, EGFR, c-Myc, NMI, PD-L1 and actin (Santa Cruz Biotechnology); STAT3 (BD Transduction Laboratories); PDCD4, (Abcam) and FBXO11 (Novus Biologicals). MT330 (UTHSC Department of Neurosurgery), and SJG2 (St. Jude Children’s Research Hospital) cell lines were grown in DMEM containing 10% Fetal Bovine serum (Atlanta Biologics) supplemented with penicillin (100 IU/ml) and streptomycin (100 mg/ml) at 37 °C with 5% CO2.
Gene expression analysis
Total RNA was isolated using RNeasy Mini kit (Qiagen) from empty vector and miR203 expressing MT330 and SJG2 cells, and submitted to the UTHSC Center of Genomics and Bioinformatics (Memphis, TN) for labeling and hybridization to Human-HT12 BeadChips (Illumina). Microarray data analysis was then carried out using GenomeStudio 3.4.0 and GeneSpring software 7.0 (Silicon Genetics), and expression values for each gene were normalized as described previously [48]. The average fold-change in gene expression from three independent sets of GeneChip data was subjected to non-parametric t testing. For quantitative real time PCR (qPCR) analysis, RNA was isolated using the RNeasy Mini kit (Qiagen), and gene expression was determined as previously described [36], using the following gene-specific primers: Snai2, 5’- CGAACTGGACACACATACAGTG-3’ (forward) and 5’- CTGAGGATCTCTGGTTGTGGT-3’ (reverse); IVNS1ABP, 5’- GATGTTCGACTTCAGGTCTGTG-3’ (forward) and 5’- CGTGAGAAATTCCATGAGGATCA-3’ (reverse); STAT1, 5’- CAGCTTGACTCAAAATTCCTGGA-3’ (forward) and 5’- TGAAGATTACGCTTGCTTTTCCT-3’ (reverse); PIK3ca, 5’- CCACGACCATCATCAGGTGAA-3’ (forward) and 5’- CCTCACGGAGGCATTCTAAAGT-3’ (reverse); ACTB 5’- GGACTTCGAGCAAGAGATGG-3’ (forward) and 5’- AGCACTGTGTTGGCGTACAG-3’ (reverse). For miRNA expression, total RNA (5 μg) was reverse-transcribed into first-strand cDNA and 30 ng of cDNA was used as a template for the PCR reaction with a forward primer specific to the mature miR203 sequence, and the following mature miR203 sequence (5’- GTGAAATGTTTAGGACCACTAG-3’). SYBR Green-based real-time PCR was performed on a BioRad iCycler and gene expression normalized relative to U6 or β-actin expression for miRNA or mRNA, respectively. In addition, 3-5 (10 micron) curls were cut from de-identified formalin-fixed paraffin-embedded (FFPE) patient biopsy specimens (UTHSC Tissue Services Core), RNA isolated using the RecoverAllTM Total Nucleic Acid Isolation Kit (Ambion), and gene expression determined by qPCR.
Lentiviral overexpression of miR203 and STAT1 knockdown
Hsa-miR203 lentivector was purchased from ABM, packaged in HEK293FT cells and produced as previously described [36]. To knockdown STAT1 expression, cells were transduced with the STAT1 short hairpin RNA (shRNA)-miR lentiviral vectors pGIPZ, which contains a miR30 hairpin-based shRNA-miR structures against STAT1 (OPEN Biosystems). Transduced cells were selected with puromycin, and after selection stable pools with expression levels knocked down by >75% or overexpressed by >3-fold were maintained in growth medium without puromycin.
Immunoblot analysis
Total cell lysates (25 μg) were separated by SDS-PAGE, transferred to polyvinylidene difluoride membranes (Millipore) and immunoblotted with the indicated antibodies, followed by IRDye800CW goat anti-mouse IgG or IRDye680 goat anti-rabbit IgG (LI-COR Biosciences). Blots were visualized on an Odyssey Infrared Imaging System (LI-COR Biosciences).
Construction of luciferase reporter gene plasmids and reporter assays
We have identified two miR203 binding sites present in the 3’UTR of STAT1. The 3’ UTR of STAT1 containing these predicted binding sites was amplified by PCR from genomic DNA of human 293T cells. After digestion with XhoI and BamHI, the PCR product was purified and cloned into pcDNA3.1-luc, resulting in the wild-type FBXO11 reporter plasmid, pcDNA3.1-Luc-wtUTR. The mutant STAT1 reporter plasmid pcDNA3.1-Luc-muUTR was constructed by mutating the two miR203 binding sites in the 3’UTR of STAT1 using PCR based site-directed mutagenesis according to manufacturer’s instructions (Stratagene). The primers for amplifying the wild-type 3’-UTR are 5’- GATACTCGAGCATTGCAAGTATCTTCCTAC -3’ and 5’- GCGGATCCTCAGATTGTATGCAGTGCCA -3’, and the primers for mutant construct are 5’- GAATTCGCAAGATCAGTGTAATAAACTTAACCAC -3’ and 5’- CAGACTCATACATTAAACATTGCTTGTCTATTC -3’ (site 81); 5’- AATTCGCAACTCATTTCCTATGTAACTGCATTGA-3’ and 5’- ATCTGATTCTCATATTATCTCTGGTGTATTA-3’ (site 1152). Reporter gene binding assays were performed by co-transfection of 293T cells using wild-type and mutant reporter plasmids pcDNA3.1-Luc-wtUTR and pcDNA3.1-Luc-muUTR with miR203 overexpressing plasmid, respectively. pSV40-Renilla plasmid was co-transfected as an internal control. The ratio of luciferase and Renilla activities was determined at 24h post-transfection using the dual luciferase reporter gene kit (Promega).
Tumor formation in mice
Animal experiments were performed in accordance with a study protocol approved by the Institutional Animal Care and Use Committee of the University of Tennessee Health Science Center. Xenografts were established in five-week-old male NOD.Cg-Prkdcscid Il2rgtm1Wjl/SzJ (NSG) mice (Jackson Laboratory) by injection of MT330 and SJG2 cells (1x10⁶) directly into the flanks [37]. Tumors were measured weekly with a handheld caliper. In addition, luciferase-expressing GBM cells (106) were injected stereotactically into the superficial brain parenchyma of NSG mice through a burr hole in the skull as previously described [49]. NSG mice were injected with D-luciferin and subjected to live animal imaging weekly to quantify bioluminescence [38, 49].
TCGA data query
To examine the relationship between miR203 and STAT1 expression in human cancer specimens, we queried the TCGA data portal for all samples with Level 3 miRNA or mRNA expression data available, as well as the accompanying clinical data. The data set was filtered for samples having expression data for miR203, STAT1 and clinical data, yielding a final set of 420 GBM, and 438 LGG cancer patient samples. Statistical analyses were performed using Graphpad Prism.
Cell proliferative assays
For cell proliferation analysis, cultures were plated at 1 x 10⁵ cells in 25-cm2 flasks, and at daily intervals cells were harvested by trypsinization and enumerated in a Coulter Counter [50].
Transwell migration assays
Cell were subjected to transwell migration assays as previously described [36].
Apoptosis assays
The induction of apoptosis was monitored by DNA fragmentation using the cell death detection ELISAPLUS, according to the manufacturer’s protocol.
Statistical analyses
At least two independent experiments were performed in duplicate, and data are presented as means ± sd. ANOVA and post-hoc least significant difference analysis or Student’s t-tests were performed. p values < 0.05 (*), 0.01 (**) and 0.001 (***) were considered statistically significant.
CONFLICTs OF INTEREST
All authors declare no potential conflicts of interest
GRANT SUPPORT
This work was supported in part by NIH R01CA133322, Department of Defense (W81XWH-11-1-0533) and the Muirhead Chair Endowment at the University of Tennessee Health Science Center (LP).
Editorial note
This paper has been accepted based in part on peer-review conducted by another journal and the authors’ response and revisions as well as expedited peer-review in Oncotarget.
REFERENCES
1. Surawicz TS, Davis F, Freels S, Laws ER, Jr. and Menck HR. Brain tumor survival: results from the National Cancer Data Base. Journal of neuro-oncology. 1998; 40:151-160.
2. Stupp R, Mason WP, van den Bent MJ, Weller M, Fisher B, Taphoorn MJ, Belanger K, Brandes AA, Marosi C, Bogdahn U, Curschmann J, Janzer RC, Ludwin SK, et al. Radiotherapy plus concomitant and adjuvant temozolomide for glioblastoma. N Engl J Med. 2005; 352:987-996.
3. Wong ET, Hess KR, Gleason MJ, Jaeckle KA, Kyritsis AP, Prados MD, Levin VA and Yung WK. Outcomes and prognostic factors in recurrent glioma patients enrolled onto phase II clinical trials. J Clin Oncol. 1999; 17:2572-2578.
4. Larner AC, Jonak G, Cheng Y-SE, Korant B, Knight E and Darnell JEJ. Transcriptional induction of two genes in human cells by b interferon. ProcNatlAcadSciUSA. 1984; 81:6733-6737.
5. Friedman RL, Manly SP, McMahon M, Kerr IM and Stark GR. Transcriptional and post-transcriptional regulation of interferon-induced gene expression in human cells. Cell. 1984; 38:745-755.
6. Darnell JEJ, Kerr IM and Stark GR. Jak-STAT pathways and transcriptional activation in response to IFNs and other extracellular signaling proteins. Science. 1994; 264:1415-1421.
7. Tanabe T, Kominsky SL, Subramaniam PS, Johnson HM and Torres BA. Inhibition of the glioblastoma cell cycle by type I IFNs occurs at both the G1 and S phases and correlates with the upregulation of p21(WAF1/CIP1). Journal of neuro-oncology. 2000; 48:225-232.
8. Yang CH, Murti A, Basu L, Kim JG and Pfeffer LM. IFN/ promotes cell survival by activating NF-B. Proc Natl Acad Sci USA. 2000; 97:13631-13636.
9. Duarte CW, Willey CD, Zhi D, Cui X, Harris JJ, Vaughan LK, Mehta T, McCubrey RO, Khodarev NN, Weichselbaum RR and Gillespie GY. Expression signature of IFN/STAT1 signaling genes predicts poor survival outcome in glioblastoma multiforme in a subtype-specific manner. PLoS One. 2012; 7:e29653.
10. Teng MW, Swann JB, Koebel CM, Schreiber RD and Smyth MJ. Immune-mediated dormancy: an equilibrium with cancer. J Leukoc Biol. 2008; 84:988-993.
11. Khodarev NN, Beckett M, Labay E, Darga T, Roizman B and Weichselbaum RR. STAT1 is overexpressed in tumors selected for radioresistance and confers protection from radiation in transduced sensitive cells. Proc Natl Acad Sci U S A. 2004; 101:1714-1719.
12. Khodarev NN, Minn AJ, Efimova EV, Darga TE, Labay E, Beckett M, Mauceri HJ, Roizman B and Weichselbaum RR. Signal transducer and activator of transcription 1 regulates both cytotoxic and prosurvival functions in tumor cells. Cancer Res. 2007; 67:9214-9220.
13. Tsai MH, Cook JA, Chandramouli GV, DeGraff W, Yan H, Zhao S, Coleman CN, Mitchell JB and Chuang EY. Gene expression profiling of breast, prostate, and glioma cells following single versus fractionated doses of radiation. Cancer Res. 2007; 67:3845-3852.
14. Sistigu A, Yamazaki T, Vacchelli E, Chaba K, Enot DP, Adam J, Vitale I, Goubar A, Baracco EE, Remedios C, Fend L, Hannani D, Aymeric L, et al. Cancer cell-autonomous contribution of type I interferon signaling to the efficacy of chemotherapy. Nat Med. 2014; 20:1301-1309.
15. Meraz MA, White JM, Sheehan KC, Bach EA, Rodig SJ, Dighe AS, Kaplan DH, Riley JK, Greenlund AC, Campbell D, Carver-Moore K, DuBois RN, Clark R, et al. Targeted disruption of the Stat1 gene in mice reveals unexpected physiological specificity in the JAK-STAT signaling pathway. Cell. 1996; 84:431-442.
16. Wang S, Raven JF, Durbin JE and Koromilas AE. Stat1 phosphorylation determines Ras oncogenicity by regulating p27 kip1. PLoS One. 2008; 3:e3476.
17. Kharma B, Baba T, Matsumura N, Kang HS, Hamanishi J, Murakami R, McConechy MM, Leung S, Yamaguchi K, Hosoe Y, Yoshioka Y, Murphy SK, Mandai M, et al. STAT1 drives tumor progression in serous papillary endometrial cancer. Cancer Res. 2014; 74:6519-6530.
18. Timofeeva OA, Plisov S, Evseev AA, Peng S, Jose-Kampfner M, Lovvorn HN, Dome JS and Perantoni AO. Serine-phosphorylated STAT1 is a prosurvival factor in Wilms’ tumor pathogenesis. Oncogene. 2006; 25:7555-7564.
19. Bartel DP. MicroRNAs: genomics, biogenesis, mechanism, and function. Cell. 2004; 116:281-297.
20. Calin GA and Croce CM. MicroRNA signatures in human cancers. Nat Rev Cancer. 2006; 6:857-866.
21. Lim LP, Lau NC, Garrett-Engele P, Grimson A, Schelter JM, Castle J, Bartel DP, Linsley PS and Johnson JM. Microarray analysis shows that some microRNAs downregulate large numbers of target mRNAs. Nature. 2005; 433:769-773.
22. Ventura A and Jacks T. MicroRNAs and cancer: short RNAs go a long way. Cell. 2009; 136:586-591.
23. Garofalo M and Croce CM. Role of microRNAs in maintaining cancer stem cells. Adv Drug Deliv Rev. 2015; 81:53-61.
24. Si ML, Zhu S, Wu H, Lu Z, Wu F and Mo YY. miR-21-mediated tumor growth. Oncogene. 2007; 26:2799-2803.
25. Volinia S, Calin GA, Liu CG, Ambs S, Cimmino A, Petrocca F, Visone R, Iorio M, Roldo C, Ferracin M, Prueitt RL, Yanaihara N, Lanza G, et al. A microRNA expression signature of human solid tumors defines cancer gene targets. Proc Natl Acad Sci USA. 2006; 103:2257-2261.
26. Folini M, Gandellini P, Longoni N, Profumo V, Callari M, Pennati M, Colecchia M, Supino R, Veneroni S, Salvioni R, Valdagni R, Daidone MG and Zaffaroni N. miR-21: an oncomir on strike in prostate cancer. Mol Cancer. 2010; 9:12.
27. Loffler D, Brocke-Heidrich K, Pfeifer G, Stocsits C, Hackermuller J, Kretzschmar AK, Burger R, Gramatzki M, Blumert C, Bauer K, Cvijic H, Ullmann AK, Stadler PF, et al. Interleukin-6 dependent survival of multiple myeloma cells involves the Stat3-mediated induction of microRNA-21 through a highly conserved enhancer. Blood. 2007; 110:1330-1333.
28. Chan JA, Krichevsky AM and Kosik KS. MicroRNA-21 is an antiapoptotic factor in human glioblastoma cells. Cancer Res. 2005; 65:6029-6033.
29. Zhu S, Wu H, Wu F, Nie D, Sheng S and Mo YY. MicroRNA-21 targets tumor suppressor genes in invasion and metastasis. Cell Res. 2008; 18:350-359.
30. Wang P, Zou F, Zhang X, Li H, Dulak A, Tomko RJ, Jr., Lazo JS, Wang Z, Zhang L and Yu J. microRNA-21 negatively regulates Cdc25A and cell cycle progression in colon cancer cells. Cancer Res. 2009; 69:8157-8165.
31. Hatley ME, Patrick DM, Garcia MR, Richardson JA, Bassel-Duby R, van Rooij E and Olson EN. Modulation of K-Ras-dependent lung tumorigenesis by MicroRNA-21. Cancer Cell. 2010; 18:282-293.
32. Krichevsky AM and Gabriely G. miR-21: a small multi-faceted RNA. J Cell Mol Med. 2009; 13:39-53.
33. Medina PP, Nolde M and Slack FJ. OncomiR addiction in an in vivo model of microRNA-21-induced pre-B-cell lymphoma. Nature. 2010; 467:86-90.
34. Zhao G, Guo Y, Chen Z, Wang Y, Yang C, Dudas A, Du Z, Liu W, Zou Y, Szabo E, Lee SC, Sims M, Gu W, et al. miR-203 Functions as a Tumor Suppressor by Inhibiting Epithelial to Mesenchymal Transition in Ovarian Cancer. J Cancer Sci Ther. 2015; 7:34-43.
35. Buggele WA and Horvath CM. MicroRNA profiling of Sendai virus-infected A549 cells identifies miR-203 as an interferon-inducible regulator of IFIT1/ISG56. J Virol. 2013; 87:9260-9270.
36. Yang CH, Yue J, Fan M and Pfeffer LM. IFN induces miR-21 through a signal transducer and activator of transcription 3-dependent pathway as a suppressive negative feedback on IFN-induced apoptosis. Cancer Res. 2010; 70:8108-8116.
37. Yang CH, Yue J, Pfeffer SR, Handorf CR and Pfeffer LM. MicroRNA miR-21 regulates the metastatic behavior of B16 melanoma cells. J Biol Chem. 2011; 286:39172-39178.
38. Yang CH, Yue J, Sims M and Pfeffer LM. The curcumin analog EF24 targets NF-kappaB and miRNA-21, and has potent anticancer activity in vitro and in vivo. PLoS One. 2013; 8:e71130.
39. Yang CH, Yue J, Pfeffer SR, Fan M, Paulus E, Hosni-Ahmed A, Sims M, Qayyum S, Davidoff AM, Handorf CR and Pfeffer LM. MicroRNA-21 promotes glioblastoma tumorigenesis by down-regulating insulin-like growth factor-binding protein-3 (IGFBP3). J Biol Chem. 2014; 289:25079-25087.
40. Yang CH, Pfeffer SR, Sims M, Yue J, Wang Y, Linga VG, Paulus E, Davidoff AM and Pfeffer LM. The oncogenic microRNA-21 inhibits the tumor suppressive activity of FBXO11 to promote tumorigenesis. J Biol Chem. 2015; 290:6037-6046.
41. Zhang J, Stevens MF and Bradshaw TD. Temozolomide: mechanisms of action, repair and resistance. Curr Mol Pharmacol. 2012; 5:102-114.
42. Meng D, Chen Y, Yun D, Zhao Y, Wang J, Xu T, Li X, Wang Y, Yuan L, Sun R, Song X, Huai C, Hu L, et al. High expression of N-myc (and STAT) interactor predicts poor prognosis and promotes tumor growth in human glioblastoma. Oncotarget. 2015; 6:4901-4919. doi: 10.18632/oncotarget.3208.
43. Nduom EK, Wei J, Yaghi NK, Huang N, Kong LY, Gabrusiewicz K, Ling X, Zhou S, Ivan C, Chen JQ, Burks JK, Fuller GN, Calin GA, et al. PD-L1 expression and prognostic impact in glioblastoma. Neuro Oncol. 2016; 18:195-205.
44. Brennan CW, Verhaak RG, McKenna A, Campos B, Noushmehr H, Salama SR, Zheng S, Chakravarty D, Sanborn JZ, Berman SH, Beroukhim R, Bernard B, Wu CJ, et al. The somatic genomic landscape of glioblastoma. Cell. 2013; 155:462-477.
45. Cancer Genome Atlas Research N. Comprehensive genomic characterization defines human glioblastoma genes and core pathways. Nature. 2008; 455:1061-1068.
46. Herms JW, von Loewenich FD, Behnke J, Markakis E and Kretzschmar HA. c-myc oncogene family expression in glioblastoma and survival. Surg Neurol. 1999; 51:536-542.
47. Pfeffer LM, Mullersman JE, Pfeffer SR, Murti A, Shi W and Yang CH. STAT3 as an adapter to couple phosphatidylinositol-3 kinase to the IFNAR-1 chain of the type I IFN receptor. Science. 1997; 276:1418-1420.
48. Wei L, Sandbulte MR, Thomas PG, Webby RJ, Homayouni R and Pfeffer LM. NFB negatively regulates interferon-induced gene expression and anti-influenza activity. J Biol Chem. 2006; 281:11678-11684.
49. Garner JM, Ellison DW, Finkelstein D, Ganguly D, Du Z, Sims M, Yang CH, Interiano RB, Davidoff AM and Pfeffer LM. Molecular heterogeneity in a patient-derived glioblastoma xenoline is regulated by different cancer stem cell populations. PLoS One. 2015; 10:e0125838.
50. Eisenkraft BL, Nanus DM, Albino AP and Pfeffer LM. a-Interferon down-regulates epidermal growth factor receptors on renal carcinoma cells: Relation to cellular responsiveness to the antiproliferative action of a-interferon. Cancer Res. 1991; 51:5881-5887.