
INTRODUCTION
Breast cancer is the most common type of cancer that is diagnosed and the most common cause of cancer deaths among females worldwide [1]. In China, the incidence and mortality from breast cancer is rising rapidly [2]. To effectively reduce the incidence and mortality from breast cancer, its etiology must be determined. Genetic predisposition is an important factor associated with breast cancer risk. Linkage and family based studies have identified numerous predisposition factors for breast cancer, including BRCA1, BRCA2, TP53 and PTEN, which are known as high-penetrance breast cancer susceptibility genes [3–6]. However, only about 5% of the sporadic breast cancer risk and less than 25% of the familial risk can be explained by these high-penetrance susceptibility genes because of their low mutation rates [7]. Meanwhile, GWASs have discovered more than 90 independent low-penetrance susceptibility loci that are associated with breast cancer risk [8]. Different from high-penetrance susceptibility genes, these low-penetrance susceptibility loci account for a substantial portion of the sporadic breast cancer risk and approximately 16% of the familial risk [8]. Most of the susceptibility loci were discovered in women from European populations [9]. Due to the linkage disequilibrium (LD) in diverse populations, it still needs to be determined if these SNPs have strong statistical associations with the risk of breast cancer in other populations. In addition, unlike high-penetrance breast cancer susceptibility genes, each low-penetrance susceptibility loci has only a weak association with the risk of breast cancer, and a small effect for increasing breast cancer risk. However, an accumulative effect of multiple alleles may increase the potential of low-penetrance susceptibility loci, contributing to the risk of breast cancer.
Breast cancer is a complex disease which results from both genetic factors and traditional risk factors. There are a number of traditional risk factors that have been reported to be associated with breast cancer, including age, age at menarche, reproductive and menstrual history, Body Mass Index (BMI), alcohol intake, smoking, physical activity, benign breast diseases, oral contraceptives, and hormone therapy [10–13]. Although many traditional risk factors have been incorporated into risk prediction models for breast cancer [14], little is known about how common susceptibility loci interact with traditional risk factors for breast cancer. The study conducted by the Breast Cancer Association Consortium (BCAC) in 2010 failed to validate the effects of common susceptibility loci on the associations of traditional risk factors with breast cancer [15]. Similarly, a comprehensive study performed by the Breast and Prostate Cancer Cohort Consortium was also unable to validate the effects [16]. However, a study by Nickels et al. including 24 studies from BCAC has provided strong evidence to confirm the important role of genetic-environment interactions in the risk of breast cancer [17]. Moreover, in recent years, exposure data have been incorporated into GWASs, and it is imperative to evaluate gene-environment interactions for breast cancer with the goal of better determining breast cancer susceptibility.
In this study, we conducted a case-control study of 1,156 breast cancer patients and 1,256 healthy controls from a southeast Chinese population to investigate the associations between eight novel GWAS-identified independent genetic susceptibility loci and the risk of breast cancer [18–22]. In addition, we performed stratified analysis, including the subgroups of the breast cancer subtypes, to gain more understanding of these variants in breast cancer etiology. Moreover, we evaluated the combined effects of SNPs. Furthermore, a gene-environment interaction analysis was conducted to explore the role of genetic-environment interactions in the risk of breast cancer.
RESULTS
A total of 1,156 breast cancer patients and 1,126 health controls were selected for this study, and their characteristics are summarized in Table 1. The age of the breast cancer patients (46.7±10.4 years) was appropriately matched with the age of the controls (47.4±10.8 years). The breast cancer patients were more likely to have a low education lever, a lower mean BMI, fewer live births, a shorter period of breast feeding, an earlier age at menarche, a higher incidence of natural premenopausal status, a higher incidence of prior hormone replacement therapy, a higher incidence of previous benign breast disease diagnosis, and a greater frequency of breast cancer family history, compared with health controls (P≤0.05). There were no statistical differences in the other risk factors between patients and controls (P>0.05). With regard to the ER/PR status of the breast cancer patients, there were 778 (67.3%) ER positive cases and 709 (61.3%) PR positive cases included in this study.
Table 1: Characteristics of breast cancer cases and health controls
Characteristics |
Controls |
Cases |
P value |
Age (year)(mean ± SD) |
47.4±10.8 |
46.7±10.4 |
0.118 |
Education level |
1.96×10-36 |
||
Uneducated or primary school |
499 (39.7) |
756 (65.4) |
|
High school or more |
757 (60.3) |
400 (34.6) |
|
BMI (kg/m2)(mean ± SD) |
23.0±3.0 |
22.6±2.6 |
4.60×10⁻⁵ |
Age at first live birth (year)(mean ± SD) |
23.5±5.8 |
23.8±6.3 |
0.255 |
Parity |
3.88×10⁻¹² |
||
0-1 |
534 (42.5) |
655 (56.7) |
|
≥2 |
722 (57.5) |
501 (43.3) |
|
Breast feeding period (year)(mean ± SD) |
17.6±17.9 |
15.7±13.3 |
0.005 |
Breast feeding period (month) |
2.3×10⁻⁶ |
||
<6 |
294 (23.4) |
182 (15.7) |
|
≥6 |
962 (76.6) |
974 (84.3) |
|
Age at menarche (year)(mean ± SD)a |
15.4±1.7 |
15.1±1.7 |
5.06×10⁻⁴ |
Age at menopausal (year)(mean ± SD) |
49.9±3.6 |
49.8±3.8 |
0.677 |
Natural menstrual period (year)(mean ± SD) |
29.0±7.2 |
29.1±7.1 |
0.82 |
Menopausal status |
0.004 |
||
Premenopausal |
806 (64.2) |
755 (65.3) |
|
Postmenopausal |
426 (33.9) |
396 (34.3) |
|
Unnatural menopausal b |
24 (1.9) |
5 (0.4) |
|
Prior hormone replacement therapy |
4.66×10⁻³ |
||
Yes |
28 (2.3) |
56 (4.8) |
|
No |
1228 (97.7) |
1100 (95.2) |
|
Previous benign breast disease |
0.044 |
||
Yes |
30 (2.4) |
44 (3.8) |
|
No |
1226 (97.6) |
1112 (96.2) |
|
Family history of breast cancer |
7.77×10⁻¹⁶ |
||
Yes |
12 (0.96) |
86 (7.44) |
|
No |
1244 (99.04) |
1070 (92.56) |
|
ER status |
|||
Positive |
778 (67.3) |
||
Negative |
378 (32.7) |
||
PR status |
|||
Positive |
709 (61.3) |
||
Negative |
447 (38.7) |
||
HER-2 status |
|||
Positive |
315 (27.2) |
||
Negative |
841 (72.8) |
aPostmenopausal women only. bUnnatural menopausal includes hysterectomy operation and other status.
Table 2 shows the allele and genotype distribution of the eight SNPs in breast patients and controls and their association with overall breast cancer risk. Among the control group, the genotype for the eight SNPs are in a Hardy-Weinberg equilibrium (P>0.05). After adjusting for age, age at menarche, and family history of breast cancer, we found three of the eight SNPs are significantly associated with overall breast cancer risk. The SNP rs12922061 is most strongly associated with breast cancer risk. The per-allele OR is 1.209 (95%CI: 1.064 to 1.372, P=0.003) for the rs12922061 T allele, 1.176 (95%CI: 1.048 to 1.320, P=0.006) for the rs2290203 G allele, and 0.852 (95%CI: 0.759 to 0.956, P=0.007) for the rs2981578 T allele. Rs12922061 and rs2290203 even passed the threshold for Bonferroni correction (P value: 0.05/8=0.00625). We had power of 85.14%, 80.24%, and 78.50% to detect an OR of 1.209, 1.176, and 0.852 for rs12922061, rs2290203, and rs2981578 with the frequency of 0.276, 0.482, and 0.450 respectively. In addition, two SNPs (rs10474352 T allele, OR=0.897, 95%CI: 0.800 to 1.006, P=0.062 and rs10816625 G allele, OR=1.113, 95%CI: 0.991 to 1.250, P=0.071) have a marginally significant association with breast cancer risk. Specifically, rs2981578 and rs10474352 are associated with a decreased risk, which is contrary to the previous reports [18, 19]. We found that the minor and major alleles of our study and of previous reports are switched, indicating that the difference of the associations is due to different minor alleles among different ethnicities. Additionally, environmental risk factors and breast cancer subtypes must also be considered as possible causes of the difference. No significant association was observed for rs2296067, rs4951011, and rs9693444. However, the statistical power for the five negative loci is <70%. Therefore, some of the null findings may be false negatives.
Table 2: Logistic regression analyses on associations between eight SNPs and the risk of breast cancer
SNP |
Genes in/near region |
Allelea |
Casesb (n=1156) |
Controlsb (n=1256) |
MAFc |
HWE |
Co-dominant model |
Additive model |
||||
ORhetd (95%CI) |
Phetd |
ORhomd (95%CI) |
Phomd |
ORd (95%CI) |
Pd |
|||||||
rs12922061 |
CASC16 |
C/T |
534/514/108 |
659/500/97 |
0.316/0.276 |
0.987 |
1.274 (1.075, 1.511) |
0.005* |
1.352 (0.998, 1.831) |
0.051 |
1.209 (1.064, 1.372) |
0.003* |
rs2290203 |
PRC1 |
A/G |
267/570/319 |
333/634/289 |
0.522/0.482 |
0.929 |
1.143 (0.935, 1.396) |
0.192 |
1.382 (1.097, 1.740) |
0.006* |
1.176 (1.048, 1.320) |
0.006* |
rs2981578 |
FGFR2 |
C/T |
405/544/207 |
379/623/254 |
0.414/0.450 |
0.998 |
0.815 (0.678, 0.979) |
0.029 |
0.736 (0.582, 0.932) |
0.011 |
0.852 (0.759, 0.956) |
0.007 |
rs10474352 |
ARRDC3 |
C/T |
363/569/224 |
367/602/287 |
0.440/0.468 |
0.414 |
0.950 (0.788, 1.147) |
0.596 |
0.795 (0.632, 1.002) |
0.052 |
0.897 (0.800, 1.006) |
0.062 |
rs10816625 |
LOC105376214 |
A/G |
349/579/228 |
431/607/218 |
0.448/0.415 |
0.986 |
1.148 (0.956, 1.380) |
0.140 |
1.226 (0.967, 1.554) |
0.092 |
1.113 (0.991, 1.250) |
0.071 |
rs2296067 |
KDM4C |
G/A |
400/570/186 |
429/614/213 |
0.407/0.414 |
0.965 |
0.988 (0.825, 1.183) |
0.896 |
0.926 (0.726, 1.180) |
0.533 |
0.967 (0.860, 1.087) |
0.574 |
rs9693444 |
DUSP4-MIR3148 |
C/A |
564/479/113 |
608/535/113 |
0.305/0.303 |
0.955 |
0.967 (0.815, 1.148) |
0.702 |
1.084 (0.811, 1.447) |
0.586 |
1.012 (0.893, 1.146) |
0.854 |
rs4951011 |
ZC3H11A |
A/G |
523/510/123 |
585/529/142 |
0.326/0.324 |
0.404 |
1.103 (0.928, 1.310) |
0.266 |
0.974 (0.741, 1.281) |
0.851 |
1.025 (0.907, 1.157) |
0.694 |
aMajor/minor allele. bMajor homozygote/heterozygote/rare homozygote between cases and controls. cMinor allele frequency (MAF) among cases/controls. dLogistic regression with adjustment for age, age at menarche and family history of breast cancer. P≤0.00625.
The results of stratified analysis are displayed in Table 3 to Table 6. Regardless of BMI, age at menarche, and the length of the breast feeding period, rs12922061 can increase the risk of breast cancer, and a significant association is observed in women of older age, higher education, premenopausal status, more years of menstruation, younger age at first live birth, more live births, without family history of breast cancer, ER positive, HR positive, and Luminal or HER-2 overexpression type. Subsequently, heterogeneity analysis show that there is heterogeneity between the breast subtypes (P=0.031). However, for Luminal or HER-2 overexpression type cases, rs12922061 have a more significant effect (P=0.001 and P=0.011, respectively). Meanwhile, among women of a younger age, with lower BMI, lower education, a younger age at menarche, postmenopausal status, older age at menopause, more menstruation years, older age at first live birth, longer period of breast feeding, ER positive, HR positive, and with Luminal or HER-2 overexpression type, the association for rs2290203 is significant, regardless of the family history of breast cancer. Moreover, regardless of the family history of breast cancer, rs2981578 shows a protective effect in women of a younger age, with lower BMI, higher education, younger age at menarche, premenopausal status, fewer menstruation years, younger age at first live birth, fewer live births, shorter period of breast feeding, ER positive, HR positive, and Luminal type or HER-2 overexpression type. After heterogeneity analysis, we observed that there are heterogeneities between the two subgroups in age and BMI (P=0.036 and P=0.032, respectively). Nevertheless, rs2981578 presents a more significant protective effect in the group with a younger age and the group with a lower BMI (P=0.002 and P=4.53×10⁻⁴, respectively).
Table 3: Stratified analyses between rs12922061, rs2290203, rs2981578, and rs10474352 and breast cancer risk
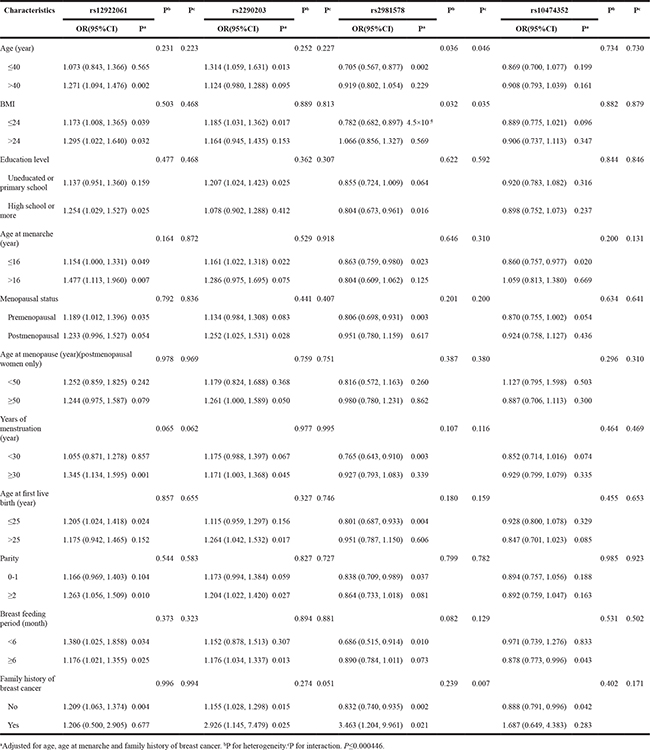
Table 4: Stratified analyses between rs12922061, rs2290203, rs2981578, and rs10474352 and breast cancer risk by ER status, HR status and subtype
Characteristics |
rs12922061 |
Pb |
rs2290203 |
Pb |
rs2981578 |
Pb |
rs10474352 |
Pb |
||||
OR(95%CI) |
Pa |
OR(95%CI) |
Pa |
OR(95%CI) |
Pa |
OR(95%CI) |
Pa |
|||||
ER status |
0.113 |
0.395 |
0.874 |
0.165 |
||||||||
Positive |
1.283 (1.114, 1.478) |
0.001 |
1.217 (1.069, 1.384) |
0.003 |
0.922 (0.871, 0.977) |
0.006 |
0.947 (0.833, 1.075) |
0.399 |
||||
Negative |
1.067 (0.889, 1.281) |
0.485 |
1.111 (0.940, 1.314) |
0.216 |
0.909 (0.770, 1.074) |
0.262 |
0.818 (0.693, 0.965) |
0.017 |
||||
HR status |
0.087 |
0.300 |
0.244 |
0.095 |
||||||||
Positive |
1.283 (1.116, 1.475) |
4.7*10-4 |
1.221 (1.075, 1.387) |
0.002 |
0.822 (0.723, 0.936) |
0.003 |
0.952 (0.839, 1.079) |
0.439 |
||||
Negative |
1.048 (0.866, 1.267) |
0.630 |
1.091 (0.917, 1.297) |
0.325 |
0.937 (0.790, 1.113) |
0.460 |
0.796 (0.670, 0.946) |
0.010 |
||||
Subtype |
0.031 |
0.276 |
0.293 |
0.555 |
||||||||
Luminal |
1.294 (1.113, 1.504) |
0.001 |
1.174 (1.023, 1.348) |
0.022 |
0.837 (0.729, 0.961) |
0.012 |
0.936 (0.817, 1.071) |
0.336 |
||||
HER-2 overexpression |
1.285 (1.058, 1.560) |
0.011 |
1.385 (0.152, 1.664) |
0.001 |
0.819 (0.681, 0.985) |
0.034 |
0.886 (0.740, 1.061) |
0.189 |
||||
Basal-like |
0.918 (0.717, 1.177) |
0.501 |
0.976 (0.783, 1.216) |
0.828 |
1.023 (0.823, 1.272) |
0.837 |
0.815 (0.656, 1.014) |
0.066 |
||||
aAdjusted for age, age at menarche and family history of breast cancer. bP for heterogeneity. P≤0.000446.
Table 5: Stratified analyses between rs10816625, rs2296067, rs9693444, and rs4951011 and breast cancer risk
Characteristics |
rs10816625 |
Pb |
Pc |
rs2296067 |
Pb |
Pc |
rs9693444 |
Pb |
Pc |
rs4951011 |
Pb |
Pc |
||||
OR(95%CI) |
Pa |
OR(95%CI) |
Pa |
OR(95%CI) |
Pa |
OR(95%CI) |
Pa |
|||||||||
Age (year) |
0.099 |
0.125 |
0.686 |
0.704 |
0.911 |
0.905 |
0.285 |
0.259 |
||||||||
≤40 |
0.960 (0.775, 1.188) |
0.707 |
0.930 (0.747, 1.158) |
0.517 |
1.024 (0.813, 1.291) |
0.839 |
1.139 (0.911, 1.424) |
0.254 |
||||||||
>40 |
1.182 (1.029, 1.358) |
0.018 |
0.981 (0.853, 1.127) |
0.785 |
1.008 (0.869, 1.168) |
0.919 |
0.979 (0.847, 1.132) |
0.777 |
||||||||
BMI |
0.149 |
0.122 |
0.618 |
0.604 |
0.240 |
0.185 |
0.318 |
0.330 |
||||||||
≤24 |
1.052 (0.915, 1.209) |
0.492 |
0.990 (0.859, 1.140) |
0.887 |
0.956 (0.824, 1.109) |
0.551 |
1.066 (0.922, 1.233) |
0.389 |
||||||||
>24 |
1.282 (1.035, 1.587) |
0.023 |
0.928 (0.750, 1.149) |
0.493 |
1.136 (0.903, 1.431) |
0.277 |
0.933 (0.746, 1.166) |
0.540 |
||||||||
Education level |
0.450 |
0.425 |
0.981 |
0.960 |
0.811 |
0.830 |
0.283 |
0.296 |
||||||||
Uneducated or primary school |
1.194 (1.008, 1.414) |
0.040 |
0.981 (0.828, 1.162) |
0.822 |
1.043 (0.873, 1.245) |
0.645 |
0.960 (0.806, 1.142) |
0.641 |
||||||||
High school or more |
1.086 (0.910, 1.296) |
0.360 |
0.984 (0.822, 1.177) |
0.857 |
1.010 (0.833, 1.225) |
0.916 |
1.106 (0.918, 1.332) |
0.288 |
||||||||
Age at menarche (year) |
0.918 |
0.843 |
0.107 |
0.241 |
0.643 |
0.187 |
0.687 |
0.505 |
||||||||
≤16 |
1.118 (0.984, 1.271) |
0.088 |
0.924 (0.811, 1.053) |
0.234 |
1.027 (0.893, 1.181) |
0.709 |
1.048 (0.914, 1.201) |
0.501 |
||||||||
>16 |
1.100 (0.832, 1.455) |
0.504 |
1.222 (0.927, 1.611) |
0.154 |
0.954 (0.719, 1.265) |
0.743 |
0.984 (0.746, 1.299) |
0.910 |
||||||||
Menopausal status |
0.779 |
0.685 |
0.363 |
0.343 |
0.619 |
0.592 |
0.246 |
0.249 |
||||||||
Premenopausal |
1.094 (0.947, 1.264) |
0.221 |
1.005 (0.869, 1.162) |
0.946 |
1.033 (0.887, 1.204) |
0.675 |
1.083 (0.931, 1.261) |
0.300 |
||||||||
Postmenopausal |
1.134 (0.927, 1.387) |
0.220 |
0.896 (0.731, 1.098) |
0.290 |
0.966 (0.777, 1.200) |
0.752 |
0.931 (0.755, 1.148) |
0.506 |
||||||||
Age at menopause (year)(postmenopausal women only) |
0.999 |
0.865 |
0.762 |
0.774 |
0.818 |
0.870 |
0.930 |
0.926 |
||||||||
<50 |
1.116 (0.781, 1.593) |
0.547 |
0.985 (0.689, 1.407) |
0.933 |
1.029 (0.712, 1.487) |
0.879 |
0.944 (0.670, 1.330) |
0.742 |
||||||||
≥50 |
1.116 (0.886, 1.405) |
0.352 |
0.920 (0.726, 1.167) |
0.493 |
0.975 (0.758, 1.256) |
0.847 |
0.926 (0.723, 1.186) |
0.543 |
||||||||
Years of menstruation (year) |
0.793 |
0.751 |
0.121 |
0.109 |
0.203 |
0.196 |
0.335 |
0.335 |
||||||||
<30 |
1.128 (0.947, 1.345) |
0.178 |
1.070 (0.898, 1.274) |
0.448 |
1.111 (0.922, 1.339) |
0.267 |
1.095 (0.913, 1.314) |
0.328 |
||||||||
≥30 |
1.093 (0.936, 1.276) |
0.263 |
0.884 (0.754, 1.036) |
0.129 |
0.941 (0.795, 1.112) |
0.475 |
0.969 (0.823, 1.141) |
0.704 |
||||||||
Age at first live birth (year) |
0.096 |
0.017 |
0.047 |
0.164 |
0.818 |
0.620 |
0.400 |
0.846 |
||||||||
≤25 |
1.199 (1.027, 1.400) |
0.021 |
1.050 (0.900, 1.226) |
0.532 |
1.007 (0.855, 1.186) |
0.930 |
0.965 (0.823, 1.130) |
0.656 |
||||||||
>25 |
0.976 (0.809, 1.179) |
0.801 |
0.818 (0.674, 0.994) |
0.043 |
1.039 (0.845, 1.278) |
0.718 |
1.081 (0.881, 1.326) |
0.458 |
||||||||
Parity |
0.737 |
0.669 |
0.391 |
0.409 |
1.000 |
0.986 |
0.259 |
0.281 |
||||||||
0-1 |
1.089 (0.922, 1.287) |
0.313 |
0.924 (0.781, 1.093) |
0.358 |
1.009 (0.843, 1.208) |
0.924 |
1.119 (0.936, 1.337) |
0.218 |
||||||||
≥2 |
1.134 (0.961, 1.339) |
0.137 |
1.026 (0.867, 1.213) |
0.769 |
1.009 (0.846, 1.203) |
0.919 |
0.969 (0.817, 1.149) |
0.717 |
||||||||
Breast feeding period (month) |
0.903 |
0.827 |
0.347 |
0.400 |
0.060 |
0.032 |
0.562 |
0.624 |
||||||||
<6 |
1.129 (0.852, 1.496) |
0.397 |
0.856 (0.650, 1.126) |
0.266 |
1.340 (1.006, 1.784) |
0.046 |
1.112 (0.835, 1.482) |
0.468 |
||||||||
≥6 |
1.107 (0.973, 1.259) |
0.122 |
0.986 (0.864, 1.124) |
0.831 |
0.946 (0.823, 1.088) |
0.437 |
1.008 (0.880, 1.154) |
0.911 |
||||||||
Family history of breast cancer |
0.503 |
0.373 |
0.156 |
0.252 |
0.931 |
0.927 |
0.341 |
0.370 |
||||||||
No |
1.105 (0.983, 1.243) |
0.940 |
0.976 (0.867, 1.099) |
0.686 |
1.011 (0.892, 1.146) |
0.865 |
1.033 (0.914, 1.168) |
0.607 |
||||||||
Yes |
1.743 (0.689, 4.414) |
0.241 |
0.556 (0.226, 1.364) |
0.199 |
1.061 (0.422, 2.669) |
0.899 |
0.703 (0.302, 1.637) |
0.414 |
||||||||
aAdjusted for age, age at menarche and family history of breast cancer. bP for heterogeneity.cP for interaction. P≤0.000446.
Table 6: Stratified analyses between rs10816625, rs2296067, rs9693444, and rs4951011 and breast cancer risk by ER status, HR status and subtype
Characteristics |
rs10816625 |
Pb |
rs2296067 |
Pb |
rs9693444 |
Pb |
rs4951011 |
Pb |
||||
OR(95%CI) |
Pa |
OR(95%CI) |
Pa |
OR(95%CI) |
Pa |
OR(95%CI) |
Pa |
|||||
ER status |
0.099 |
0.213 |
0.946 |
0.452 |
||||||||
Positive |
1.181 (1.037, 1.346) |
0.012 |
0.918 (0.804, 1.048) |
0.206 |
1.016 (0.884, 1.169) |
0.818 |
0.994 (0.868, 1.139) |
0.933 |
||||
Negative |
0.990 (0.838, 1.170) |
0.906 |
1.055 (0.893, 1.248) |
0.529 |
1.008 (0.842, 1.207) |
0.932 |
1.083 (0.911, 1.288) |
0.366 |
||||
HR status |
0.254 |
0.530 |
0.744 |
0.208 |
||||||||
Positive |
1.156 (1.016, 1.315) |
0.028 |
0.941 (0.826, 1.072) |
0.361 |
1.025 (0.893, 1.177) |
0.722 |
0.979 (0.856, 1.120) |
0.759 |
||||
Negative |
1.021 (0.859, 1.214) |
0.810 |
1.010 (0.849, 1.202) |
0.908 |
0.986 (0.818, 1.190) |
0.887 |
1.135 (0.949, 1.357) |
0.165 |
||||
Subtype |
0.088 |
0.486 |
0.042 |
0.042 |
||||||||
Luminal |
1.131 (0.984, 1.299) |
0.083 |
0.921 (0.799, 1.060) |
0.250 |
1.006 (0.866, 1.168) |
0.941 |
0.978 (0.846, 1.130) |
0.763 |
||||
HER-2 overexpression |
1.193 (0.994, 1.431) |
0.058 |
0.967 (0.804, 1.163) |
0.718 |
1.196 (0.988, 1.448) |
0.067 |
0.935 (0.770, 1.135) |
0.497 |
||||
Basal-like |
0.890 (0.711, 1.113) |
0.308 |
1.092 (0.872, 1.367) |
0.443 |
0.804 (0.625, 1.033) |
0.088 |
1.378 (1.104, 1.719) |
0.005 |
||||
aAdjusted for age, age at menarche and family history of breast cancer. bP for heterogeneity. P≤0.000446.
Although, the other loci are not associated with overall breast cancer risk, there still are significant associations between these loci and different subgroups. The SNP rs10474352 shows a significant protective effect in the women of a younger age at menarche, those with a longer period of breast feeding, those without a family history of breast cancer, who are ER negative, and HR negative. In addition, rs10816625 is significantly associated with the women of an older age, a higher BMI, lower education, younger age at first live birth and who are ER positive and HR positive. Moreover, rs2296067, rs9693444, and rs4951011 are associated with women of an older age at first live birth, shorter period of breast feeding, and Basal-like type, respectively. There are heterogeneities between the subgroup of age at first live birth for rs2296067 (P=0.047), between the subgroup of breast subtype for rs9693444 (P=0.042), and between the subgroup of breast subtype for rs4951011 (P=0.042). Only rs4951011 shows a more significant association with the Basal-like type of breast cancer (P=0.005). No heterogeneities were observed in the rest of the subgroups. After Bonferroni correction (P value: 0.05/8/14=0.000446), there were no statistically significant was observed in stratified analysis.
As shown in Table 7, we selected the two loci that are significantly associated with overall breast cancer risk to calculate their combined effects (rs12922061-T and rs2290203-G). With no risk allele as the reference, the individual carrying more risk alleles would have a higher OR; 1-2 alleles, OR=1.238, 95%CI: 0.965 to 1.588; 3-4 alleles, OR=1.716, 95%CI: 1.268 to 2.324. It indicated that the combined effect of susceptibility loci would amplify the effect of contributing to the risk of breast cancer (P trend =3.97×10⁻⁴).
Table 7: The combined effects of rs12922061 and rs2290203on the association with breast cancer risk
Number of risk allelesa |
Cases (n=1156) (%) |
Controls (n=1256) (%) |
OR(95%CI)b |
Pvalue |
0 |
134 (11.6) |
180 (14.3) |
1 |
|
1-2 |
795 (68.8) |
894 (71.2) |
1.238 (0.965,1.588) |
0.094 |
3-4 |
227 (19.6) |
182 (14.5) |
1.716 (1.268,2.324) |
4.76×10⁻⁴ |
P trend |
3.97×10⁻⁴ |
aThe risk alleles included rs12922061-C and rs2290203-G. bAdjusted for age, age at menarche and family history of breast cancer.
In the gene-environment interaction analysis, we found that there are interactions between rs2981578 and the age, BMI, and a family history of breast cancer for reducing the risk of breast cancer (P=0.046, P=0.035, and P=0.007, respectively). Additionally, rs10816625 has an interaction with the age at the first live birth for the risk of breast cancer (P=0.017). Moreover, there is a significant interaction between rs9693444 and the length of the breast feeding period for breast cancer risk (P=0.032) (Table 3 and Table 5).
DISCUSSION
In the present study, we confirmed that three of the eight SNPs, rs12922061 on 16q12.2, rs2290203 on 15q26.1, and rs2981578 on 10q26.13, are significantly associated with overall breast cancer risk in southeast Chinese women. In addition, rs12922061 and rs2290203 even passed the threshold for Bonferroni correction.
The SNP rs12922061, located in the first intron of LOC643714, was identified as a susceptibility variant of breast cancer in a Japanese GWAS [18]. In the present study, we first validated that rs12922061 has a significant association with breast cancer risk in southeast Chinese women, with an allelic OR of 1.209, consistent with the initial GWAS. According to Entrez Nucleotide, it is predicted that the LOC643714 locus codes for a small mRNA, which could hypothetically be translated into a 55 amino acids protein. However, the specific function of LOC643714 is still uncertain. A high expression level of LOC643714 was found in ER positive tumors [23]. In the present study, we observed that rs12922061 has a significant association with the ER positive subgroup, which corresponded with the expression of LOC643714. We hypothesize that the SNP rs12922061 may participate in the regulation of the expression of LOC643714 in ER positive tumors; further analysis is warranted.
The SNP rs2290203 was discovered in an East Asian GWAS, and has been confirmed in European populations [19]. In this study we found that this locus is associated with breast cancer risk in woman from southeast Chinese, and the effect is similar to the initial GWAS (OR=1.176; 95%CI: 1.048 to 1.320). This locus lies in intron 14 of the protein regulator of the cytokinesis 1 (PRC1) gene, which encodes the PRC1 protein and is suspected of being strictly regulated in a cancer-specific manner. The PRC1 protein is a mitotic spindle midzone-associated protein and is a substrate of a cyclin-dependent kinase [24]. The PRC1 gene is down-regulated by p53, whereas in p53 defective cells, it is over-expressed [25]. Also, the expression level of the PRC1 gene is significantly higher in breast tumor tissue, compared with adjacent normal tissue [19]. A study indicated that the higher expression level of the PRC1 gene could be a predictor of the poor prognosis for breast cancer patients [26]. However, there is no association reported between rs2290203 and the expression of the PRC1 gene, but it does relate to the PCCD1 gene (5,712 bp upstream of rs2290203) [19, 27]. We still don’t know the functions of the PCCD1 gene.
The SNP rs2981578 is located in intron 2 of the fibroblast growth factor receptor 2 (FGFR2) gene. In 2007 this gene was reported to be associated with breast cancer in women of European descent [28, 29]. Subsequently, rs2981578 was discovered to be associated with breast cancer in a fine-mapping study of African American populations [30]. This locus has also been identified in an African population [31]. Interestingly, in our study, we found that rs2981578 is associated with a decreased breast cancer risk, which is contrary to the previous reports (OR=0.852; 95%CI: 0.759 to 0.956). This may be due to the diverse genetic background among different ethnicities combined with environmental risk factors and breast cancer subtypes. Additionally, fibroblast growth factor receptor type 2, encoded by the FGFR2 gene, is a receptor tyrosine kinase, which is an essential part of the signaling pathway of the growth and differentiation for cells in breast tissue [32]. Meanwhile, rs2981578 is reported to cause differential expression of the common and minor haplotypes of the FGFR2 gene [33].
In postmenopausal women the endogenous estrogen is mainly provided by adipose tissue [34], and it is well demonstrated that estrogen has a significant linear correlation with breast cancer in these women [35]. It was also reported that some polymorphisms in FGFR2 were associated with breast cancer risk in postmenopausal women [36]. From our results, we believe that rs2981578 is correlated with reducing breast cancer risk in women of a younger age, lower BMI, younger age at menarche, premenopausal status, and fewer menstruation years; particularly with ER positive, HR positive, and Luminal type. The gene-environment interaction analysis also showed that rs2981578 is interacting with BMI. Considering the above results, we speculated that rs2981578 may play an important role in regulating pathways which are related to estrogen. Nevertheless, further functional research is still needed to confirm the relationship of the susceptibility locus and breast cancer.
For rs2296067, rs4951011, and rs9693444, no significant ORs were observed in the present study. However, there were still significant associations between these loci and different subgroups. Moreover, it has been previously reported that rs9693444 is associated with breast cancer risk in Chinese women (P=6.44×10⁻⁴) [37]. We believe that the reason for failing to confirm their previously established role in breast cancer risk is that there are difference LD patterns in difference populations. In addition, environmental risk factors and breast cancer subtypes should also be taken into consideration.
Several limitations need to be taken into consideration in this study. Above all, the sample size in our study is still limiting and that will affect the sensitivity and accuracy of the results. Particularly in the stratified analysis, the incidences of some epidemiological characteristics were not numerous enough and cannot be used to efficiently analyze our data. In addition, as our study was a hospital based case-control study, there was a certain selection bias compared with the general population. The self-reported life-style factors of participation might also have a recall bias. Therefore, in the next few years, we will expand the sample size and perform a large series study to improve the sensitivity and accuracy of the study, aiming to reduce these biases, and better understand the relationship between breast cancer risk and these susceptibility loci.
In conclusion, our study is the first study to validate that rs12922061 on 16q12.2, rs2290203 on 15q26.1, and rs2981578 on 10q26.13 are associated with overall breast cancer risk in southeast Chinese women. The SNPs rs12922061 and rs2290203 even passed the threshold for Bonferroni correction. In addition, the three other SNPs (rs10474352 on 5q14.3, rs10816625 on 9q31.2, and rs4951011 on 1q32.1) are found to have a significant association within different subgroups. Moreover, gene-environment interaction analysis revealed that there are interactions between rs2981578 and the age, BMI, and family history of breast cancer, between rs10816625 and the age at the first live birth, and between rs9693444 and the length of the breast feeding period. These findings may provide new insight into the association between genetic susceptibility and the fine classifications of breast cancer, which would guide clinical therapy in the future. Finally, it is certain that further large series studies and functional research are still warranted.
MATERIALS AND METHODS
Study participants
All study participants were genetically unrelated Chinese females from Fujian province. There are 1,166 breast cancer patients and 1,258 healthy controls in this hospital-based case-control study. Patients were randomly enrolled from Fujian Medical University Union Hospital, Fujian, China, between January 2005 and December 2015, and each case was histopathologically confirmed by at least two oncologists. Estrogen receptor (ER) status, progesterone receptor (PR) status and human epidermal growth factor receptor 2 (HER-2) status of patients were evaluated by immunohistochemical analysis. It was considered to be a positive result when the percentage of stained cancer cell nucleus were ≥10%. The rest of the clinicopathological data was obtained from medical records. Healthy controls were selected from people who were undergoing routine health examinations in the same hospital during the corresponding period. Controls were age-matched (±5 years) healthy individuals without breast cancer and other cancers. After written informed consent was obtained, each study participant was personally interviewed face-to-face by trained interviewers to collect information that included demographic data, menstrual, reproductive and breastfeeding history, environmental exposure history, previous benign breast disease history, and their family history of breast cancer. Subsequently, a 3-ml peripheral blood sample was collected. This study was approved by the Ethics Committee of Fujian Medical University Union Hospital.
SNP selection and genotyping
We selected 23 novel GWAS-identified SNPs by reviewing the available literature between January 2013 and December 2015 [18–22, 38–40]. There were 12 SNPs be excluded because they did not achieved genome-wide significance (P≤5.0×10⁻⁸). The SNP rs13294895 was excluded owing to have an minor allele frequency (MAF) <0.1 in Han Chinese from Beijing from HapMap. The MAF of rs140068132 in Han Chinese from Beijing from HapMap have not been reported, therefore rs140068132 was removed. A further SNP rs3803662 has been incorporated in our foregoing experiments. Thus, the remaining eight SNPs were selected for genotyping, namely 16q12.2-rs12922061 (CASC16), 15q26.1-rs2290203 (PRC1), 10q26.13-rs2981578 (FGFR2), 5q14.3-rs10474352 (ARRDC3), 9q31.2-rs10816625 (LOC105376214), 9-rs2296067 (KDM4C), 8p12- rs9693444 (DUSP4-MIR3148), and 1q32.1-rs4951011 (ZC3H11A).
Genomic DNA was extracted from leukocytes from EDTA anti-coagulated whole blood using the Whole-Blood DNA Extraction Kit (Bioteke, Beijing, China), according to the manufacturer’s protocol. The concentration of the DNA samples was quantified with an Epoch Microplate Spectrophotometer (BioTek Instruments, Winooski, VT, USA), and quality of DNA samples was determined by agarose gel electrophoresis. Qualified DNA samples were genotyped by SNPscan, which is a high-throughput SNPs genotyping technology (Genesky Biotechnologies Inc., Shanghai, China). Finally, the raw date was analyzed by the GeneMapper 4.0 Software (Applied Biosystems, Foster City, CA). A five percent sample of both the cases and controls were randomly selected as blinded duplicates for quality assessment purposes and 100% agreement was obtained. Due to DNA quality or quantity, genotyping of ten cases (0.86%) and two controls (0.16%) failed. The call rate for per-SNP was 99.5%. After removing all data from these 12 participants, there were 1,156 cases and 1,256 controls in the final analyses.
Statistical analyses
Differences in demographic characteristics, risk factors and frequencies of alleles and genotypes between cases and controls were evaluated by t-test, for continuous variables, or χ2 tests, for categorical variables. Genotype data of control samples were evaluated for consistency with the Hardy-Weinberg equilibrium (HWE) by a goodness-of-fit χ2 test. The associations between SNPs and the risk of breast cancer were assessed by computing odds ratios (ORs) and 95% confidence interval (CIs) using conditional logistic regression models (co-dominant model and additive model) with adjustment for potential confounders such as age, age at menarche, and family history of breast cancer. The power of the study was carried out by using the Quanto, version 1.2.4, with the disease risk in the Chinese population was 268.6 per 100000. The date was then stratified into fourteen subgroups (Table 3 to Table 6). Subsequently, we used the χ2-based Q-test to estimate the heterogeneity of associations within subgroup. Moreover, we categorized all cases and controls into five groups based on the number of risk alleles they carried (from 0 to 4, with 0 risk alleles used as the reference), and assessed the cumulative effect of multiple genetic risk variants by calculating OR and 95%CI with adjustment for potential confounders as described above. Furthermore, the genetic-environment multiplicative interaction analysis was applied to explore the interactions between susceptibility loci and traditional risk factors, and it was performed by a multinomial logistic regression model. All of the statistical analyses were two-sided and a P value equal to or less than 0.05 was taken as the significance level. The Bonferroni correction was adopted to correct multiple comparisons. Analyses were carried out by using the Statistical Package for the Social Sciences (SPSS, version 18.0)
ACKNOWLEDGMENTS
We would like to acknowledge the assistance of all of the research nurses of Department of General Surgery, Fujian Medical University Union Hospital. We also thank Qiaohui Zhan and Weibin Lian for sample and data collection. We would like to thank Xiaoting Wang, Linquan Zhou and Shuting Lin for their contributions to this study.
CONFLICTS OF INTEREST
None declared.
GRANT SUPPORT
Funding: This work was supported by the National Nature Science Foundation (grant number 81302320), National Key Clinical Specialty Construction Program (grant number 201030404#), Sci-Tech Key Program of Fujian Province (2013Y0040 and 2016J01549) and Medical Elite Cultivation Program of Fujian, P.R.C. (2013-ZQN-ZD-12).
REFERENCES
1. Torre LA, Bray F, Siegel RL, Ferlay J, Lortet-Tieulent J and Jemal A. Global cancer statistics, 2012. CA Cancer J Clin. 2015; 65:87-108.
2. Chen W, Zheng R, Baade PD, Zhang S, Zeng H, Bray F, Jemal A, Yu XQ and He J. Cancer statistics in China, 2015. CA Cancer J Clin. 2016.
3. Hall JM, Lee MK, Newman B, Morrow JE, Anderson LA, Huey B and King MC. Linkage of early-onset familial breast cancer to chromosome 17q21. Science (New York, NY). 1990; 250:1684-1689.
4. Wooster R, Bignell G, Lancaster J, Swift S, Seal S, Mangion J, Collins N, Gregory S, Gumbs C and Micklem G. Identification of the breast cancer susceptibility gene BRCA2. Nature. 1995; 378:789-792.
5. Liaw D, Marsh DJ, Li J, Dahia PL, Wang SI, Zheng Z, Bose S, Call KM, Tsou HC, Peacocke M, Eng C and Parsons R. Germline mutations of the PTEN gene in Cowden disease, an inherited breast and thyroid cancer syndrome. Nature genetics. 1997; 16:64-67.
6. Malkin D, Li FP, Strong LC, Fraumeni JF, Jr., Nelson CE, Kim DH, Kassel J, Gryka MA, Bischoff FZ, Tainsky MA and et al. Germ line p53 mutations in a familial syndrome of breast cancer, sarcomas, and other neoplasms. Science (New York, NY). 1990; 250:1233-1238.
7. Rebbeck TR. Inherited genetic predisposition in breast cancer. A population-based perspective. Cancer. 1999; 86:2493-2501.
8. Michailidou K, Beesley J, Lindstrom S, Canisius S, Dennis J, Lush MJ, Maranian MJ, Bolla MK, Wang Q, Shah M, Perkins BJ, Czene K, Eriksson M, Darabi H, Brand JS, Bojesen SE, et al. Genome-wide association analysis of more than 120,000 individuals identifies 15 new susceptibility loci for breast cancer. Nature genetics. 2015; 47:373-380.
9. Sapkota Y. Germline DNA variations in breast cancer predisposition and prognosis: a systematic review of the literature. Cytogenetic and genome research. 2014; 144:77-91.
10. Hamajima N, Hirose K, Tajima K, Rohan T, Calle EE, Heath CW, Jr., Coates RJ, Liff JM, Talamini R, Chantarakul N, Koetsawang S, Rachawat D, Morabia A, Schuman L, Stewart W, Szklo M, et al. Alcohol, tobacco and breast cancer--collaborative reanalysis of individual data from 53 epidemiological studies, including 58,515 women with breast cancer and 95,067 women without the disease. British journal of cancer. 2002; 87:1234-1245.
11. Phipps AI, Chlebowski RT, Prentice R, McTiernan A, Wactawski-Wende J, Kuller LH, Adams-Campbell LL, Lane D, Stefanick ML, Vitolins M, Kabat GC, Rohan TE and Li CI. Reproductive history and oral contraceptive use in relation to risk of triple-negative breast cancer. Journal of the National Cancer Institute. 2011; 103:470-477.
12. van den Brandt PA, Spiegelman D, Yaun SS, Adami HO, Beeson L, Folsom AR, Fraser G, Goldbohm RA, Graham S, Kushi L, Marshall JR, Miller AB, Rohan T, Smith-Warner SA, Speizer FE, Willett WC, et al. Pooled analysis of prospective cohort studies on height, weight, and breast cancer risk. American journal of epidemiology. 2000; 152:514-527.
13. McTiernan A. Behavioral risk factors in breast cancer: can risk be modified? The oncologist. 2003; 8:326-334.
14. Gail MH, Brinton LA, Byar DP, Corle DK, Green SB, Schairer C and Mulvihill JJ. Projecting individualized probabilities of developing breast cancer for white females who are being examined annually. Journal of the National Cancer Institute. 1989; 81:1879-1886.
15. Milne RL, Gaudet MM, Spurdle AB, Fasching PA, Couch FJ, Benitez J, Arias Perez JI, Zamora MP, Malats N, Dos Santos Silva I, Gibson LJ, Fletcher O, Johnson N, Anton-Culver H, Ziogas A, Figueroa J, et al. Assessing interactions between the associations of common genetic susceptibility variants, reproductive history and body mass index with breast cancer risk in the breast cancer association consortium: a combined case-control study. Breast cancer research. 2010; 12:R110.
16. Campa D, Kaaks R, Le Marchand L, Haiman CA, Travis RC, Berg CD, Buring JE, Chanock SJ, Diver WR, Dostal L, Fournier A, Hankinson SE, Henderson BE, Hoover RN, Isaacs C, Johansson M, et al. Interactions Between Genetic Variants and Breast Cancer Risk Factors in the Breast and Prostate Cancer Cohort Consortium. Journal of the National Cancer Institute. 2011; 103:1252-1263.
17. Nickels S, Truong T, Hein R, Stevens K, Buck K, Behrens S, Eilber U, Schmidt M, Haberle L, Vrieling A, Gaudet M, Figueroa J, Schoof N, Spurdle AB, Rudolph A, Fasching PA, et al. Evidence of gene-environment interactions between common breast cancer susceptibility loci and established environmental risk factors. PLoS genetics. 2013; 9:e1003284.
18. Low SK, Takahashi A, Ashikawa K, Inazawa J, Miki Y, Kubo M, Nakamura Y and Katagiri T. Genome-wide association study of breast cancer in the Japanese population. PloS one. 2013; 8:e76463.
19. Cai Q, Zhang B, Sung H, Low SK, Kweon SS, Lu W, Shi J, Long J, Wen W, Choi JY, Noh DY, Shen CY, Matsuo K, Teo SH, Kim MK, Khoo US, et al. Genome-wide association analysis in East Asians identifies breast cancer susceptibility loci at 1q32.1, 5q14.3 and 15q26.1. Nature genetics. 2014; 46:886-890.
20. Orr N, Dudbridge F, Dryden N, Maguire S, Novo D, Perrakis E, Johnson N, Ghoussaini M, Hopper JL, Southey MC, Apicella C, Stone J, Schmidt MK, Broeks A, Van’t Veer LJ, Hogervorst FB, et al. Fine-mapping identifies two additional breast cancer susceptibility loci at 9q31.2. Human molecular genetics. 2015; 24:2966-2984.
21. Hong Q, Yu S, Yang Y, Liu G and Shao Z. A polymorphism in JMJD2C alters the cleavage by caspase-3 and the prognosis of human breast cancer. Oncotarget. 2014; 5:4779-4787. doi: 10.18632/oncotarget.2029.
22. Michailidou K, Hall P, Gonzalez-Neira A, Ghoussaini M, Dennis J, Milne RL, Schmidt MK, Chang-Claude J, Bojesen SE, Bolla MK, Wang Q, Dicks E, Lee A, Turnbull C, Rahman N, Breast, et al. Large-scale genotyping identifies 41 new loci associated with breast cancer risk. Nature genetics. 2013; 45:353-361, 361e351-352.
23. Gudmundsdottir ET, Barkardottir RB, Arason A, Gunnarsson H, Amundadottir LT, Agnarsson BA, Johannsson OT and Reynisdottir I. The risk allele of SNP rs3803662 and the mRNA level of its closest genes TOX3 and LOC643714 predict adverse outcome for breast cancer patients. BMC cancer. 2012; 12:621.
24. Zhu C and Jiang W. Cell cycle-dependent translocation of PRC1 on the spindle by Kif4 is essential for midzone formation and cytokinesis. Proceedings of the National Academy of Sciences of the United States of America. 2005; 102:343-348.
25. Li C, Lin M and Liu J. Identification of PRC1 as the p53 target gene uncovers a novel function of p53 in the regulation of cytokinesis. Oncogene. 2004; 23:9336-9347.
26. Mustacchi G, Sormani MP, Bruzzi P, Gennari A, Zanconati F, Bonifacio D, Monzoni A and Morandi L. Identification and validation of a new set of five genes for prediction of risk in early breast cancer. International journal of molecular sciences. 2013; 14:9686-9702.
27. Zeller T, Wild P, Szymczak S, Rotival M, Schillert A, Castagne R, Maouche S, Germain M, Lackner K, Rossmann H, Eleftheriadis M, Sinning CR, Schnabel RB, Lubos E, Mennerich D, Rust W, et al. Genetics and beyond--the transcriptome of human monocytes and disease susceptibility. PloS one. 2010; 5:e10693.
28. Hunter DJ, Kraft P, Jacobs KB, Cox DG, Yeager M, Hankinson SE, Wacholder S, Wang Z, Welch R, Hutchinson A, Wang J, Yu K, Chatterjee N, Orr N, Willett WC, Colditz GA, et al. A genome-wide association study identifies alleles in FGFR2 associated with risk of sporadic postmenopausal breast cancer. Nature genetics. 2007; 39:870-874.
29. Easton DF, Pooley KA, Dunning AM, Pharoah PD, Thompson D, Ballinger DG, Struewing JP, Morrison J, Field H, Luben R, Wareham N, Ahmed S, Healey CS, Bowman R, collaborators S, Meyer KB, et al. Genome-wide association study identifies novel breast cancer susceptibility loci. Nature. 2007; 447:1087-1093.
30. Udler MS, Meyer KB, Pooley KA, Karlins E, Struewing JP, Zhang J, Doody DR, MacArthur S, Tyrer J, Pharoah PD, Luben R, Bernstein L, Kolonel LN, Henderson BE, Le Marchand L, Ursin G, et al. FGFR2 variants and breast cancer risk: fine-scale mapping using African American studies and analysis of chromatin conformation. Human molecular genetics. 2009; 18:1692-1703.
31. Huo D, Zheng Y, Ogundiran TO, Adebamowo C, Nathanson KL, Domchek SM, Rebbeck TR, Simon MS, John EM, Hennis A, Nemesure B, Wu SY, Leske MC, Ambs S, Niu Q, Zhang J, et al. Evaluation of 19 susceptibility loci of breast cancer in women of African ancestry. Carcinogenesis. 2012; 33:835-840.
32. Parsa S, Ramasamy SK, De Langhe S, Gupte VV, Haigh JJ, Medina D and Bellusci S. Terminal end bud maintenance in mammary gland is dependent upon FGFR2b signaling. Developmental biology. 2008; 317:121-131.
33. Meyer KB, Maia AT, O’Reilly M, Teschendorff AE, Chin SF, Caldas C and Ponder BA. Allele-specific up-regulation of FGFR2 increases susceptibility to breast cancer. PLoS biology. 2008; 6:e108.
34. Purohit A and Reed MJ. Regulation of estrogen synthesis in postmenopausal women. Steroids. 2002; 67:979-983.
35. Key T, Appleby P, Barnes I and Reeves G. Endogenous sex hormones and breast cancer in postmenopausal women: reanalysis of nine prospective studies. Journal of the National Cancer Institute. 2002; 94:606-616.
36. Liu CL, Hu XP, Guo WD, Yang L, Dang J and Jiao HY. Case-control study on the fibroblast growth factor receptor 2 gene polymorphisms associated with breast cancer in chinese han women. Journal of breast cancer. 2013; 16:366-371.
37. Zhang B, Li Y, Li L, Chen M, Zhang C, Zuo XB, Zhou FS, Liang B, Zhu J, Li P, Huang ZL, Xuan H, Li W and Chen ZD. Association study of susceptibility loci with specific breast cancer subtypes in Chinese women. Breast cancer research and treatment. 2014; 146:503-514.
38. Palomba G, Loi A, Porcu E, Cossu A, Zara I, Budroni M, Dei M, Lai S, Mulas A, Olmeo N, Ionta MT, Atzori F, Cuccuru G, Pitzalis M, Zoledziewska M, Olla N, et al. Genome-wide association study of susceptibility loci for breast cancer in Sardinian population. BMC cancer. 2015; 15:383.
39. Fejerman L, Ahmadiyeh N, Hu D, Huntsman S, Beckman KB, Caswell JL, Tsung K, John EM, Torres-Mejia G and Carvajal-Carmona L. Genome-wide association study of breast cancer in Latinas identifies novel protective variants on 6q25. Nature communications. 2014; 5.
40. Haryono SJ, Datasena I, Santosa WB, Mulyarahardja R and Sari K. A pilot genome-wide association study of breast cancer susceptibility loci in Indonesia. Asian Pacific journal of cancer prevention. 2014; 16:2231-2235.