
INTRODUCTION
Determination of the half-maximal (50%) inhibitory concentration (IC50) is essential for understanding the pharmacological and biological characteristics of a chemotherapeutic agent [1, 2]. Since the invention of a colorimetric technique – the 3-(4,5-dimethylthiazol-2-yl)-2,5-diphenyltetrazolium bromide (MTT) assay – the process used for IC50 determination has become easier and can be performed in a 96-well plate [3–5]. In contrast to traditional methods for calculating percentages of killed cells, the MTT assay establishes the cytotoxicity of a compound based on decreases in intracellular NAD(P)H-dependent oxidoreductase activity [3, 4]. The initial status of living cells is defined by the optical densities (ODs) of the control wells, the mean of which is set to a survival rate of 100% (i.e., inhibitory rate of 0%). The concentration corresponding to a survival rate of 50% is defined as the IC50 [5]. However, the chromogenic product of MTT is insoluble and must therefore be solubilized prior to spectrophotometric analysis [3]. To avoid this step, several functionally identical tetrazolium dyes that produce soluble formazans, such as 3-(4,5-dimethylthiazol- 2-yl)-5-(3-carboxymethoxyphenyl)-2-(4-sulfophenyl)-2H- tetrazolium (MTS, also called “one-step” MTT) and “water-soluble tetrazolium salts” (WSTs, of which WST-8 is widely used and known as Cell Counting Kit 8 (CCK8)), have been developed [6, 7]. These analogues provide simplified protocols for IC50 measurements.
MTT and analogue assays have been used for 30 years in cancer research [3, 6, 7] but rarely yield a consistent IC50 value for a given chemical compound against a given cancer cell line. For example, 24-h cisplatin vs. SKOV-3 cells offers IC50 values ranging from 2 to 40 μM (Supplementary Materials and Methods S1, Supplementary Tables S1 and S2). This issue was initially attributed to differences among the manufacturers and formulae used by different laboratories. However, we later found that even within the same laboratory, the MTT and analogue assays produce variable IC50 values among different staff researchers and between different experimental repeats performed by the same researcher. Therefore, the degree of chemoresistance identified through an MTT assay by one laboratory may not be reproducible and should not be used to depict the pharmacological and biological traits of the cancer cell line [8–10]. We evaluated these differences and noted that control wells, which are used as a basis for the calculations of IC50 values, are not fixed but rather present substantial variations, and these variations depend on the initial cell seeding density and the proliferation potential of the cell line. Thus, we adopted several control well-free cell viability assays [propidium iodide (PI)-based apoptosis analyses and trypan blue-based cell counting] to re-measure IC50 data. However, these assays did not decrease the density-dependent IC50 variation, and this intrinsic chemoresistance instability of cancer cells prompted us to explore the underlying mechanisms and clinical implications of IC50 inconsistencies.
In this study, our primary aim was to quantify the density-dependent and density-independent IC50 errors caused by MTT analogue assays and to understand the major technical reasons for these errors. To provide precise and unbiased IC50 measurements, we developed a novel technique that employs a limiting dilution assay to objectively evaluate the chemoresponsiveness of cancer cells at different seeding densities. Our findings have not only revealed the uncorrectability of the deficiencies in MTT analogue assays but also clarified that the irregular density-dependent variation in chemoresistance is an inherent property of cancer cells. As a secondary aim, we investigated the intrinsic reasons behind the inherent density-dependent chemoresistance variations. The contributions of several well-known chemoresistance-related intracellular signaling pathways were analyzed, and we observed that the density-dependent variations in the intensities of some essential signaling components were correlated with the variations in the chemoresistance of cancer cells. The changing IC50 values could be calculated based on the expression levels of these essential components. Furthermore, we assessed the clinical significance of the in vitro findings. An in situ immunohistochemistry (IHC)-based evaluation tool, denoted the IHCpAkt+p62 scoring system, was established and used to predict the primary chemoresponsiveness of cancer patients and their long-term outcomes. Both the limiting dilution assay and the IHCpAkt+p62 scoring system achieved diagnostic efficacies superior to that of the MTT assay. The chemical compound and cancer system adopted in this study were cisplatin and ovarian cancer [note: cisplatin is a basic component of the first-line taxol-platinum (TP) chemotherapy for ovarian cancer patients]. The entire research strategy can also be used for exploring the density-dependent IC50 variations in other agents and cancer systems and for assessing the chemoresponsiveness of cancer patients based on the derived IHC signatures.
RESULTS
Current application of MTT and analogues (MTS and CCK8) for IC50 measurements: a literature review
Table 1 depicts the journals selected for our evaluation of the MTT, MTS and CCK8 assays. Of the 20,673 articles published in the past five years, 254 contained “MTT” “MTS” or “CCK8” in their titles and/or abstracts. Because other studies might have used MTT, MTS and CCK8 assays without mentioning this in the corresponding titles or abstracts, we searched five issues of Cancer Research and noted that 13.3–22.2% of the studies described the use of MTT, MTS, or CCK8 (Table 1). The examined articles also mentioned two additional colorimetric techniques [ATP and the sulforhodamine B (SRB) assays] [11, 12] (Table 1) and used the survival of untreated cells as the basis for estimating the IC50 values [11, 12]. From this perspective, 96-well colorimetric techniques were used in 20.7% (29/140) of the studies in the literature (Table 1). IC50 errors due to differences in the proliferation rates and/or enzyme activity of cancer cells were not mentioned in any articles. In addition, only 27.6% (8/29) of the manuscripts reported per-well seeding numbers (i.e., cell densities), and the other articles did not provide such information (Supplementary Table S5).
Table 1: Applications of MTT analogue assays (and ATP and SRB assays) reported by articles in six academic journals and in five randomly selected issues of Cancer Research Volume 73*
Assays |
BMC Cancer |
Cancer |
Cancer Research |
Clinical Cancer Research |
Cancer Letters |
International Journal of Cancer |
Cancer Research (Volume 73) |
||
|---|---|---|---|---|---|---|---|---|---|
Issue 1 |
Issues 9-10 |
Issues 17-18 |
|||||||
MTT |
199 (3.5) |
6 (0.2) |
4 (0.1) |
35 (0.9) |
27 (1.2) |
18 (0.5) |
8 (17.8) |
4 (8.9) |
7 (14.0) |
MTS |
23 (0.7) |
2 (0.06) |
1 (0.03) |
9 (0.2) |
1 (0.05) |
4 (0.1) |
1 (2.2) |
2 (4.4) |
3 (6.0) |
CCK8 |
2 (0.06) |
0 (0) |
0 (0) |
1 (0.03) |
2 (0.09) |
0 (0) |
1 (2.2) |
0 (0) |
0 (0) |
ATP |
- |
- |
- |
- |
- |
- |
0 (0) |
2 (4.4) |
0 (0) |
SRB |
- |
- |
- |
- |
- |
- |
0 (0) |
0 (0) |
1 (2.0) |
* The data are presented as the number of articles (%). a.n., total number of articles.
Different IC50 values (measured using the MTT assay) of cisplatin against ovarian cancer cells at different seeding densities
Five ovarian cancer cell lines (see “Materials and Methods”) were used to investigate the effects of seeding density on the MTT-measured IC50 values of cisplatin. The A2780DR cell line is a cisplatin-resistant variant of A2780 [13]. MTT data revealed similar IC50 patterns for the five cell lines tested, and the IC50 values were positively correlated with the seeding densities (Figure 1A). An interpretation of this observation can be linked to the monotonically elevated chemoresistance of cancer cells observed at higher seeding densities. We therefore compared the percentage of γH2A.X (a serine 139-phosphorylated version of H2A.X caused by DNA damage)-positive cells at different cell densities (Supplementary Materials and Methods S2 and Figure S1) [14] and found that the percentage of γH2A.X-positive cells exhibited variations at 24 h post-treatment. However, no corresponding monotonic decreases in the percentage of γH2A.X-positive cells were noted in any of the tested cell lines with the exception of A2780DR (Figure 1B and 1C). The potential density-dependent DNA-protective effect against cisplatin was thereby rejected. Nevertheless, modest but stable increases in the percentage of γH2A.X-positive cells were obtained for the controls at the highest seeding density (2,000 mm−2, Figure 1C), reflecting spontaneous apoptosis in over-dense culture conditions.
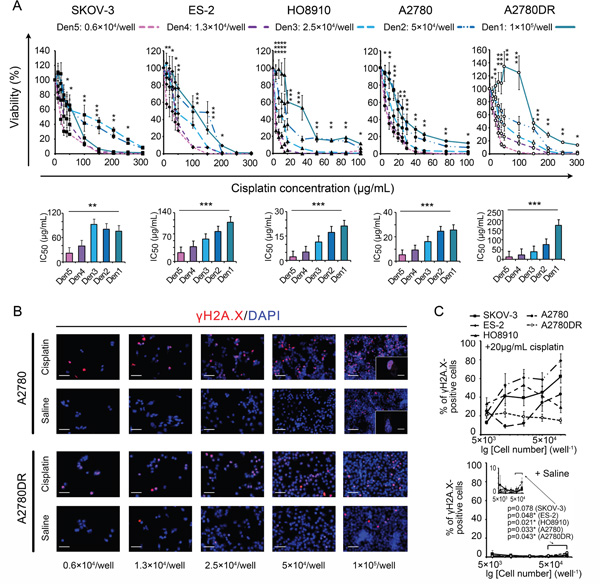
Figure 1: Comparisons of MTT assay-based dose-response curves at different seeding densities. A. Dose-response curves (upper panel) and corresponding IC50 values (lower panel). B. Representative cisplatin-induced DNA damage visualized by γH2A.X labelling under a confocal microscope (A2780 and A2780DR are provided as examples). Bars: 50 μm and 10 μm (inset). C. Percentage of γH2A.X-positive cells with rescaled inset to show the effect of crowding. *, p < 0.05; **, p < 0.01; ***, p < 0.001, ANOVA (A) and Student’s t-test (C).
Evaluation and analysis of MTT-dependent IC50 errors due to uneven proliferation and crowding-induced cell death
The 96-well colorimetric techniques use untreated (control) cells for assessing the initial numbers of treated cells. The control cell numbers change during the observation period, resulting in biases in the calculated IC50 values. We therefore recorded cell proliferation curves to estimate the IC50 errors. Both the curve obtained using the MTT assay and that obtained by cell counting included slow growth, accelerated growth, a plateau and a reduction in the MTT ODs or cell numbers (Figure 2A). However, the changes in the cell counting-based curves often appeared later than the changes in the MTT OD-based curves. When the cells were slowly increasing, this lag caused an accumulation of oxidoreductase activity (i.e., per-cell MTT OD) and thus defined a “cell content growth” period (Figure 2A and Supplementary Figure S1). At the cell reduction stage, sudden decreases in counts were noted within 24-48 h in over-dense cultures, reflecting cell crowding-induced death (Figure 2A). In accordance with data deduced from proliferation/growth curves, the measured proliferation/growth rate was elevated at lower seeding densities, decreased at moderate densities, and became negative at the highest densities (Figure 2B). These data were used to analyze MTT-dependent IC50 errors as follows:
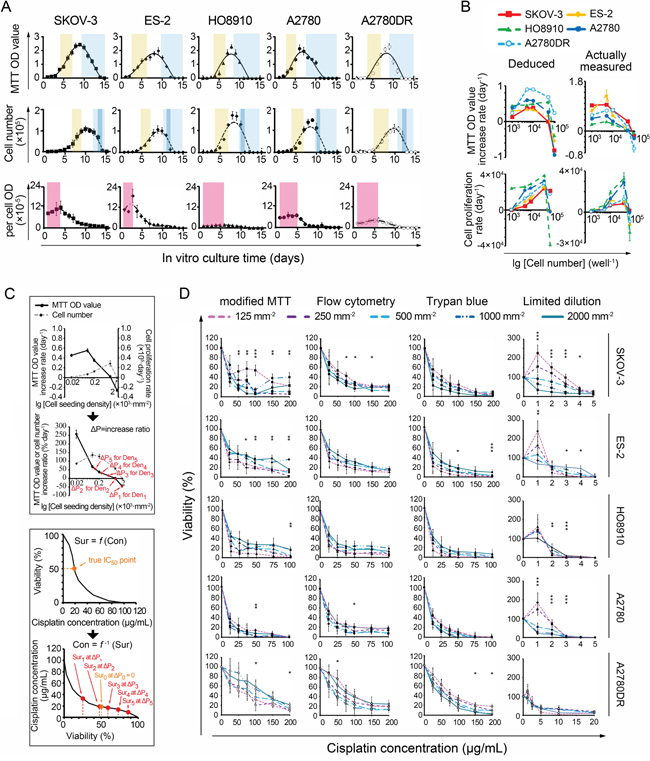
Figure 2: Relationship between IC50 values and cell seeding densities. A. Four stages of MTT- and cell counting-based proliferation curves. Light brown: accelerated growth; blue, reduction; dark blue, crowding-induced cell death; pink: oxidoreductase accumulation. B. Deduced and actual cell proliferation rate curves, presented in the forms of MTT ODs (upper panel) and cell numbers (lower panel), respectively. C. Theoretical analysis of IC50 errors (using A2780 as an example). D. Dose-response curves measured by modified and non-MTT IC50 assays. *, p < 0.05; **, p < 0.01, ANOVA. (Note, 1 mm−2 = 50 well−1 in cell number).
Assuming the relationship between the actual survival rate (Sur) and the concentration of the chemical compound (Con) can be expressed as Sur = f(Con); thus, if Sur = 0.5, Con(50) = f−1(0.5) (Equation 1), where Con(50) represents the IC50 value. Ideally, we set CON(50) as an unbiased IC50. For any initial seeding density Deni, the actual survival rate of the cancer cells examined can be expressed as Suri. If the 24-h MTT OD-based increase (daily proliferation rate × 1 day) in the ratio of control cells is ΔP (i.e., MTT OD increment/initial MTT OD, Figure 2C), then the actual Suri = 0.5(1+ΔP) at the time point when the MTT OD of the treated cells equals 50% of the value obtained for the control wells. According to Equation 1, Coni(50) = f−1(0.5(1+ΔP)), where Coni(50) is the apparent IC50. Based on pharmacodynamics, f is usually a monotonic decreasing function [1, 2] and so is f−1. Hence, if ΔP > 0 (e.g., at the slow or accelerated proliferation stage), Coni(50) < CON(50) = IC50. If ΔP < 0 (e.g., at the cell reduction or crowding-induced death stage), IC50 = CON(50) < Coni(50). Assuming that the MTT-measured IC50s at Den1-Den5 (Den1: 2,000 mm−2, Den2: 1,000 mm−2, Den3, 500 mm−2, Den4: 250 mm−2, Den5: 125 mm−2) are Con1(50)-Con5(50), respectively, according to the monotonic characteristic of ΔP (Figure 2C), the result is Con5(50) < Con4(50) < Con3(50) < Con2(50) < Con1(50), as illustrated in Figure 1A.
To reduce ΔP-induced errors, we set the non-cisplatin culture time to 24 h for the control and treated cells in a “modified” MTT assay. Thus, the cell numbers in control wells at the end of the 24-h observation period were equal to the actual numbers of treated cells at the beginning of the 24-h treatment period, and no ΔP would occur (i.e., ΔP = 0). However, the IC50 variations decreased but remained present (Figure 2D, Supplementary Table S6). Moreover, a viable cell counting-based analysis indicated that the per-cell MTT ODs varied significantly at different cisplatin concentrations, exhibiting a nonlinear relationship with cell viability. This variability yielded additional IC50 errors and induced more IC50 variations (Figure 3A). We subsequently performed two non-MTT assays, an FCM-based apoptosis analysis and a trypan blue-assisted cell-counting assay, to confirm the IC50 values. However, more inconsistencies in the IC50 values were obtained with these two non-MTT systems (Figure 2D, Supplementary Table S6). Microscopic observations revealed that some trypan blue-labeled cells were PI-negative and morphologically in either karyolysis or karyopyknosis (Figure 3B). Furthermore, all IC50 data obtained using these three techniques shifted left (decreased) as the intervals between the points of cisplatin withdrawal and the cell-viability measurement were extended, complicating the IC50 value calculations (Figure 3C).
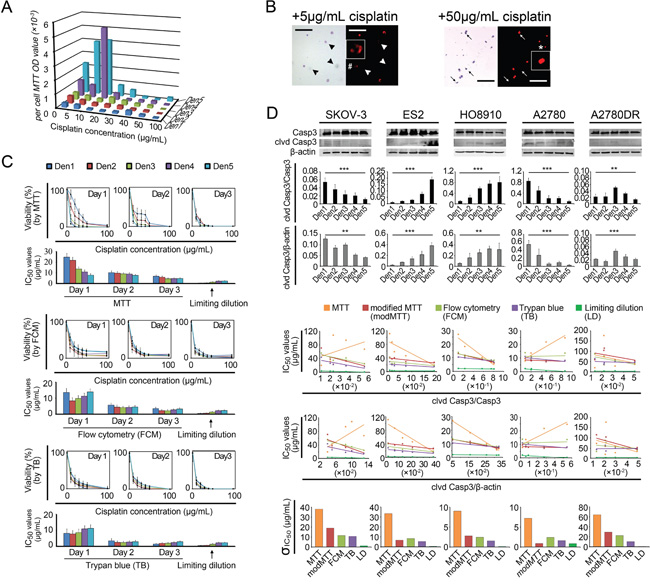
Figure 3: IC50 measurement biases. A. Per-cell MTT ODs measured at different cisplatin concentrations and seeding densities. B. Comparison of PI and Trypan blue labeling efficacies. Arrowhead and arrow, PI-negative dead cells. #, karyolysis. *, karyopyknosis. Bar: 200 μm. Inset, 4 × magnification. C. Left shift in the IC50 value as the non-cisplatin interval was elongated (using A2780 as an example). D. Regression analysis between cleaved caspase-3 (clvd Casp3) and IC50. Each point shown in rows 4-5 represents a mean IC50 value provided by a specific detection method; the standard deviations (σ) are shown in row 6. *, p < 0.05; **, p < 0.01; ***, p < 0.001, ANOVA (D rows 2-3) and Pearson’s correlation analysis (D rows 4-5, see Supplementary Table S7).
Hence, we used a fourth test, the limiting dilution assay. This technique provides a direct count of the cells surviving after cisplatin treatment (Supplementary Materials and Methods S2). The IC50 values measured using this assay were significantly lower than those obtained with the previous three assays, even though the inherent density-related variations persisted (Figure 3C). We examined these variations using ratios of cleaved caspase-3/caspase-3 and/or cleaved caspase-3/β-actin (i.e., normalized cleaved caspase-3) obtained through Western blot assays and observed inter-density differences in the cleaved caspase-3 bands (Figure 3D). The linear regression analysis indicated that the cleaved caspase-3/caspase-3 ratios were inversely correlated with the IC50 variations for most (SKOV-3, ES-2, HO8910, and A2780DR) of the cell lines tested (Figure 3D and Supplementary Tables S7). These inherent chemoresistance variations substantially contributed to the irregular inter-cell-line IC50 relationships. The order of the IC50 values for the five cell lines varied depending on the seeding density. For example, SKOV-3, a well-known chemoresistant ovarian cancer cell line, presented chemosensitivity (IC50 values similar to those of A2780) at higher seeding densities (1,000–2,000 mm-2) and chemoresistance (approximating the IC50 values of A2780DR) at lower densities (125-500 mm-2), yielding a 6.5-fold change in the IC50 values (Supplementary Table S6 and Figure S2).
Multi-dimensional exploration of potential mechanisms underlying density-dependent chemoresistance
To understand the mechanism underlying density-dependent cancer cell chemoresistance against cisplatin, we recorded the cell-cycle patterns at different seeding densities because chemotherapeutic agents are primarily effective against proliferating cells [15]. The FCM analysis showed that the fractions of cells in the G1 and S phases increased and decreased with increasing seeding densities, respectively, whereas no definite patterns were discernible for cells in the G2-M phase (Figure 4A). After cisplatin treatment, the fractions of cells in the G1 and G2-M phases were significantly diminished, whereas the relative fractions of cells in the S phase were slightly decreased or increased (Figure 4B). However, the comparison of the fractions of cells prior to treatment with their corresponding IC50 values revealed a significant negative linear correlation, which could support the cell cycle-based theory, only in ES-2 (S-phase fraction vs. IC50, Figure 4C). These findings suggest that the proliferation status (e.g., fractions of cells in the S and G2-M phases) minimally influences the density-dependent chemoresistant behavior.
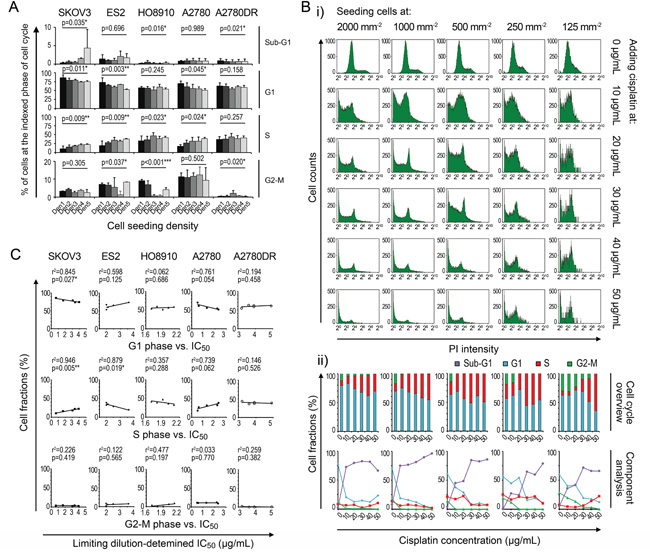
Figure 4: Cell cycle contribution to variation in IC50 data. A. Density-related cell cycle patterns. B. Cisplatin-induced changes in the cell cycle (using A2780 as an example). C. Linear regression analysis between cell cycle and IC50. *, p < 0.05. **, p < 0.01. ***, p < 0.001, ANOVA (A) and Pearson’s correlation analysis (C).
We then analyzed the contributions of several well-known chemoresistance-related signaling pathways, specifically cell-adherence molecules (E-cadherin, N-cadherin, and β-catenin), PI3K-related kinases (pAkt/Akt), apoptosis-related molecules (p-Bad/Bad, Bax, and Bcl-2), cyclin-dependent protein (p27), autophagy-related molecules (LC3b and p62) and gap junction (connexin43)-related pathways [16–27], to the density-dependent IC50 variation for cisplatin in ovarian cancer cells (Supplementary Table S8). For our correlation analyses, fitting models for the cleaved caspase-3 ratios, IC50 values and seeding densities were established (Supplementary Materials and Methods S2). The cleaved caspase-3/caspase-3 ratios yielded better fits to IC50 values in terms of p-values than the normalized cleaved caspase-3 value (Figure 5A). The Western blot assay indicated that basic and density-related expression patterns of each component varied greatly among the cell lines, suggesting the diversity of IC50 behaviors (Figure 5B). The multivariate regression analysis indicated that each cell line had a characteristic formula with different necessary components for fitting the cleaved caspase-3 ratios. However, some components, specifically p62 (four times), pAkt (three times), Akt (twice), β-catenin (twice), Bad (twice), and Bcl2 (twice), were applied multiple times, indicating their critical roles in density-dependent chemoresistance (Figure 5B and 5C).
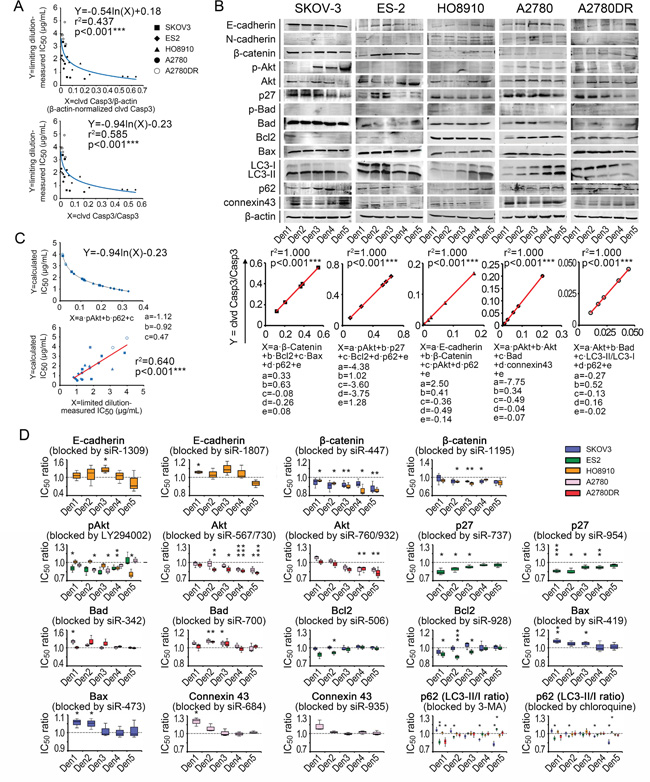
Figure 5: Chemoresistance-related signaling pathway contributions to variation in IC50 data. A. IC50-fitting models based on cleaved caspase-3. B. Density-related expression patterns of signaling components and fitting formulae. C. General IC50-fitting formula and validation of its efficacy. D. In vitro analysis of functions of pathway components in chemoresistance variation. *, p < 0.05. **, p < 0.01. ***, p < 0.001, Pearson’s correlation analysis (A–C) and Student’s t-test (D).
Because regression analyses could only reveal superficial relationships between the pathway components and IC50 values of cisplatin, we explored the actual roles of each contributing component. After the administration of siRNAs and small-molecule inhibitors (see Supplementary Table S8 and Figure S3), we demonstrated that β-catenin was able to suppress cisplatin-induced apoptosis in SKOV-3 and HO8910 cells but could not improve chemosensitivity, as the fitting models suggested. This finding also applied to p27 in ES-2, Akt in A2780 and Bad in A2780DR (Figure 5D). In contrast, the accumulation of connexin43 promoted cisplatin-induced apoptosis in A2780 cells, which is the inverse of its role in the fitting formula (Figure 5D). In the cell lines examined, p62 protein was protective against cisplatin at higher pretreatment levels and exerted a cisplatin-sensitizing effect at lower pretreatment levels (Figure 5D). Using these data, we eventually obtained a general IC50-fitting formula, in which pAkt and p62 were necessary components, for all five cell lines tested (Figure 5C). The fitting roles of pAkt and p62 were consistent with their functions (Figure 5D) and consistent with the measured IC50 values for the five cell lines (p < 0.001, ANOVA, Figure 5C; note that the inter-cell-line pAkt and p62 levels were compared after β-actin-based normalization).
Clinical implications of density-dependent variations in the IC50 values of cisplatin in patients with ovarian cancer
Our data suggest that the MTT assay might not be suitable for IC50 measurements and that irregular density-dependent chemoresistance variations of cancer cells are important to consider. Additionally, the use of an intracellular signaling pathway analysis of pAkt and p62 for assessing chemoresponsiveness is worth scrutiny. Cisplatin is a first-line treatment for ovarian cancer; thus, we enrolled 112 ovarian cancer subjects treated with TP chemotherapy, studied their chemoresistant recurrence behaviors and correlated these to cancer cell densities (for clinicopathological characteristics, see Supplementary Table S9).
We first assessed the effect of cancer cell density on patient survival. The observed densities of cancer cells ranged from 2.3 × 103 mm−2 to 1.3 × 104 mm−2 (mean: 6.5 × 103 mm−2, SD: 2.2 × 103 mm−2, Figures 6A and 6B), much greater than the maximal density mimicked in 96-well plates (i.e., 2 × 103 mm−2). Low-density areas were mostly observed in cancer tissue with an abundance of cystic space or at the border where the cancer nest invades into the surrounding normal tissue. Based on the median density (6.6 × 103 mm−2), patients were classified as high- or low-density, and no differences in five-year progression-free survival (PFS) or overall survival (OS) were noted (Figure 6C), implying an irregular relationship between cancer cell densities and IC50 values in vivo. We then established an IHCpAkt+p62 scoring system for assessing the chemoresponsiveness of cancer cells individually (Supplementary Table S4). As expected, the IHCpAkt+p62 scores did not correlate with cell densities, reinforcing the existence of an irregular relationship between cancer cell density and chemoresistance (Figure 6D). However, when patients were divided into poor (≤ 5 years) and extended (> 5 years) survival groups, poor survival was linked to greater IHCpAkt+p62 scores (Figure 6D). Patients with an IHCpAkt+p62 score greater than 3 (median = 3) experienced impaired PFS and OS compared with patients with a score less than or equal to 3 (Figure 6E).
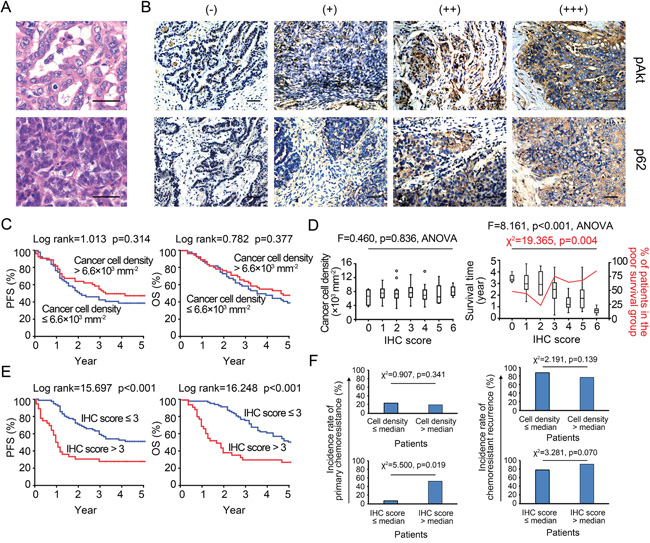
Figure 6: IHCpAkt+p62 scoring and survival analysis. A. Representative microscopic images of density variations in cancer cells among specimens. Bar: 50 μm. B. IHCpAkt+p62 scoring system. Bar: 50 μm. C. Kaplan-Meier analysis (high vs. low density). D. Relationships among cancer cell density, survival and IHCpAkt+p62 scores in 112 retrospectively enrolled ovarian cancer patients. E. Kaplan-Meier analysis (high vs. low IHCpAkt+p62 scores). F. Incidence rates of primary chemoresistance and chemoresistant recurrence in patients with different cancer cell densities and IHCpAkt+p62 scores.
Moreover, an analysis of patients with IHCpAkt+p62 scores greater than 3 revealed that these patients suffered a significantly higher incidence rate of primary chemoresistance (for the definition, see Supplementary Materials and Methods S2) after a standard course of post-surgical TP chemotherapy (Figure 6F); additionally, more chemoresistance events were observed when TP chemotherapy was re-applied to the recurrence sites in this group (Figure 6F). Chemoresistant recurrence (for the definition, see Supplementary Materials and Methods S2) occurred mainly in the form of remote metastases (liver, spleen, and lung) in low-density cases with IHCpAkt+p62 scores greater than 3, whereas in situ (peritoneal) cancer recurrence was more frequently found in high-density cases (Supplementary Figure S4). Multivariate analyses of a panel of clinical (e.g., stage, histotype, grade, metastatic status, and residual site) and microenvironmental factors (e.g., stromal cell, M1/M2 macrophage, and CD4+/8+ T cell densities) indicated that the IHCpAkt+p62 score is an independent predictor of long-term survival (PFS and OS) and density-related recurrence patterns (“in situ” and “remote”) in our set of 112 retrospective cases (Supplementary Tables S10-S12).
We then focused on density-dependent chemoresistance variations within each cancer specimen. The intra-specimen relationship between cancer cell densities and IHCpAkt+p62 scores was characterized by a linear fitting formula, where the coefficient “a” indicates the trend obtained for the changes in the density-dependent IC50 values (Supplementary Figure S5A). The patients were divided into two groups: a ≤ 0 (i.e., the local IHCpAkt+p62 score increased as the cancer cell density increased) and a > 0 (i.e., the local IHCpAkt+p62 score decreased as the cancer cell density increased). Although the chemoresistant cases (IHCpAkt+p62 score > 3) were fairly evenly distributed between the low- and high-density groups (Supplementary Figure S5B), we found that those with an “a” value ≤ 0 were more frequent in the low-density group and that those with an “a” value > 0 were more frequent in the high-density group, and this difference was statistically significant (Supplementary Figures S5C and S5D). Moreover, similar to the cancer recurrence patterns observed in the patients classified to the low- and high-density groups (Supplementary Figure S4 and S5E), the highest rate of in situ (intraperitoneal) chemoresistant recurrence occurred in patients with “a” values > 0 and an IHCpAkt+p62 score > 3, and the greatest rate of remote metastasis occurred in patients with “a” values ≤ 0 and an IHCpAkt+p62 score > 3 (Supplementary Figure S5F).
Direct chemosensitivity cannot be measured in paraffin-embedded specimens, and IC50 data are unavailable in retrospective cohort studies. As a result, we enrolled 35 newly diagnosed ovarian cancer subjects (for patient characteristics, see Supplementary Table S13). Primary ovarian cancer cell lines were constructed using isolated cancer cells from patient tumors. Both MTT and limiting dilution assays were performed with each primary cancer cell line at multiple seeding densities (i.e., Den1 -Den5). The observed IC50 values varied with the cell density (Figure 7A), and the respective IC50 spectra measured using the MTT assay (MTT-IC50) and the limiting dilution assay (LD-IC50) were significantly different across the tested cell lines (Figure 7A and Supplementary Figures S6A – S6C). These differences in IC50 measurements followed a similar pattern to the MTT vs. limiting dilution assay differences observed across five established ovarian cancer cell lines (Figure 3C). To compare the use of MTT-IC50 and LD-IC50 spectra for predicting primary chemoresistance against TP chemotherapy, we used two strategies. First, the prognostic values of each IC50 at a given seeding density were analyzed. Next, only the prognostic values of the maximal IC50 values within a seeding density spectrum were analyzed. The data indicated that when the maximum LD-IC50 was considered predictive, the greatest area under the ROC curve for primary chemoresistance was obtained (Figure 7B). In contrast, neither the maximal MTT-IC50 nor individual IC50 values at any given seeding density offered satisfactory diagnostic efficacy (Figure 7B). At the maximal Youden's index (Table 2), the sensitivity and specificity of the maximal LD-IC50 for predicting primary chemoresistance were excellent; however, the maximal Youden's indices for the maximal MTT-IC50 and individual IC50 values yielded insufficient sensitivity and specificity compared with that of the maximal LD-IC50 (Table 2).
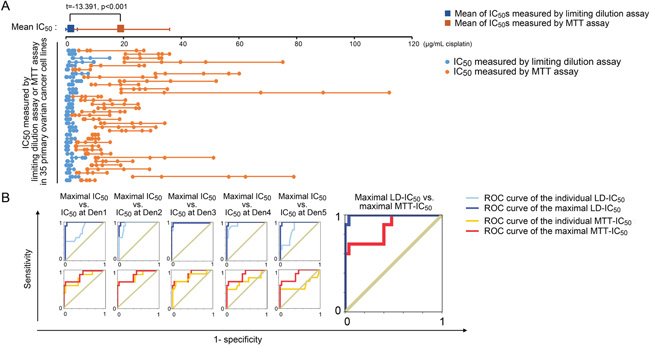
Figure 7: Clinical implications of MTT-IC50 and LD-IC50. A. Comparison between MTT-IC50 and LD-IC50 spectra in 35 primary ovarian cancer cell lines (Student’s t-test). IC50 values were measured at five seeding densities and are points in each IC50 spectrum line. B. ROC curves of the maximal and individual MTT-IC50 values and LD-IC50 values. The ROCs of the maximal IC50 values were serially compared with the ROCs of each individual IC50 value obtained with each measurement system. The ROCs of the maximal IC50 were compared between the MTT and limiting dilution assays.
Finally, using primary ovarian cancer cell lines, we re-examined the IHCpAkt+p62 scoring system for predicting primary chemoresistance and inherent density-dependent variations in the ovarian cancer subjects (i.e., the 35 newly diagnosed). A Pearson’s correlation coefficient for the maximal LD-IC50 and IHCpAkt+p62 scores indicated that the IHCpAkt+p62 scores were associated with chemoresistance (Supplementary Figure S6D). We then re-calculated the “a” values (aLDs) of the LD-IC50 values for each primary cell line in a similar manner to that used for values obtained with the IHCpAkt+p62 scoring system (Supplementary Figures S5A and S6B-S6C). A qualitative comparison between the IHC-determined “a” value (aIHC) and aLD returned a κ coefficient of 0.598, supporting the consistency between the two methods (Supplementary Figure S6E). However, subsequent quantitative comparisons suggested that the IHCpAkt+p62 scoring system is more suitable for qualitative measurements of density-dependent chemoresistance variations in specimens (for aLD vs. aIHC, r2 = 0.096, p = 0.074, Pearson’s correlation coefficient analysis, Supplementary Figure S6F).
DISCUSSION
This study revealed that MTT analogue assays have been prevalently (used in approximately 20% of studies) adopted by the modern cancer research community (Table 1). However, the IC50 errors (i.e., for cisplatin) caused by MTT assays are large and not adjustable (range: 300–11,000%, Figure 3C and Supplementary Tables S6). Moreover, we confirmed that the density-dependent variation in IC50 values for cisplatin is a bona fide natural trait of cancer cells (Figure 2D and 3D). We observed that the behavior of a cancer cell line can vary between chemoresistant and chemosensitive in an unpredictable manner (Supplementary Figure S2) and showed that the expression and modification (e.g., phosphorylation) of intracellular signaling pathways present variations depending on the seeding densities (Figure 5B). Most importantly, the general fitting formula indicates that the density-dependent chemoresistance against cisplatin in ovarian cancer can be estimated using two essential contributing components, specifically pAkt and p62, which allowed us to establish an IHCpAkt+p62 scoring system (Figure 6A). The findings from clinical investigations prove the practicality of the limiting dilution assay and the IHCpAkt+p62 scoring system for estimating chemoresistance in ovarian cancer (Figures 6 and 7).
Our in vitro data indicate three major deficiencies of MTT analogue assays. First, uneven proliferation control can cause systemic errors in IC50 measurements (in a broad sense, including all 96-well colorimetric techniques, Figure 2C). Second, irregular changes in oxidoreductase activity can produce a non-linear relationship between MTT ODs and cell viability (Figure 3A), and third, a lack of synchronicity between mitochondrial oxidoreductase decay and cell death can yield artificial elevations in IC50 values (Figure 3C). Originally, the MTT assay was not intended for the measurement of IC50 values but rather to assess cell viability and metabolic changes in response to exogenous treatment (e.g., lipopolysaccharide, concanavalin A, interleukin 2 and complements) [3]. No linearity was established between MTT ODs and cell viability as external agents were added. In contrast, the innovators suggested that with the administration of certain agents, the per-cell MTT ODs may vary up to seven- or eight-fold [3]. Therefore, this assay was inappropriately adopted for IC50 measurements [28]. Among the three deficiencies we identified, the systematic IC50 errors caused by uneven proliferation/growth were the most significant in terms of their misleading effects. The purpose of IC50 measurements is to identify the dose required for a chemotherapeutic agent to kill 50% of a cell population with a definite initial number of cells. However, in MTT analogue assays, this idea is interpreted as the dose required to inhibit (or kill) 50% of a cell population with an uncertain or changing initial cell number (Figure 2A). Because the ΔP constantly varies, the MTT-measured IC50 values will inevitably change (Figure 2B and 2C). Although surrogate techniques, such as FCM- and cell counting-based IC50 assays can avert the “control-well” effect, PI and trypan blue labeling are not in synchrony with cancer cell death (Figure 3C). In most indirect viability assays (including the ATP and SRB assays), normal cell activities, such as oxidoreduction, membrane impermeability and ATP synthesis, always cease after a lethal genomic impairment. Therefore, IC50 errors are unavoidable. Only the limiting dilution assay, as a direct viability test, ensures that the obtained IC50 data closely approximate actual cancer cell survival (Figure 3D). This technique may be more broadly applied, whereas the MTT and its analogue assays need be restricted to the comparison of cancer cell chemoresponsiveness under identical drug-concentrations, seeding densities and culture conditions. Even then, these assays may not provide an accurate IC50 value (Figure 3D and 7A).
The inherent density-dependent variation in IC50 values for cisplatin has also been described previously [27, 29, 30], but the data are contradictory. For example, Dimanche-Boitrel’s group reported the HT29 colon cancer cells exhibit confluence-induced cisplatin-resistant behavior, whereas Jensen’s [27] and Fan’s groups [30] suggested that the cisplatin sensitivity of two other mammalian cancer cell lines is significantly improved at confluence. Our data, which were derived after eliminating MTT artifacts and using multiple cell lines, indicate that density-dependent chemoresistance varies with density gradients (ES-2/HO8910), against them (SKOV-3/A2780), or bidirectionally (A2780DR). This manuscript may represent the most inclusive description of this issue to date. Regarding the underlying mechanisms, Dimanche-Boitrel’s [29] and Itamochi’s groups [31] proposed that an increased number of resting (non-proliferating) cells may contribute to elevated chemoresistance at higher seeding densities. However, although our FCM analysis supports the hypothesis that dividing cells (G2-M phase) are major targets of cisplatin [32–34], we could not verify that the cell cycle plays a central role in the density-dependent variation in IC50 values (Figure 4B and 4C). Wu’s group explained this phenomenon from the perspective of density-related apoptosis and autophagy [35]. Similarly, we examined intracellular signaling pathways linked to apoptosis (Bcl2, Bad, and Bax) and/or autophagy (LC3 and p62), both directly and indirectly (cell-adherent molecules, pAkt/Akt, p27, and Cx43), and found unpredictability with respect to the activities of these pathways and cell densities. These data oppose the findings reported by Wu and colleagues [35]. The apoptotic and autophagic pathways analyzed in the present study are also frequently mentioned in the literature as critical modulators of chemoresistance but have yet to be incorporated into a unified system for quantitative analysis [16–27]. The regression analyses applied in this study serve as a mathematical tool that bridges the components and IC50 variations in the cancer cell lines tested. The ratios of cleaved caspase-3/caspase-3 and cleaved caspase-3/β-actin acquired statistical significance in the general fitting models (Figure 5A), although the former was superior, suggesting that the activation of caspase-3 is more indicative of chemosensitivity. The obtained density-related IC50-fitting formula was concise and involved two elements, pAkt and p62 (Figure 5B and 5C). pAkt is known to be important in the PI3K pathway, which is responsible for cell proliferation and anti-apoptotic activity [36], whereas p62 is a key indicator of autophagy that functions in protein clearance, NF-κB signaling, and programmed cell death [26, 37–41]. The roles of pAkt and p62 and the consistency between their functions and mathematical formulae reinforce the importance of density-dependent apoptotic/autophagic pathways in the observed variations in chemoresistance.
The significance of the clinical investigations performed using 112 retrospective and 35 prospective cases is that they provided a broader platform to expose the disadvantages of MTT assays. Furthermore, the clinical data support the use of a direct cell viability test, specifically the limiting dilution assay, and its derivative, the IHCpAkt+p62 scoring system, for assessing chemoresponsiveness in ovarian cancer patients. The aberrantly high IC50 values obtained with MTT assays and their inability to gauge chemoresistance in cancer patients (Figure 7A and 7B) confirm that hysteretic oxidoreductase decay artificially elevates the IC50 values and that the uneven proliferation/growth of control cells yields profound systemic IC50 errors (Figure 2C and 3C). Therefore, MTT-derived IC50 values cannot be used as an in vitro predictive index for optimized/personalized chemotherapy. Nevertheless, it is worth noting that even among LD-IC50 values, only the maximal IC50 of an IC50 spectrum rather than individual IC50 values at different seeding densities offers satisfactory predictive efficacy (Figure 7B). This effect might be explained by the evolution theory of cancer [42, 43]. If density-dependent variation in chemoresistance promotes adaptive evolution, cancer cells will spontaneously attain their optimal density to achieve the greatest resistance against chemo-selective pressure. This adaptability is rooted in the nature of cancer cells and cannot be pre-configured by the observer. In other words, a fixed density cannot be used to measure maximal IC50 values, and the best method involves probing the density-dependent IC50 spectrum. There are limitations to using LD-IC50 data. First, we cannot currently mimic a cancer cell density greater than 2,000 mm-2, a density that is frequently observed in clinically collected specimens (Figure 6A), under in vitro culture conditions (Figure 2A and Supplementary Figure S1). Second, physiological elements, such as pH, pO2 and pCO2 [44–46], that can cause IC50 variations have not been taken into account in the present version of the “limiting dilution assay”, and these might contribute to biases from mimicking real in vivo conditions. Nevertheless, these limitations do not appear to fundamentally influence the accuracy of the limiting dilution assay for predicting the chemoresponsiveness of enrolled patients. Youden’s index of the selected parameter, the maximal LD-IC50, was satisfactory for predicting primary chemoresistance (Figure 7B and Table 2).
Table 2: Diagnostic performance of MTT-IC50 values and LD-IC50 values for predicting primary chemoresistance in 35 newly diagnosed ovarian cancer patients
Indexes |
Area under the ROC curve |
Youden’s indexmax |
Sensitivity* |
Specificity* |
PPV* |
NPV* |
|---|---|---|---|---|---|---|
MTT assay: |
||||||
IC50 at Den1 |
0.808 |
0.56 |
0.60 |
0.96 |
0.86 |
0.86 |
IC50 at Den2 |
0.848 |
0.70 |
0.70 |
1.00 |
1.00 |
0.89 |
IC50 at Den3 |
0.814 |
0.62 |
0.70 |
0.92 |
0.78 |
0.88 |
IC50 at Den4 |
0.708 |
0.50 |
0.50 |
1.00 |
1.00 |
0.83 |
IC50 at Den5 |
0.592 |
0.50 |
0.50 |
1.00 |
1.00 |
0.83 |
Maximum IC50 |
0.868 |
0.66 |
0.70 |
0.96 |
0.88 |
0.89 |
Limiting dilution assay: |
||||||
IC50 at Den1 |
0.796 |
0.48 |
1.00 |
0.48 |
0.43 |
1.00 |
IC50 at Den2 |
0.952 |
0.84 |
1.00 |
0.84 |
0.71 |
1.00 |
IC50 at Den3 |
0.992 |
0.96 |
1.00 |
0.96 |
0.91 |
1.00 |
IC50 at Den4 |
0.956 |
0.72 |
1.00 |
0.72 |
0.59 |
1.00 |
IC50 at Den5 |
0.818 |
0.64 |
1.00 |
0.64 |
0.53 |
1.00 |
Maximum IC50 |
0.996 |
0.96 |
1.00 |
0.96 |
0.91 |
1.00 |
* These parameters were calculated as the maximal Youden’s index was reached. PPV, positive predictive value. NPV, negative predictive value.
The IHCpAkt+p62 scoring system established in this study is based on the fact that cleaved caspase-3/caspase-3 ratios can substitute for LD-derived IC50 for assessing cancer cell chemoresistance against cisplatin (Figure 5A and 5B). Although this scoring system cannot pinpoint one IC50 value (Figure 7), it serves as a proxy for measuring chemoresistance that bypasses the tedious steps of living cancer cell isolation and building primary cancer cell lines for “tumor chemosensitivity tests”. The statistical consistencies between IHCpAkt+p62 scores and maximal LD-derived IC50 values and between aIHC and aLD (Supplementary Figures S6D and S6E) suggest that pAkt and p62 are located at signaling convergence points that give rise to various density-dependent IC50 patterns in most ovarian cancer cases. The mechanism underlying the distinct patient outcomes of the two intra-specimen chemoresistance variation forms (“a” ≤ 0 vs. “a” > 0) might be similarly attributed to cancer evolution. For example, in the “a” ≤ 0 condition, because only decreased growth density offers additional protection, cancer cells disseminating into the lymph and blood vessels and/or remote organs might most benefit from chemo-selection pressure. In contrast, under the “a” > 0 condition, cells remaining in situ and growing densely might best survive cisplatin treatment. Additionally, for most chemoresistant cases, the cancer recurrences in patients with low cancer cell densities were similar to those with an “a” value ≤ 0, and the rates of cancer recurrences in patients with high cancer cell densities were similar to those with an “a” > 0 (Supplementary Figures S5E and S5F). Under the same evolution theory, adaptive survival might be occurring, and cancer cell density heterogeneity might provide a competitive advantage. Thus, if the patient has a remote metastasis, it might be chemoresistant under low cell density, and if the recurrence is in situ, it might be chemoresistant under high-density conditions. An additional emphasis for users of the IHCpAkt+p62 scoring system is that, in a few cases, e.g., caspase-3 mutations or the existence of inhibitors of apoptotic proteins (IAPs), the cleaved caspase-3/caspase-3 ratios could be uncoupled from the IC50 values [47, 48]. Then, chemoresistant cases would have IHCpAkt+p62 scores ≤ 3. The pre-screening of caspase-3 mutations or inhibitors of apoptotic proteins might favor a reliable evaluation with this system.
Notably, although the MTT-dependent IC50 errors analyzed in this study were focused on the system consisting of cisplatin and ovarian cancer, the obtained knowledge concerning the reasons for the inconsistency in IC50 values is of practical importance for many other chemotherapeutic agents and cancer systems. Indeed, regardless of the agents or cancer cell lines involved, the uneven proliferation of the control cells at different seeding densities (i.e., ΔP variation) will definitely yield systemic errors in IC50 measurements because all of the MTT analogue assays rely on the OD reads from the control cells for the IC50 calculations [49, 50]. Moreover, regardless of the speed at which a chemotherapeutic agent kills cancer cells, the delayed response of the cellular metabolic system (i.e., the oxidoreductase system) to agent-induced cell death will definitely produce an artificially elevated IC50 value, unless this cell death is accompanied by an immediate quenching of the oxidoreductase activity. More importantly, the intracellular signaling pathways analyzed for explaining the density-dependent variation in chemoresistance have also been verified by previous studies as effective targets of other agents. For example, the PI3 kinase/Akt signaling pathway is capable of diminishing the taxol-induced apoptosis of ovarian cancer cells [51], and p62 accumulation can confer endometrial cancer cells with increased resistance to oxidative stress and is associated with poor prognosis [52]. Using taxol as a study subject, similar findings (i.e., biased and artificially elevated IC50 values) were obtained (data not shown). Therefore, although the exact forms of density-dependent chemoresistance and the detailed characteristics of the inconsistences in IC50 data can differ between agents and cancer systems, the technical deficiencies of MTT assays that we have identified and the concept of a density-dependent IC50 spectrum possess broad applications in biomedical and pharmacological research areas. The logical deduction system and IC50 evaluation criteria we developed for exploring the true chemoresponsiveness of ovarian cancer cells to cisplatin are also tenable for millions of combinations of other agents and cancer cell lines. Nevertheless, some more specific IHC signatures might be developed for optimizing in situ chemoresistance evaluations in new investigational settings.
In summary, this study offers a paradigm for analyzing density-dependent variations in IC50 values (particularly for cisplatin) in cancer cells and reveals the underlying mechanisms and practical implications of these phenomena. Because artifacts of MTT analogue assays and inherent variations in chemoresistance are unavoidable, the methods that are currently used to evaluate the literature should be changed. Researchers and clinicians should determine whether a reported chemoresistance or anticancer mechanism remains accurate for one density condition when it was obtained using cells at another density. Moreover, direct cell viability tests (e.g., limiting dilution or colony formation assays) should be used. Cells grown at unstable densities should not be used as a control when calculating an IC50 value. Researchers should be aware that if any factor (e.g., a gene) alters the proliferative rate of the control cells, even if it has no effect on chemoresistance, the apparent IC50 value will be altered (Figure 2C, note that the initial number of control cells is fixed using the process of serial dilution and colony counting in the limiting dilution assay). Previously, Haibe-Kains’s group suggested the establishment of an international standard for assigning a definite IC50 to each cancer cell line [10, 53] and found that different IC50 detection systems generate severe and irreconcilable contradictions in IC50 data between large-scale international pharmacogenomic studies involving hundreds and thousands of cancer cell lines [8, 9]. Based on our findings, we hold the same opinion and propose that inconsistencies in IC50 values are a natural property of cancer cells rather than a remediable artifact. Therefore, a dynamic view of IC50 values and the methods used to detect the density-dependent IC50 spectrum of a cancer cell line (primary or passaged) must be established. This view will benefit patients and the cancer research community as a whole.
MATERIALS AND METHODS
Literature review
A search of PubMed for eligible research articles published between Nov. 11, 2009 and Nov. 10, 2014 in six cancer research journals (see “Results”) was performed using the keywords “MTT”, “MTS” or “CCK8”. The results were manually screened to exclude similar acronyms but different meanings. Five issues of Volume 73 of “Cancer Research” were selected by drawing lots. Each research article was reviewed to identify the chemosensitivity-testing methods used.
Clinical samples
Ovarian cancer specimens from patients diagnosed between January 1, 2002 and December 31, 2008 were collected from Ren Ji Hospital, School of Medicine, Shanghai Jiao Tong University, Shanghai, China. Additionally, patients diagnosed with stage II-IV ovarian cancer between July 1, 2014 and December 31, 2014 at Ren Ji Hospital and Obstetrics and Gynecology Hospital (School of Medicine, Fudan University, Shanghai, China) were enrolled. Surgical samples were collected for to obtain living cancer cells. Informed consent was obtained from each patient or their first-degree relatives. All patients received standardized post-surgical cisplatin-based (i.e., TP) chemotherapy. The medical records of each patient were carefully analyzed (Supplementary Materials and Methods S2). The research protocol was approved by the ethics committee of Ren Ji Hospital.
Cell culture
The SKOV-3, ES-2, HO8910, and A2780 ovarian cancer cell lines were purchased from the Cell Resource Center, Shanghai Institute of Life Sciences, Chinese Academy of Sciences (Shanghai, China) or American Type Culture Collection (ATCC, Manassas, VA, USA) with short tandem repeat-based authentications. The A2780DR cell lines was a gift from Dr. Yinhua Yu (MD Anderson Cancer Center, Houston, TX, USA). Time- and density-dependent cell proliferation curves were obtained based on day-to-day MTT assay/fixation and the density gradient-seeding method, respectively. Cancer tissues from surgical samples were cut into small pieces (1-2 mm in diameter) and then treated with 0.25 mg/mL collagenase IV for 30 min at 37°C. The obtained cell suspension was centrifuged at 1,000 rpm for 5 min, and the isolated cells were cultured in Dulbecco’s modified Eagle medium supplemented with 15% fetal bovine serum. Contaminating fibroblasts were removed by repeated adherence (Supplementary Materials and Methods S2).
Cisplatin cytotoxicity
Twenty-four hours prior to cisplatin treatment, the cells were seeded in 96-well plates at densities of 105, 5 × 10⁴, 2.5 × 10⁴, 1.3 × 10⁴ and 0.6 × 10⁴ per well. Serially diluted cisplatin (Sigma–Aldrich, St. Louis, MO, USA) was added by medium replacement. After 24 h of treatment (to mimic the 24-h clinical aspect of cisplatin administration), MTT assays were performed according to previously described procedures [3]. For the modified MTT assays, the control wells were not seeded until cisplatin had been administered (Supplementary Materials and Methods S2).
Flow cytometry (FCM)
Apoptosis was measured with an FITC Annexin V Apoptosis Detection Kit I (BD biosciences, San Jose, CA, USA). Our cell-cycle analysis was performed using a Cell Cycle and Apoptosis Analysis Kit (Beyotime, Nantong, Jiangsu, China). For all analyses, living or 70% ethanol-fixed cells were used as controls (Supplementary Materials and Methods S2).
Trypan blue-based cell counting
Cisplatin-surviving/killed cells in 96-well plates were identified and counted using 0.4% trypan blue (Sigma-Aldrich) staining (Supplementary Materials and Methods S2).
Limiting dilution assay
The cells were seeded in 96-well plates and cultured for 24 h. Control cells were detached using 0.25% trypsin, re-seeded in a 1/10 dilution series, cultured for 24 h and fixed in 10% formaldehyde. Test cells were treated with cisplatin for 24 h, and the subsequent procedures were the same as those used for the controls. At the appropriate dilution gradient, the colonies formed by the control and test cells were counted to calculate the IC50 values (Supplementary Materials and Methods S2).
Western blot assay
Cultured cells (106-107) were washed with PBS and lysed with RIPA buffer (Thermo Fisher, Waltham, MA, USA). The protein level was measured with a BCA assay kit (Thermo Fisher), and the proteins were separated by SDS-PAGE and then transferred to polyvinylidene fluoride membranes (Millipore, Billerica, MA, USA). After labeling with primary and secondary (fluorophore-coupled) antibodies (Supplementary Materials and Methods S2), the membranes were scanned using an Odyssey CLx infrared imaging system (LI-COR, Lincoln, NE, USA).
siRNA and small-molecule inhibition
Target-specific and control siRNAs (Supplementary Table S3) were purchased from GenePharma (Shanghai, China). LY294002 (Selleckchem, Houston, TX, USA), 3-methyladenine (3-MA, Selleckchem) and chloroquine diphosphate (Sigma) were administered according to the manufacturers’ instructions (Supplementary Materials and Methods S2).
Immunohistochemistry (IHC)
Immunohistochemical quantification of pAkt and p62 in cancer specimens was performed according to previously described procedures [54]. Antibody information and criteria for negative and positive staining appear in Supplementary Materials and Methods S2 (for the IHCpAkt+p62 scoring system, see Supplementary Table S4).
Statistical analyses
Two-sided χ2 test/Fisher’s exact test and ANOVA/Student’s t-test were used for nominal and numerical data, respectively. A kappa coefficient was used to estimate the consistency between qualitative datasets, and Pearson’s product-moment correlation coefficient was used to estimate linear relationships between quantitative datasets (Supplementary Materials and Methods S2). SPSS 18.0 software (IBM, Armonk, NY, USA) was used to perform the statistical analyses (p < 0.05 was considered significant). All experiments were performed in triplicate unless otherwise indicated.
CONFLICTS OF INTEREST
No potential conflicts of interest exist.
GRANT SUPPORT
This work was supported by grants from the Science and Technology Commission of Shanghai Municipality (Nos. 15441905700 and 15DZ1940502 to Yifeng He and No. 12411950200 to Wen Di), the Shanghai Municipal Commission of Health and Family Planning (No. 2013ZYJB0202 to Wen Di), and the Natural Science Foundation of China (No. 81572548 to Yifeng He and Nos. 81272882 and 81072137 to Wen Di).
REFERENCES
1. Cheng Y-C, Prusoff WH. Relationship between the inhibition constant (KI) and the concentration of inhibitor which causes 50 per cent inhibition (I50) of an enzymatic reaction. Biochem Pharmacol. 1973; 22:3099-3108. doi: 10.1016/0006-2952(73)90196-2.
2. Neubig RR, Spedding M, Kenakin T, Christopoulos A, International Union of Pharmacology Committee on Receptor Nomenclature and Drug Classification. International Union of Pharmacology Committee on Receptor Nomenclature and Drug classification. XXXVIII. Update on terms and symbols in quantitative pharmacology. Pharmacol Rev. 2003; 55:597-606. doi: 10.1124/pr.55.4.4.
3. Mosmann T. Rapid colorimetric assay for cellular growth and survival: application to proliferation and cytotoxicity assays. J Immunol Methods. 1983; 65:55-63. doi: 10.1016/0022-1759(83)90303-4.
4. Bernas T, Dobrucki J. Mitochondrial and nonmitochondrial reduction of MTT: interaction of MTT with TMRE, JC-1, and NAO mitochondrial fluorescent probes. Cytometry. 2002; 47:236-242. doi: 10.1002/cyto.10080.
5. Huang MC, Ashmun RA, Avery TL, Kuehl M, Blakley RL. Effects of cytotoxicity of 2-chloro-2'-deoxyadenosine and 2-bromo-2'-deoxyadenosine on cell growth, clonogenicity, DNA synthesis, and cell cycle kinetics. Cancer Res. 1986; 46:2362-2368.
6. Barltrop JA, Owen TC, Cory AH, Cory JG. 5-(3-Carboxymethoxyphenyl)-2-(4,5-dimethylthiazolyl)-3-(4-sulfophenyl) tetrazolium, inner salt (MTS) and related analogs of 3-(4,5-dimethylthiazolyl)-2,5-diphenyltetrazolium bromide (MTT) reducing to purple water-soluble formazans as cell-viability indicators. Bioorg Med Chem Lett. 1991; 1:611-614. doi: 10.1016/S0960-894X(01)81162-8.
7. Ishiyama M, Miyazono Y, Sasamoto K, Ohkura Y, Ueno K. A highly water-soluble disulfonated tetrazolium salt as a chromogenic indicator for NADH as well as cell viability. Talanta. 1997; 44:1299-1305. doi: 10.1016/S0039-9140(97)00017-9.
8. Garnett MJ, Edelman EJ, Heidorn SJ, Greenman CD, Dastur A, Lau KW, Greninger P, Thompson IR, Luo X, Soares J, Liu Q, Iorio F, Surdez D, et al. Systematic identification of genomic markers of drug sensitivity in cancer cells. Nature. 2012; 483:570-575. doi: 10.1038/nature11005.
9. Barretina J, Caponigro G, Stransky N, Venkatesan K, Margolin AA, Kim S, Wilson CJ, Lehár J, Kryukov GV, Sonkin D, Reddy A, Liu M, Murray L, et al. The cancer cell line encyclopedia enables predictive modelling of anticancer drug sensitivity. Nature. 2012; 483:603-607. doi: 10.1038/nature11003.
10. Haibe-Kains B, El-Hachem N, Birkbak NJ, Jin AC, Beck AH, Aerts HJ, Quackenbush J. Inconsistency in large pharmacogenomic studies. Nature. 2013; 504:389-393. doi: 10.1038/nature12831.
11. Crouch SP, Kozlowski R, Slater KJ, Fletcher J. The use of ATP bioluminescence as a measure of cell proliferation and cytotoxicity. J Immunol Methods. 1993; 160:81-88. doi: 10.1016/0022-1759(93)90011-U.
12. Papazisis KT, Geromichalos GD, Dimitriadis KA, Kortsaris AH. Optimization of the sulforhodamine B colorimetric assay. J Immunol Methods. 1997; 208:151-158. doi: 10.1016/S0022-1759(97)00137-3.
13. Moreno-Smith M, Halder JB, Meltzer PS, Gonda TA, Mangala LS, Rupaimoole R, Lu C, Nagaraja AS, Gharpure KM, Kang Y, Rodriguez-Aguayo C, Vivas-Mejia PE, Zand B, et al. ATP11B mediates platinum resistance in ovarian cancer. J Clin Invest. 2013; 123:2119-2130. doi: 10.1172/JCI65425.
14. Ikeda M, Kurose A, Takatori E, Sugiyama T, Traganos F, Darzynkiewicz Z, Sawai T. DNA damage detected with gammaH2AX in endometrioid adenocarcinoma cell lines. Int J Oncol. 2010; 36:1081-1088.
15. Shah MA, Schwartz GK. Cell cycle-mediated drug resistance: an emerging concept in cancer therapy. Clin Cancer Res. 2001; 7:2168-2181.
16. Stewart DJ. Wnt signaling pathway in non-small cell lung cancer. J Natl Cancer Inst. 2014; 106:djt356. doi: 10.1093/jnci/djt356.
17. Oloumi A, McPhee T, Dedhar S. Regulation of E-cadherin expression and beta-catenin/Tcf transcriptional activity by the integrin-linked kinase. Biochim Biophys Acta. 2004; 1691:1-15. doi: 10.1016/j.bbamcr.2003.12.002.
18. Li G, Satyamoorthy K, Herlyn M. Dynamics of cell interactions and communications during melanoma development. Crit Rev Oral Biol Med. 2002; 13:62-70. doi: 10.1177/154411130201300107.
19. Davis WJ, Lehmann PZ, Li W. Nuclear PI3K signaling in cell growth and tumorigenesis. Front Cell Dev Biol Rev. 2015; 3:1-14.
20. Chia S, Gandhi S, Joy AA, Edwards S, Gorr M, Hopkins S, Kondejewski J, Ayoub JP, Califaretti N, Rayson D, Dent SF. Novel agents and associated toxicities of inhibitors of the PI3K/Akt/mTOR pathway for the treatment of breast cancer. Curr Oncol. 2015; 22:33-48. doi: 10.3747/co.22.2393.
21. Zinkel S, Gross A, Yang E. BCL2 family in DNA damage and cell cycle control. Cell Death Differ. 2006; 13:1351-1359. doi: 10.1038/sj.cdd.4401987.
22. Yang E, Korsmeyer SJ. Molecular thanatopsis: a discourse on the BCL2 family and cell death. Blood. 1996; 88:386-401.
23. Stickles XB, Marchion DC, Bicaku E, Al Sawah E, Abbasi F, Xiong Y, Bou Zgheib N, Boac BM, Orr BC, Judson PL, Berry A, Hakam A, Wenham RM, et al. BAD-mediated apoptotic pathway is associated with human cancer development. Int J Mol Med. 2015; 35:1081-1087. doi: 10.3892/ijmm.2015.2091.
24. Besson A, Hwang HC, Cicero S, Donovan SL, Gurian-West M, Johnson D, Clurman BE, Dyer MA, Roberts JM. Discovery of an oncogenic activity in p27Kip1 that causes stem cell expansion and a multiple tumor phenotype. Genes Dev. 2007; 21:1731-1746. doi: 10.1101/gad.1556607.
25. Tanida I. Autophagosome formation and molecular mechanism of autophagy. Antioxid Redox Signal. 2011; 14:2201-2214. doi: 10.1089/ars.2010.3482.
26. Komatsu M, Ichimura Y. Physiological significance of selective degradation of p62 by autophagy. FEBS Lett. 2010; 584:1374-1378. doi: 10.1016/j.febslet.2010.02.017.
27. Jensen R, Glazer PM. Cell-interdependent cisplatin killing by Ku/DNA-dependent protein kinase signaling transduced through gap junctions. Proc Natl Acad Sci USA. 2004; 101:6134-6139. doi: 10.1073/pnas.0400051101.
28. Wilson JK, Sargent JM, Elgie AW, Hill JG, Taylor CG. A feasibility study of the MTT assay for chemosensitivity testing in ovarian malignancy. Br J Cancer. 1990; 62:189-194. doi: 10.1038/bjc.1990.258.
29. Dimanche-Boitrel MT, Pelletier H, Genne P, Petit JM, Le Grimellec C, Canal P, Ardiet C, Bastian G, Chauffert B. Confluence-dependent resistance in human colon cancer cells: role of reduced drug accumulation and low intrinsic chemosensitivity of resting cells. Int J Cancer. 1992; 50:677-682. doi: 10.1002/ijc.2910500502.
30. Fan D, Beltran P, Wang Y, Bucana C, Yoon S, Deguzman A, Fidler I. Cell density-dependent regulation of mdr-1 gene expression in murine colon cancer cells. Int J Oncol. 1996; 9:865-878. doi: 10.3892/ijo.9.5.865.
31. Itamochi H, Kigawa J, Terakawa N. Mechanisms of chemoresistance and poor prognosis in ovarian clear cell carcinoma. Cancer Sci. 2008; 99:653-658. doi: 10.1111/j.1349-7006.2008.00747.x.
32. Sekiguchi I, Suzuki M, Tamada T, Shinomiya N, Tsuru S, Murata M. Effects of cisplatin on cell cycle kinetics, morphological change, and cleavage pattern of DNA in two human ovarian carcinoma cell lines. Oncology 1996; 53:19-26. doi: 10.1159/000227529.
33. O’Neill CF, Koberle B, Masters JR, Kelland LR. Gene-specific repair of Pt/DNA lesions and induction of apoptosis by the oral platinum drug JM216 in three human ovarian carcinoma cell lines sensitive and resistant to cisplatin. Br J Cancer. 1999; 81:1294-1303. doi: 10.1038/sj.bjc.6694381.
34. Barr MP, Gray SG, Hoffmann AC, Hilger RA, Thomale J, O’Flaherty JD, Fennell DA, Richard D, O’Leary JJ, O’Byrne KJ. Generation and characterisation of cisplatin-resistant non-small cell lung cancer cell lines displaying a stem-like signature. PLOS ONE. 2013; 8:e54193. doi: 10.1371/journal.pone.0054193.
35. Wu H, Ding Z, Hu D, Sun F, Dai C, Xie J, Hu X. Central role of lactic acidosis in cancer cell resistance to glucose deprivation-induced cell death. J Pathol. 2012; 227:189-199. doi: 10.1002/path.3978.
36. Fraser M, Leung B, Jahani-Asl A, Yan X, Thompson WE, Tsang BK. Chemoresistance in human ovarian cancer: the role of apoptotic regulators. Reprod Biol Endocrinol. 2003; 1:66. doi: 10.1186/1477-7827-1-66.
37. Arya R, Mallik M, Lakhotia SC. Heat shock genes - integrating cell survival and death. J Biosci. 2007; 32:595-610. doi: 10.1007/s12038-007-0059-3.
38. Nihira K, Miki Y, Ono K, Suzuki T, Sasano H. An inhibition of p62/SQSTM1 caused autophagic cell death of several human carcinoma cells. Cancer Sci. 2014; 105:568-575. doi: 10.1111/cas.12396.
39. Moscat J, Diaz-Meco MT. p62 at the crossroads of autophagy, apoptosis, and cancer. Cell. 2009; 137:1001-1004. doi: 10.1016/j.cell.2009.05.023.
40. Moscat J, Diaz-Meco MT. p62: a versatile multitasker takes on cancer. Trends Biochem Sci. 2012; 37:230-236. doi: 10.1016/j.tibs.2012.02.008.
41. Seibenhener ML, Geetha T, Wooten MW. Sequestosome 1/p62 - more than just a scaffold. FEBS Lett. 2007; 581:175-179. doi: 10.1016/j.febslet.2006.12.027.
42. Rodriguez-Brenes IA, Wodarz D. Preventing clonal evolutionary processes in cancer: insights from mathematical models. Proc Natl Acad Sci U S A. 2015; 112:8843-8850. doi: 10.1073/pnas.1501730112.
43. Beerenwinkel N, Schwarz RF, Gerstung M, Markowetz F. Cancer evolution: mathematical models and computational inference. Syst Biol. 2015; 64:e1-25. doi: 10.1093/sysbio/syu081.
44. Chen M, Huang SL, Zhang XQ, Zhang B, Zhu H, Yang VW, Zou XP. Reversal effects of pantoprazole on multidrug resistance in human gastric adenocarcinoma cells by down-regulating the V-ATPases/mTOR/HIF-1α/P-gp and MRP1 signaling pathway in vitro and in vivo. J Cell Biochem. 2012; 113:2474–2487. doi: 10.1002/jcb.24122.
45. Matsuo M, Matsumoto S, Mitchell JB, Krishna MC, Camphausen K. Magnetic resonance imaging of the tumor microenvironment in radiotherapy: perfusion, hypoxia, and metabolism. Semin Radiat Oncol. 2014; 24:210-217. doi: 10.1016/j.semradonc.2014.02.002.
46. Black JC, Atabakhsh E, Kim J, Biette KM, Van Rechem C, Ladd B, Burrowes PD, Donado C, Mattoo H, Kleinstiver BP, Song B, Andriani G, Joung JK, et al. Hypoxia drives transient site-specific copy gain and drug-resistant gene expression. Genes Dev. 2015; 29:1018-1031. doi: 10.1101/gad.259796.115.
47. Shalini S, Dorstyn L, Dawar S, Kumar S. Old, new and emerging functions of caspases. Cell Death Differ. 2015; 22:526-539. doi: 10.1038/cdd.2014.216.
48. Graber TE, Holcik M. Distinct roles for the cellular inhibitors of apoptosis proteins 1 and 2. Cell Death Dis. 2011; 2:e135. doi: 10.1038/cddis.2011.20.
49. Harris LA, Frick PL, Garbett SP, Hardeman KN, Paudel BB, Lopez CF, Quaranta V, Tyson DR. An unbiased metric of antiproliferative drug effect in vitro. Nat Methods. 2016; 13:497-500.
50. Hafner M, Niepel M, Chung M, Sorger PK. Growth rate inhibition metrics correct for confounders in measuring sensitivity to cancer drugs. Nat Methods. 2016; 13:521-527.
51. Hu L, Hofmann J, Lu Y, Mills GB, Jaffe RB. Inhibition of phosphatidylinositol 3'-kinase increases efficacy of paclitaxel in in vitro and in vivo ovarian cancer models. Cancer Res. 2002; 62:1087-1092.
52. Iwadate R, Inoue J, Tsuda H, Takano M, Furuya K, Hirasawa A, Aoki D, Inazawa J. High expression of p62 protein is associated with poor prognosis and aggressive phenotypes in endometrial cancer. Am J Pathol. 2015; 185:2523-2533. doi: 10.1016/j.ajpath.2015.05.008.
53. Hatzis C, Bedard PL, Birkbak NJ, Beck AH, Aerts HJ, Stem DF, Stern DF, Shi L, Clarke R, Quackenbush J, Haibe-Kains B. Enhancing reproducibility in cancer drug screening: how do we move forward? Cancer Res. 2014; 74:4016-4023. doi: 10.1158/0008-5472.CAN-14-0725.
54. He YF, Zhang MY, Wu X, Sun XJ, Xu T, He QZ, Di W. High MUC2 expression in ovarian cancer is inversely associated with the M1/M2 ratio of tumor-associated macrophages and patient survival time. PLoS One. 2013; 8:e79769. doi: 10.1371/journal.pone.0079769.