
INTRODUCTION
As human oncology has a strong phenotypic difference from normal tissue, which may be visualized non-invasively by different imaging modalities, such as X-ray computed tomography (CT), positron emission tomography (PET), and magnetic resonance imaging (MRI). Among them, X-ray CT is the most widely applied in oncology, which can assess tissue density in high resolution and exhibit strong contrasts among different tissue types [1]. Nowadays, radiomics become a novel approach because it can utilize medical imaging to quantify the tumor phenotype non-invasively for further study, such as patients’ survival, treatment monitoring and outcome prediction [2].
To get a reliable and reproducible result in radiomics study, it is essential to guarantee the repeatability of features extraction process. Recent publications have demonstrated that radiomics features be reproducibly measured from CT images for patients with non-small cell lung cancer [3]. And for nonsmall cell lung cancer (NSCLC) patients, quantitative image features extracted from computed tomography (CT) images can be used to improve tumor diagnosis, staging, and response assessment [4]. However, no studies have yet examined the stability and reproducibility of CT images textural features for rectal cancer. In addition, no researches have been conducted to analyze which kind of extraction process is the best, including max slice, max value, min value, average value or matrix sum.
Specifically, max slice means textural features from the slice with the largest GTV area of target images; max value means textural features from all slices of target images and the maximum value was selected; min value means textural features from all slices of target images and the minimum value was selected; average value means textural features from all slices of target images and average all values; and matrix sum means all slices of target images translated into GLCM [5] (gray level co-occurrence matrix) matrices and GLRLM [6] (gray level run-length matrix) matrices and superpose all matrices, then extract textural features from the superposed matrices.
Furthermore, in these researches, patients were found who had two sets of CBCT images obtained within 15 minutes, such a short time may not analyze the reproducibility of radiomics.
In this study, we analyzed the stability and reproducibility of radiomics features derived from manually segmented rectal tumors in forty patients who underwent two baseline clinical CT scan within average 8.7 days (5 days to 17 days), without any treatment before. Also, we evaluated the five values for each features to find out the most stable value.
RESULTS
Table 1 presents the comparisons of geometry features (volume, area and volume/area) between two scans. It indicates that tumor volume increased 6% with an average 8.7 days’ interval.
The results of CCC and ICC for different numerical types of unnormalized features and normalized features are listed in the Figure 1 (A, B) and (C, D) respectively:
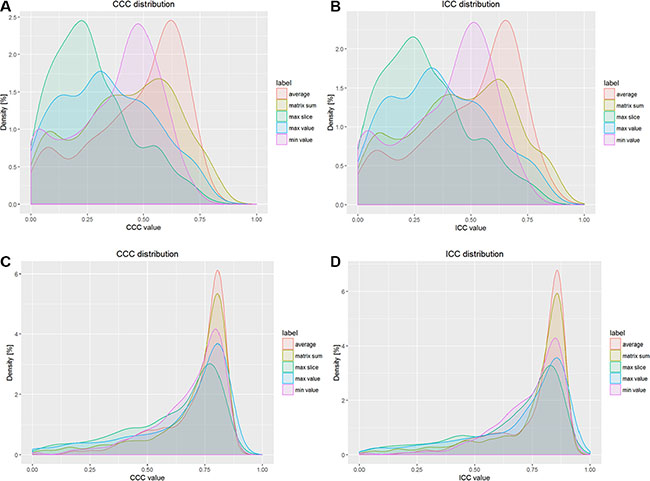
Figure 1: Results of CCC and ICC distributions for different types of features. (A) Probability density of CCC distribution for unnormalized features, (B) Probability density of ICC distribution for unnormalized features, (C) Probability density of CCC distribution for normalized features, (D) Probability density of ICC distribution for normalized features.
In Figures 1 (A) and (B), the peak values of probability density for different types of original features are less than 2.5%, but in Figures 1 (C) and (D), the peak values of volume normalized features are more than 6%. For Figures 2 (A) and (B), the mean CCC values and mean ICC values for different types of original features are less than 0.40 and 0.45, but for in Figures 1 (C) and (D), the values are about 0.80 and 0.85, respectively. In Figures 1 (C) and (D), the peak density value and the mean value for average type are larger than other four types’ features, so the average type volume normalized features are more reproducible than others.
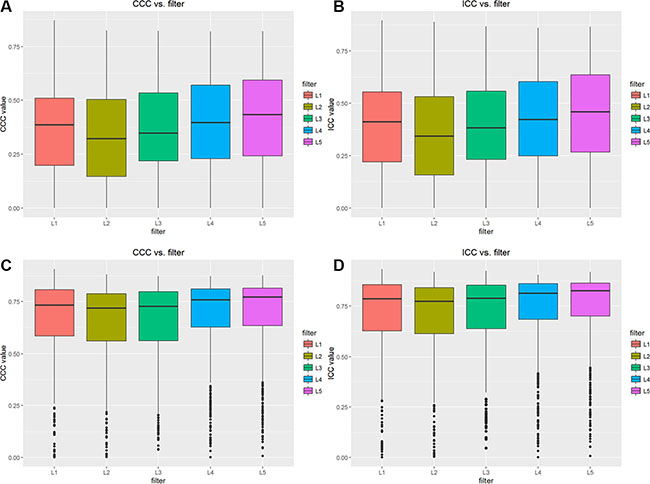
Figure 2: Results of CCC and ICC for different type of features with different filters. (A) CCC values for unnormalized features, (B) ICC values for unnormalized features, (C) CCC values for normalized features, (D) ICC values for normalized features.
The mean values of CCC and ICC for different filters of original features are less than 0.45 showed Figures 2 (A) and (B), however the mean values of CCC and ICC for different filters of volume normalized features are 0.75 and 0.80, respectively, showed Figure 2 (C) and (D). Furthermore, no statistically significant difference was observed in CCC and ICC values for different filters, showed in Figure 2 (C) and (D).
In Figures 3 (A) and (B), the peak values of probability density for different types of original features are less than 2.5%, but in Figures 3 (C) and (D), the peak values of volume normalized features are 7.5% and 3 %, respectively. In Figure 3 (C), for GLCM features, average value type and matrix sum type are more stable than other types; for GLRLM features, average value type is the most reproduced of all.
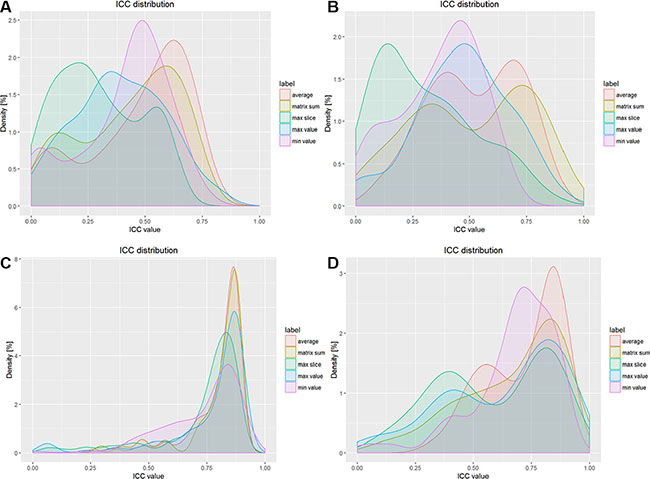
Figure 3: Results of ICC values for GLCM and GLRLM features. (A) ICC values for unnormalized GLCM features, (B) ICC values for unnormalized GLRLM features, (C) ICC values for normalized CCC features, (D) ICC values for normalized ICC features.
Figure 4 illustrates CCC and ICC values with different wavelet characteristics for features, and the mean values for volume normalized features are much larger than unnormalized features. For volume normalized features, CCC and ICC values are all about 0.75 and 0.80, respectively. So there is no significant difference among wavelet features showed in Figure 5 (C) and (D).
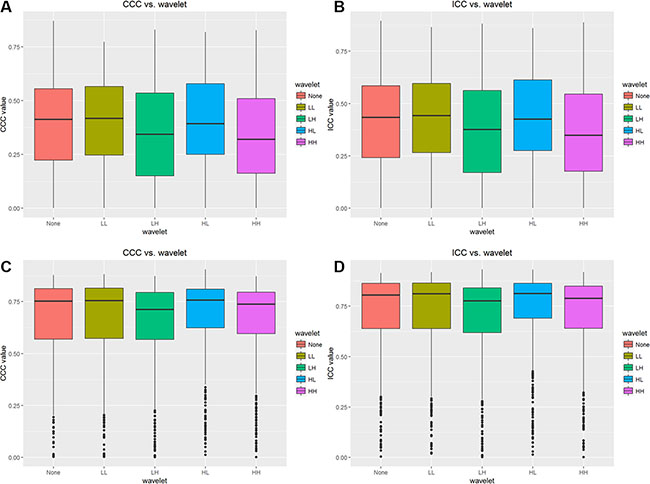
Figure 4: Results of CCC and ICC values for different wavelet features. (A) CCC values for unnormalized wavelet features, (B) ICC values for unnormalized wavelet features, (C) CCC values for normalized wavelet features, (D) ICC values for normalized wavelet features.
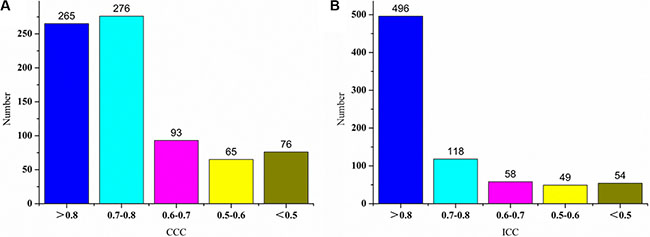
Figure 5: Histograms of CCC and ICC values of normalized features for the type of average value.
Figure 5 shows histograms of CCC values and ICC values of volume normalized features for the type of average value. Most of features have high reproducibility. For the average type normalized features, 496 out of 775 features (64.0%) showed high reproducibility (ICC ≥ 0.8), 225 out of 775 features (29.0%) showed medium reproducibility (0.8 > ICC ≥ 0.5) and 54 out of 775 features (7.0%) showed low reproducibility (ICC < 0.5).
DISCUSSION
Zhao et al. [7] analyzed variability from same-day repeat CT scans, quite a short wait time cannot analyze the reproducibility of radiomics, but this study evaluated the reproducibility of rectal tumor textural features from repeat CT scans which were underwent within average 8.7 days. Nowadays, radiomics studies for predicting prognosis are classified according to different stages of cancer, the interval from 5 days to 17 days showed in Table 2, and rectal cancer is still in the same stage. For a long interval, but textural features still have a good stability, the result has a higher reliability, and it indicates that CT image’s textural features are highly stable and reproduced for rectal cancer.
Table 1: Geometry features comparisons between two scans
|
Volume (mm3) |
Area (mm2) |
V/A (mm) |
|---|---|---|---|
Scan 1 |
45370.8 ± 35271.7 |
10921.1 ± 5246.5 |
3.9 ± 1.2 |
Scan 2 |
48002.5 ± 28625.2 |
10762.3 ± 4712.5 |
4.2 ± 0.9 |
Table 2: Characteristics of forty patients whose images were used in this study
Characteristics |
Number of patients |
Percent of patients (%) |
|---|---|---|
Number of patients |
40 |
NA |
Median age (range) |
50.5 (23–76) |
NA |
Median GTV volume (range) (cm3) |
38.2 (2.3–171.3) |
NA |
Gender |
|
|
Male |
24 |
60 |
Female |
16 |
40 |
Days between two scans |
8.7 (5–17) |
NA |
As we know, human’s tumor is changing fast, different time the tumor may be different, to evaluate the reproducibility of radiomics study, the wait time of two CT scans should be a little longer. So an extended wait time is needed to analyze the reproducibility of radiomics features.
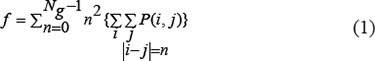
In this study, the values of the GLCM features were unnormalized and normalized to target volumes. The reason we use this normalization method is the connection between target volume and feature values. As slices area increase, more CT pixel will be included for analysis, and there will be more possibility to include some extreme value. But in GLCM matrix calculation, we use same bins (usually 32) to group these pixels. This will change the distribution shape of the pixel values. For example, in GLCM contract calculation, we use eq(1), where P(i,j) is the value of the pixel, n is the number of the pixels. As range of the CT value increase, the value of contract will decrease as more pixels will centralized.
Furthermore, we analyzed the correlation between textural features from the type of average value and tumor volumes, ICC values between textural features and tumor volumes illustrate that 252 out of 775 features (32.5%) have a high correlation and 227 out of 775 features (29.3%) have a medium correlation. Besides, Zou et al. [8] also reported that textural features have a strong correlation with volumes. The results of this study indicated that volume normalized features are much more stable than unnormalized ones.
775 textural features were extracted from patients’ medical images with rectal cancer, and we failed to find any statistically significant differences among each texture feature. It suggests that the further analysis of these textural features can be warranted for treatment monitoring and outcome prediction for rectal cancer. Furthermore, we innovatively compared the advantage and disadvantage of five types of patient’s medical images. Additionally, the results indicated that different filters have little effect to textural features.
MATERIALS AND METHODS
Patients
Forty rectal cancer patients with stage II were included retrospectively in this study. All patients underwent two baseline clinical CT scans within average 8.7 days (5 days to 17 days) at Fudan University Shanghai Cancer Center in China, before any treatment was delivered. Both scans were obtained with the same CT scanner by using the same imaging protocol (350mA tube current, 120 kVp tube voltage, 0.92 0.92 mm pixel size, 5 mm section collimation, 512 512 matrix). These patients’ medical images were divided into two groups: scans 1 and scans 2. The patients’ characteristics are showed in Table 2.
Contouring
The rectal GTV was distinguished and segmented by an experienced radiation oncologist in Eclipse (11.0, Varian, Palo Alto, CA), the delineation was double-checked and the non-invaded rectal wall and the air inside the rectum were carefully excluded. After contouring, the DICOM images and the DICOM contours were exported to MATLAB (Math works Inc, Natick, USA) for feature extracting and analysis.
The contoured regions of the images were cropped from the whole patient CT image. This was realized by creating a binary mask base on contouring (Figure 6).
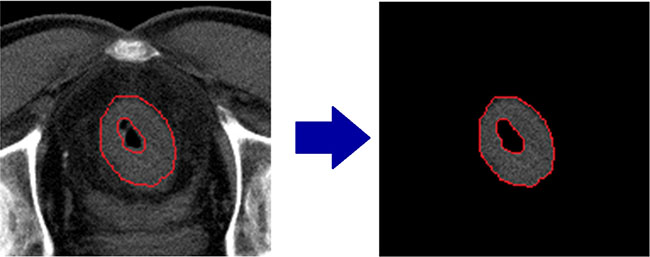
Figure 6: Contoured region cropping using binary mask.
Radiomics features extraction
We defined 775 radiomics image features to quantify tumor textural characteristics (detail of these features were list in Supplementary Table S1). These features were divided into four groups: I) GLCM [5] textural features, II) GLRLM [6] textural features, III) Wavelet GLCM textural features and IV) Wavelet GLRLM textural features. For each patient, all textural features were extracted from five types of patient’s medical images, respectively: I) Max Slice, II) Max value, III) Min Value, IV) Average Value and V) Matrix Sum. All textural features were extracted via Matlab R2015a software (Mathworks Inc, Natick, USA). Zou’s study shows lots of features were highly correlated with volume of the tumor [8]. So in this study original features and volume normalized features are both analyzed in this [3].
Data analysis
To estimate the reproducibility and repeatability of the tumor textural features by using repeat CT data, the concordance correlation coefficient (CCC) and the intra-class correlation coefficient (ICC) were initially used [9, 10].
In statistics, the CCC measures the agreement between two variables, for example to evaluate reproducibility or for inter-rater reliability. McGraw and Wong [11] has the form of the concordance correlation coefficient as follow:
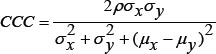
Where μx and μy are the means for the two variables, σx and σy are the corresponding variances, ρ is the correlation coefficient between the two variables. R package IRR (inter rater reliability) was used for CCC computation [12].
Statistically, the ICC is a descriptive statistic that can be used when quantitative measurements are made on units that are organized into groups [13]. It ranges between 0 and 1, indicating null and perfect reproducibility. In order to determine the ICC for inter-observer segmentations, variance estimates were obtained from two-way mixed effect model of analysis of variance (ANOVA), Leijenaar [14] defined ICC as follow:
Where MSR = mean square for rows, MSW = mean square for residual source of variance, k = number of observers involved and n = number of subjects. R package version 3.1.3 IRR was used for ICC computation [12].
CONFLICTS OF INTEREST
None.
REFERENCES
1. Zhang L, Fried DV, Fave XJ, Hunter LA, Yang J, Court LE. IBEX: an open infrastructure software platform to facilitate collaborative work in radiomics. J Medical Physics. 2015; 42:1341–1353.
2. Aerts HJWL, Velazquez ER, Leijenaar RTH, Parmar C, Grossmann P, Cavalho S. Decoding tumour phenotype by noninvasive imaging using a quantitative radiomics approach. J Nature Communications. 2014; 5:4006–4006.
3. Fave X, Mackin D, Yang J, Zhang J, Fried D, Balter P. Can radiomics features be reproducibly measured from CBCT images for patients with non-small cell lung cancer? J Medical Physics. 2015; 42.
4. Hunter LA, Krafft S, Stingo F, Choi H, Martel MK, Kry SF. High quality machine-robust image features: identification in nonsmall cell lung cancer computed tomography images. J Medical Physics. 2013; 40:1934–1936.
5. Robert M. Haralick, Shanmugam K. Textural Features for Image Classification. J Systems Man & Cybernetics IEEE Transactions on. 1973; smc-3.
6. Galloway MM. Texture analysis using gray level run lengths. J Computer Graphics & Image Processing. 1975; 4:172–179.
7. Zhao B, James LP, Moskowitz CS, Guo P, Ginsberg MS, Lefkowitz RA. Evaluating variability in tumor measurements from same-day repeat CT scans of patients with non-small cell lung cancer. J Radiology. 2009; 252:263–72.
8. Zou KH, Tuncali K, Silverman SG. Correlation and simple linear regression. J Radiology. 2003; 227:617–622.
9. Grove O, Berglund AE, Schabath MB, Aerts HJ, Dekker A, Wang H. Quantitative computed tomographic descriptors associate tumor shape complexity and intratumor heterogeneity with prognosis in lung adenocarcinoma. J Plos One. 2015; 10.
10. Parmar C, Rios VE, Leijenaar R, Jermoumi M, Carvalho S, Mak RH. Robust Radiomics feature quantification using semiautomatic volumetric segmentation. J Plos One. 2014; 9:e102107-e102107.
11. Mcgraw KO, Wong SP. Forming Inferences About Some Intraclass Correlation Coefficients. J Psychological Methods. 1996; 1:390–390.
12. Carslaw DC, Ropkins K. openair — An R package for air quality data analysis. J Environmental Modelling & Software. 2012; s 27–28:52–61.
13. Shrout PE, Fleiss JL. Intraclass correlations: uses in assessing rater reliability. J Psychological Bulletin. 1979; 86:420–428.
14. Leijenaar RT, Carvalho S, Velazquez ER, Van Elmpt WJ, Parmar C, Hoekstra OS. Stability of FDG-PET Radiomics features: an integrated analysis of test-retest and inter-observer variability. J Acta Oncologica. 2013; 52:1391–7.