
INTRODUCTION
Bladder cancer is histopathologically a heterogeneous group comprising urothelial carcinoma (UC), squamous cell carcinoma (SCC), adenocarcinoma and neuroendocrine tumors (small cell carcinoma). About 90% of bladder cancers in western countries are histologically classified as UC, and SCC comprise < 3% of the tumors [1]. However, recent cluster analysis of whole genome expression data has identified breast cancer-like “basal” and “luminal” types of muscle invasive UC with a distinct “squamous-like” subtype [2–4]. This subtype shows high level expression of high molecular weight keratins (KRT5, KRT6, KRT14), EGFR and an invasive/metastatic phenotype with shorter survival times similar to SCC of the bladder. So far, cystectomy is the main treatment strategy for muscle invasive UC, SCC or mixed UC with squamous differentiation. The value of neoadjuvant chemotherapy remains controversial, as on the one hand there is evidence for superiority in cases with mixed histopathology and on the other hand the consequent delay of cystectomy in squamous differentiated tumors is associated with poor response rates [5].
At the molecular level, UC and squamous carcinomas of other sites (e.g. lung and head and neck) share pathways such as fibroblast growth factor receptor (FGFR)-signaling [6]. This tyrosine kinase receptor family comprises four different FGFRs (FGFR1-4), which control cell survival and differentiation mainly via the Ras/MAPK, STAT and PI3K pathway [7]. In UC, pathway activation results primarily from point mutated FGFR3, which is particularly frequent in low grade non-invasive bladder cancers [8]. FGFR3 mutation and protein overexpression in invasive UC is less frequent (12.6%) [3]. Previous work from our group showed that amplification of FGFR genes is rare in UC (1.6% FGFR1, 0.8% FGFR2, 3.4% FGFR3) [9], and also that the recently discovered FGFR3 gene fusions (resulting in FGFR3-TACC3 or FGFR3-BAlAP2L1) were only found in a small subgroup of UCs (2/32, 6.25%) [10]. Other FGFR-driven cancers with squamous differentiation include squamous carcinomas of the lung and head and neck [6]. In squamous lung cancer, amplification of FGFR1 was found in up to 22% of cases [11]. This was associated with reduced cell growth in vitro in cells treated with a small molecule inhibitor [12]. However, little is known about FGFR activation in squamous differentiated bladder cancer. Hence, we systematically screened a cohort of squamous differentiated specimens and publically available datasets of “squamous-like” bladder cancers for expression, amplification, mutation and chromosomal rearrangement of FGFRs (FGFR1-3), in order to evaluate putative pathway activation. Our aim was to evaluate FGFRs as potential therapeutic targets in squamous differentiated bladder cancer, a tumor group in which disease management remains inadequate.
RESULTS
FGFR1, FGFR2 and FGFR3 gene amplification in squamous differentiated bladder cancer
Fluorescence in situ hybridization (FISH) was successfully evaluated in a total of 68 samples for FGFR1, 65 samples for FGFR2 and 64 samples for FGFR3. Among all suitable samples, no amplification of FGFR1, FGFR2 or FGFR3 matching the criteria defined by Schildhaus et al. [13] were found (Supplementary Data S1).
Similar to a previous study from our group we then analyzed the cells for polysomy, choosing a cut-off of three centromere signals for polysomy [9]. We identified only 4/68 (5.9%), 3/65 (4.6%) and 0/64 polysomic cases for chromosome 8 (FGFR1), 10 (FGFR2) and 4 (FGFR3), respectively, indicating no considerable amplification bias due to polysomy (Supplementary Data S1).
FGFR3-rearrangement analysis (break apart FISH and cDNA fragment analysis)
FISH analysis for FGFR3 rearrangement was effectively performed on a total of 66 samples. For each tissue microarray we evaluated cores of normal urothelium, showing a mean of 4.22 break apart events. According to Wolff et al. we calculated a cut off for positive cases by using the Microsoft Excel β-inverse function BETAINV [14]. Tumor samples were scored as positive, if nine or more break apart events in 60 tumor cell nuclei were found (Figure 1, Supplementary Data S1). We identified only eight slightly positive samples (ranging from 9 to 11 break apart events, mean 9.5 events/sample). There was no overlap with the polysomic samples mentioned above. Additional cDNA fragment analysis of FISH-positive cases showed sufficient FGFR3-cDNA in two available frozen samples (ID #2, #18), but no FGFR3-TACC3-fusion product could be verified.
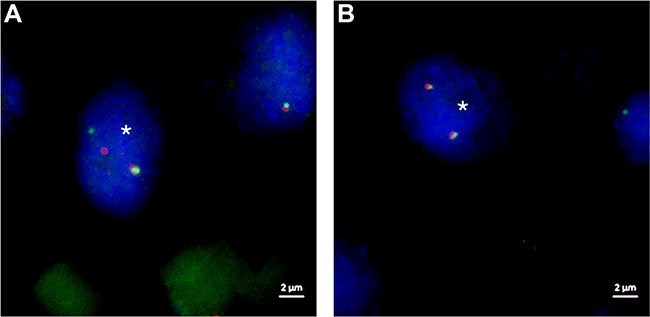
Figure 1: FISH images of ZytoLight SPECTM FGFR3 Dual Color Break Apart Probe sample ID 51. (A) Tumor cell nucleus (*) with a classical break apart event of chromosome region 4p16.3 displaying one single orange (proximal to FGFR3) and one single green (distal to FGFR3) signal as well as one fusion (adjacent orange-green) signal. (B) Tumor cell with normal chromosome region 4p16.3 showing two fusion signals (adjacent orange-green signals) per nucleus. DAPI counterstain, original magnification 1000-fold, white scale bar equals 2 μm.
FGFR3 mutation analysis and its clinical impact
We investigated the squamous differentiated bladder cancers for activating FGFR3 point mutations. SNapShot®-analysis showed FGFR3 mutations in 6 of 71 samples (8.5%, all p.S249C, n = 3 pure squamous carcinomas and n = 3 mixed carcinomas) (Figure 2A, Supplementary Data S1). Next, we determined whether there were associations between FGFR3 mutation and clinico-pathological characteristics. A close association of FGFR3 mutation and FGFR3 protein overexpression (p < 0.001; Fisher’s exact test) was demonstrated. No correlations were found with stage, grade, age at diagnosis or gender (Table 1). Even though FGFR3 mutation was rare in this cohort, we analyzed the recurrence-free survival as a clinical indicator that is known being associated with FGFR3 mutation in bladder cancer [8]. Kaplan-Meier analysis revealed that patients with a p.S249C FGFR3 mutation showed a significantly (p = 0.001) shorter recurrence-free survival (mean RFS: 7.5 months ± 1.8; 95% CI: 3.9 to 11.1) compared with those with non-mutated tumors (mean RFS: 105.8 months ± 10.2; 95% CI: 85.8 to 125.7) (Figure 2B, Table 2). The calculated Cox regression model (including the potentially prognostic parameters grade, tumor stage, nodal status and metastasis) confirmed the clinical impact of FGFR3 mutation on recurrence-free survival (Supplementary Data S2). Squamous differentiated bladder cancer patients displaying a p.S249C mutation had a 4.4-fold increased risk for tumor relapse (multivariate hazard ratio (HR): 4.4, 95% CI: 1.0 to 21.8, p = 0.046). However, mutation status had no significant influence on disease-specific survival or overall survival in our patient cohort (data not shown).
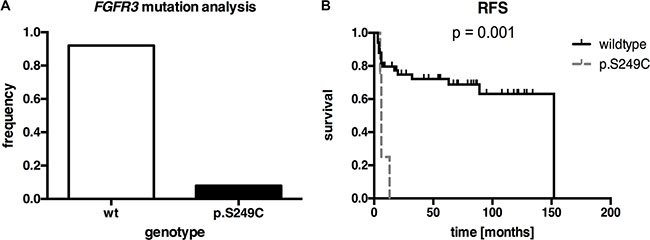
Figure 2: FGFR3 mutation analysis of our squamous differentiated bladder cancer samples (n = 71). (A) Frequency of FGFR3 mutations (8.5%) in our squamous bladder tumors. (B) Univariate Kaplan-Meier survival curve illustrating recurrence-free survival (RFS) of patients with FGFR3 mutation (dashed gray line) compared to non-mutated tumors (black line). Vertical lines: censored cases.
Table 1: Clinico-pathological and demographic data of our squamous differentiated bladder cancer samples cohort in relation to FGFR3 mutation status
variable |
patients (na) |
non-mutated (n) |
mutated (n) |
p-valueb |
|---|---|---|---|---|
patient age (years) |
|
|
|
|
0–67.5 |
36 |
34 |
2 |
0.377 |
> 67.5 |
35 |
31 |
4 |
|
gender |
|
|
|
|
female |
39 |
35 |
4 |
0.549 |
male |
32 |
30 |
2 |
|
tumor stage |
|
|
|
|
pT1-2 |
9 |
9 |
0 |
0.333 |
pT3-4 |
62 |
56 |
6 |
|
grade |
|
|
|
|
G1-2 |
21 |
20 |
1 |
0.472 |
G3-4 |
50 |
45 |
5 |
|
nodal status |
|
|
|
|
N0 |
52 |
48 |
4 |
0.877 |
N1 |
11 |
10 |
1 |
|
FGFR3 expression |
|
|
|
|
low expression (Tomlinson-Score < 3) |
55 |
52 |
3 |
< 0.001 |
high expression (Tomlinson-Score = 3) |
6 |
3 |
3 |
Bold-face indicates significant results.
aVariations in number due to limited histopathological, experimental or clinical follow up data.
bCalculated by Fisher’s exact test.
Table 2: Clinico-pathological data of our squamous differentiated bladder cancer samples in regard to recurrence-free survival
variable |
patients (na) |
recurrence (n) |
p-valueb |
|
|---|---|---|---|---|
yes |
no |
|||
metastasis status |
|
|
|
|
no metastasis |
49 |
13 |
36 |
< 0.001 |
metastasis |
7 |
7 |
0 |
|
tumor stage |
|
|
|
|
pT1-2 |
8 |
0 |
8 |
0.038 |
pT3-4 |
55 |
20 |
35 |
|
grade |
|
|
|
|
G1-2 |
20 |
5 |
15 |
0.185 |
G3-4 |
43 |
15 |
28 |
|
nodal status |
|
|
|
|
N0 |
51 |
17 |
34 |
0.176 |
N1 |
6 |
2 |
4 |
|
mutational status |
|
|
|
|
wildtype |
57 |
16 |
41 |
0.001 |
p.S249C |
5 |
4 |
1 |
|
FGFR3 expression |
|
|
|
|
low expression (Tomlinson-Score < 3) |
50 |
14 |
36 |
0.144 |
high expression (Tomlinson-Score = 3) |
5 |
3 |
2 |
|
Bold-face indicates significant results.
aVariations in number due to limited histopathological, experimental or clinical follow up data.
bCalculated by log-rank test.
FGFR1-3 protein expression in bladder cancer
Protein expression was analyzed by immunohistochemical staining and 60, 58 and 64 TMA cores for FGFR1, FGFR2 and FGFR3 could be scored. Evaluation criteria used to define FGFR protein expression were 0 (no expression), 1 (weak expression), 2 (intermediate expression) and 3 (strong expression) as reported by Tomlinson et al. [15]. FGFR1 expression was very low, with 52/60 (86.7%) tumors exhibiting no expression, 6/60 (10%) with weak expression and 2/60 (3.3%) tumors showing strong expression. FGFR2 expression was similarly low: 49/58 (84.5%) displayed no, 7/58 (12.1%) weak and 2/58 (3.4%) strong positivity. FGFR3 protein expression was negative in 14/64 (21.9%) cases, weak in 34/64 (53.1%), intermediate in 10/64 (15.6%) and strong in 6/64 (9.4%) of the examined cores (Figure 3). There was no statistical correlation of FGFR1-3 expression with any clinico-pathological parameter (see Supplementary Data S3).
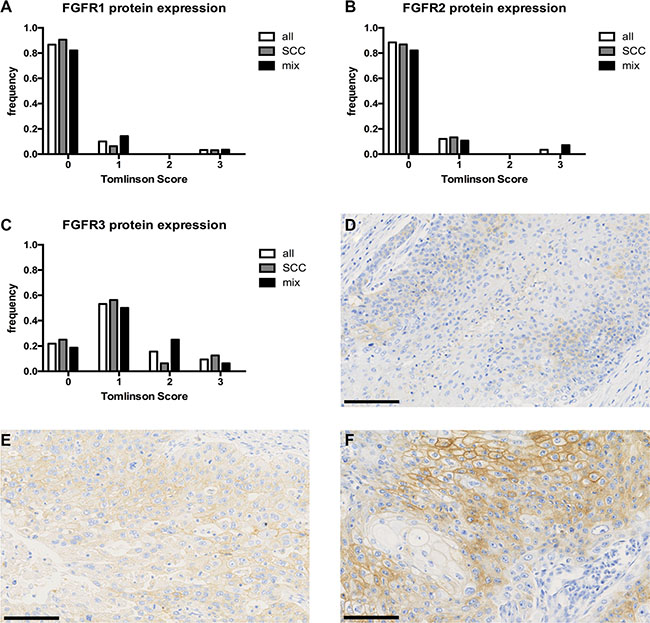
Figure 3: FGFR1-3 protein expression of our squamous differentiated bladder cancer samples. Distribution of protein expression measured by Tomlinson Score 0-3 for FGFR1 (A) n = 60, FGFR2 (B) n = 58, FGFR3 (C) n = 64, respectively. (D–F) anti-FGFR3 staining with examples of Tomlinson Score 1(D), 2(E) and 3(F), original magnification 200-fold. Black scale bar equals 100 μm.
External validation of FGFR alterations in an independent cohort of bladder cancer (TCGA)
After integration of all currently available bladder cancer datasets new hierarchical cluster analysis based on the mRNA expression of the entire TCGA cohort identified 85 “squamous-like” bladder cancer samples (Figure 4). The new cluster of “squamous-like” tumor samples was consistent with the results previously published [16]. Mutation and CNV data was available for n = 82 samples. Mutations of FGFR1, FGFR2 and FGFR3 were present in 2/82 (2.4%), 1/82 (1.2%), and 4/82 (4.9%) of tumors.
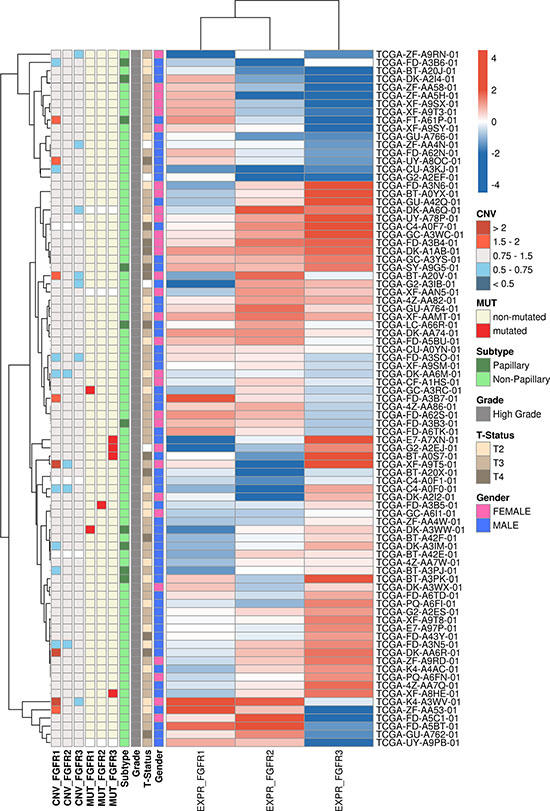
Figure 4: Heatmap showing the FGFR1, FGFR2 and FGFR3 mRNA expression in the 85 “squamous-like” bladder cancer samples identified by hierarchical cluster analysis of the entire TCGA cohort. Samples are annotated with gender, stage, grade, histological subtype as well as mutational status and CNVs for FGFR1-3.
The average expression of FGFR1 and FGFR2 was significantly lower (p < 10−6) in “squamous-like” tumors compared to normal tissues (95% CI; factor 4.8–10 (FGFR1) and 2.5–5.1 (FGFR2)) (Figure 5). Furthermore, there was a significant positive correlation between the expression of FGFR1-FGFR2 (ρ = 0.24, p = 0.026) and FGFR2-FGFR3 (ρ = 0.23, p = 0.031) in tumor tissues, while FGFR1 expression was inversely correlated with FGFR3 expression (ρ = −0.30, p = 0.005). Compared to normal tissues, the average expression of FGFR3 was significantly higher in tumors with concomitant FGFR3 mutation (p = 0.006), but not in those without (Figure 5). Due to the small number of FGFR3 mutated tumors a reliable estimate of the effect size was not possible (95% CI; factor 2-34).
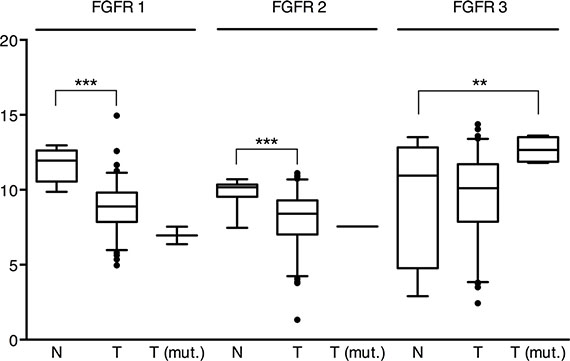
Figure 5: mRNA expression of FGFR1, 2 and 3 in the “squamous-like” bladder cancer subtype of the TCGA cohort. Pairwise applied Welch’s t-tests indicate that the average expression of FGFR1 and FGFR2 was significantly lower (p < 10−6) in non-mutated tumors (T) compared to normal tissue (N), while FGFR3 mRNA expression in mutated tumors (T(mut.)) was significantly higher (p = 0.02). ** = p < 0.01, *** = p < 0.001.
The calculated copy numbers of FGFR1, FGFR2 and FGFR3 deviated from the normal genotype of blood and normal tissue samples in the majority of the “squamous-like” tumors, indicating the general genomic instability of progressed cancers. High level amplifications of FGFR1, FGFR2 and FGFR3 segments (average of gene copies per chromosome > 2) were detected in 3/82 (3.7%), 0/82 (0%) and 0/82 (0%) of the tumors (Figure 4). Futhermore, 5/82 (6.1%) patients had a less distinctive elevated copy-number of FGFR1 (average gene copies per chromosome > 1.5). There was no evidence for deep deletion (average gene copies per chromosome < 0.5) of the FGFR1, FGFR2 and FGFR3 genes.
DISCUSSION
Aberrant activation of tyrosine kinase signaling is frequent in various tumors and offers several possibilities for targeted therapies. We focused on FGFRs, since FGFR alterations have been found in SCC tumors in other tissues and FGFR3 is frequently activated in UC [6, 8]. Our study is the first comprehensive analysis of FGFR alterations potentially contributing to the development of squamous differentiated bladder cancer. We initially studied gene copy number alterations, i.e. FGFR amplifications, as a known mechanism of enhanced FGFR gene activation. While FGFR1 amplifications have been found in up to 22% of squamous cell carcinomas of the lung and about 15% in head and neck cancers, we found neither FGFR1, FGFR2, nor FGFR3 amplifications by FISH in squamous differentiated bladder cancer [11, 17]. In a previous study of UC by our group we detected only low numbers of amplifications varying from 1.6%, 0.8% and 3.4% respectively for FGFR1, FGFR2 and FGFR3 [9]. Thus, our data do not indicate FGFR amplification as a major mechanism of pathway activation in these bladder cancer subtypes. Contrary to our negative FGFR1-FISH results, Helsten et al. found up to 7% of FGFR1 amplification in their high throughput next-generation sequencing pan-cancer study [6]. However, 3% of FGFR3 amplifications are comparable with our previous findings in UC.
Besides FGFR amplification, recent studies have identified FGFR gene fusion products such as FGFR3-TACC3 as an additional oncogenic mechanism and a putative target for tyrosine kinase inhibitors in a variety of tumors e.g. adeno- and squamous cell carcinoma of the lung, glioblastoma multiforme and bladder cancer [10, 18, 19]. Full-length FGFR3-TACC3 gene fusion products led to anchorage independent growth and constitutive activation, resulting in increased phosphorylation compared to FGFR3 wild type receptors [10]. In addition, the fusion products are reported to stimulate proliferation by inducing chromosomal instability and aneuploidy [19]. FGFR3-TACC3 fusions were found in 2.3% (3/131) samples of the TCGA bladder cancer cohort [3] and overall FGFR fusions were reported by Helsten et al. in 6% of their bladder cancer specimens (FGFR3-TACC3 fusions 3%) [6]. We found eight tumors with only slightly enhanced break apart events by FISH analysis. However, further successful analysis was limited to cryo samples only (n = 2), and fusion products could not be confirmed by PCR. Therefore, it remains unresolved whether visible break apart events might be caused by section artifacts or might be unverified due to limited PCR performance using fragmented paraffin-derived RNA or the presence of other fusion partners. Nevertheless, FGFR3-TACC3 fusions seem to be infrequent alterations in squamous differentiated bladder cancers.
The most common mechanism leading to FGFR3 activation in bladder cancer is activating point mutation of the gene. By creating two unpaired cysteine residues, the common point mutations induce a ligand-independent receptor activation by forming disulfide-linked receptor dimers, leading to activation of the Ras/MAPK, STAT or PI3K pathway [7]. FGFR3 mutations are reported in up to 50% of cancers of all stages from the lower and upper urinary tract with p.S249C being the most common mutation, found in 61% of cases [7]. Mutation is inversely correlated with tumor stage and grade [15], and mutated tumors are associated with a favorable clinical outcome [8, 15, 20]. Despite the high mutation frequencies in urothelial carcinoma, the role of FGFR3 mutations in squamous differentiated bladder cancers is not well defined. In our study 6 of 71 (8.5%) tumor samples (n = 3 pure squamous carcinomas and n = 3 mixed carcinomas) contained an FGFR3 p.S249C mutation, all of them being grade 2 or higher and stage 3 or higher. This is slightly less than the frequency in invasive urothelial carcinomas reported by the TCGA project (12%) [3] and the n = 126 UC samples of Helsten et al. (15%) [6]. Thus, we suggest that FGFR3 mutation (and FGFR3 mRNA expression) plays a minor role in squamous tumorigenesis. However, our survival analysis revealed an association between FGFR3 mutation and an increased risk of recurrence in squamous differentiated bladder cancers which has also been shown previously for low grade non-invasive UC [8]. Analysis of all invasive bladder cancer TCGA samples displayed a worse prognosis for tumors with p.S249C mutation, whereas other FGFR3 mutations were associated with good prognosis (data not shown). Thus, mutation analysis potentially allows a further stratification of patients, and should be further evaluated in larger cohorts of invasive tumors.
Interestingly, there was no difference between pure squamous cell carcinoma and mixed carcinomas with squamous differentiation, and validation by a subgroup analysis of the “squamous-like” TCGA subgroup showing 4.9% of FGFR3 mutations corroborated our results. In addition, mRNA expression analysis of the “squamous-like” TCGA subgroup confirmed generally low levels of FGFR1-3 mRNA in tumors, except in FGFR3 mutated ones. Consistent with these findings, five of the six tumors (83.3%) harboring FGFR3 mutations also showed enhanced FGFR3 protein expression, i.e. Tomlinson Score 2 or 3. This observation is consistent with the reported correlation of FGFR3 overexpression and mutation in urothelial bladder cancer [15, 21]. Overall, protein expression of FGFR1, 2 and 3 was weak and we could not verify an overexpression of FGFR2 in squamous bladder cancers (18%) as reported by Youssef et al. in their squamous bladder cancer cohort from Egypt [22]. However, irrespective of the presence of FGFR3 mutation, increased FGFR3 protein expression was found in 16/64 (25%) of our squamous differentiated cancers, mostly in G3 tumors (75%). The mechanism of protein overexpression in wild-type tumors is still not fully understood [15]. Statistical analysis of our cohort showed no significant association of FGFR3 overexpression (i.e. Tomlinson Score 3) with recurrence free (RFS), disease specific (DSS) or overall survival (OS) (data not shown). This is in line with previous results of our group for FGFR3 in urothelial carcinomas [9]. However, Sung et al. reported a worse prognosis (OS, DSS) of FGFR3 overexpressing muscle-invasive bladder cancers treated with adjuvant chemotherapy [23]. Due to lack of treatment information for our cohort we could not further analyze refined subgroups, but probably such a subgroup would benefit from targeted anti-FGFR3 therapy.
In light of our novel findings, we suggest a minor role for FGFR alterations in the small subgroup of non-bilharzial squamous bladder cancers. However, bearing in mind that recurrence-free survival is an indicator for disease severity and risk of progression, FGFR3 mutations in squamous differentiated bladder tumors may indicate potential for FGFR inhibitor treatment in these tumors. This will be particularly interesting as some FGFR inhibitors have been approved by the FDA for the treatment of solid cancers. Currently five clinical trials (www.clinicaltrials.gov [24]; identifier NCT02401542, NCT02529553, NCT02278978, NCT01732107, NCT01004224) are assessing the effects of FGFR inhibitors in bladder and other cancers.
MATERIALS AND METHODS
Patient samples, data and ethics
Tissue microarrays (TMA) of previously characterized formalin-fixed, paraffin-embedded squamous differentiated bladder cancer specimens were used [25]. The residual TMAs contained 34 cases of pure squamous cell carcinomas (5 pT2, 24 pT3, 5 pT4) and 39 cases with mixed squamous and urothelial differentiation (5 pT2, 31 pT3, 3 pT4). Mixed tumors used for subsequent analyses contained at least 33.3% of squamous cells. Varying numbers of evaluated cases were due to limited experimental or clinical follow up data.
The local Ethics Committee approved the anonymous use of samples and clinico-pathological data (EK 173/06, 9/12). Clinico-pathological and follow-up data of patients are shown in Supplementary Data S4.
Fluorescence in situ hybridization analysis (FISH)
Hybridization of ZytoLight Dual Color Probes SPEC FGFR1/CEN 8, SPEC FGFR2/CEN 10, SPEC FGFR3/CEN 4 and ZytoLight SPEC FGFR3 Dual Color Break Apart Probe (Zytovision, Bremerhaven, Germany) onto 3 μm TMA sections was performed according to the manufacturer’s protocols. Slides were reviewed on a Zeiss Axiovert 135 fluorescence microscope (Carl Zeiss, Oberkochen, Germany), and Diskus Software (Büro Hilgers, Königswinter, Germany) was used to capture images from different channels/filters (AHF ZyGreen F36-720, AHF ZyOrange F36-740, AHF DAPI, AHF F56-700). The numbers of FGFR signals and centromere signals were counted in 60 nuclei of tumor cells at high magnification (x1000), and the FGFR/centromere ratio was classified into high- and low-level amplifications or a normal ratio as previously defined [13]. Likewise, 60 tumor cell nuclei were analyzed for break apart events (split signals with minimal distance of two signals or single signals). Specimens were classified “positive for FGFR3 rearrangements” according to a calculated cut off value, determined on 60 nuclei of normal urothelium, using the Microsoft Excel BETAINV function reported by Wolff et al. [14].
DNA isolation and FGFR3 mutation analysis
As described previously, tumor DNA was extracted from microdissected serial sections of the residual tissue blocks using QIAamp™ DNA Mini Kit (Qiagen, Hilden, Germany) [9]. Analysis of 11 known activating FGFR3 point mutations was performed by SNaPshot® Multiplex System assay (Applied Biosystems, Foster City, USA) as described previously [26, 27].
RNA-isolation, cDNA-synthesis and PCR-fragment analysis for FGFR3 gene fusions
RNA was extracted from either microdissected FFPE samples using the RNEasy FFPE Kit (Qiagen, Hilden, Germany) or microdissected from frozen tissue using the Arcturus® PicoPure® RNA Isolation Kit (Applied Biosystems/Life Technologies, Foster City, USA) according to the manufacturer’s instructions. cDNA was synthesized with Promega Kit A3500 (Promega, Madison, WI, USA).
FGFR3-TACC3 fusions were assessed by PCR, adapted from Williams et al. [10], using an FGFR3 forward primer (positioned in FGFR3 exon 18) and four different reverse primers localized in exons 4, 9, 11 and 13 of TACC3 covering the most common FGFR3-TACC3 fusions (for primer sequences and expected PCR product sizes see Supplementary Data S5A and S5B). RT4 cell line cDNA was used as a positive control for the fusion PCRs and cDNA quality was tested with a control PCR (both primers localized on FGFR3: FGFR3 14F and FGFR3 16R) resulting in a 400 bp product.
Immunohistochemical analysis of FGFR1-3 protein expression
Immunohistochemical staining for FGFR1, FGFR2 and FGFR3 was performed on 3 μm TMA sections after heat-induced antigen retrieval (EnVision™ FLEX Target Retrieval Solution, Low pH, K8005, DAKO PT-Link, DAKO, Hamburg, Germany) according to the manufacturer’s protocols. The primary antibodies (anti-FGFR3, mouse monoclonal clone B9, dilution 1:25 (Santa Cruz Biotechnology, Heidelberg, Germany), anti-FGFR2, mouse monoclonal clone 1G3, dilution 1:400 (www.antikoerper-online.de, Aachen, Germany) and anti-FGFR1, rabbit polyclonal, dilution 1:100 (Sigma, St. Louis, MO, USA)) were linked with DAKO EnVision™FLEX system and visualized with DAKO Liquid DAB Substrate Chromogen System in a DAKO Autostainer plus (K8024, K3468, DAKO). FGFR1, FGFR2 and FGFR3 positivity was assessed according to a semi-quantitative scoring system reported by Tomlinson et al. [15].
Validation of FGFR alterations in an independent set of “squamous-like” bladder cancers
For external validation datasets of a “squamous-like” subtype of chemotherapy-naive, high-grade muscle-invasive urothelial bladder carcinomas from The Cancer Genome Atlas (TCGA) were used [3]. Subtyping was performed based on mRNA expression information (Illumina Genome Analyzer and Illumina HiSeq 2000 RNASeqV2 Platforms; Level 3) of all currently accessible tumor samples (https://tcga-data.nci.nih.gov/tcga/findArchives.htm) [28] as previously published (for details see Supplementary Data S6) [16]. This approach identified 85 bladder cancer samples with a “squamous-like” gene expression profile from all 408 bladder cancer samples. For clinico-pathological parameters of the TCGA cohort see Supplementary Data S7.
Data on gene copy number variations (CNV; Affymetrix Genome-Wide SNP Array 6.0 with a fixed probe set and Illumina HiSeq Platforms; Level 3), somatic mutations (Illumina Genome Analyzer and Illumina HiSeq2000 DNASeq Platform; Level 3), and mRNA expression were analyzed. For samples with CNV data from both platforms or multiple segments within the gene region, values were summarized by extracting the maximum absolute value. Deviating from this one tile that was based on two probes, likely caused by a SNP, was removed for CNV analysis of FGFR1 in one sample (TCGA-ZF-AA4N-01). Data on somatic mutations were joined and a gene was assessed as mutated, if at least one non-silent mutation was reported within the gene body. Quantile normalized mRNA expression values were log2-transformed to reduce skewness prior to any statistical tests.
Statistical analysis
Statistical analyzes of our experimental data were accomplished with SPSS software version 22.0 (SPSS Inc., Chicago, USA). Two-sided p-values less than 0.05 were considered significant. Statistical associations between clinico-pathological and molecular factors were determined by Fisher’s exact test. Survival curves for recurrence-free survival (RFS), disease-specific survival (DSS) and overall survival (OS) were calculated using the Kaplan-Meier method with log-rank statistics. RFS/DSS/OS were measured from surgery until local or distant relapse/tumor death/death and were censored for patients alive without evidence of relapse/tumor related death/death at the last follow-up. Multivariate Cox-regression analysis was performed to test for an independent prognostic value of FGFR3 mutations.
The evaluation of TCGA data was performed in R [29]. For cluster analysis routines from additional software packages were used (Supplemental Digital Content 4) [30–34]. Pairwise comparison of mRNA expression between groups was tested by Welch’s t-test. Correlations between the expression of genes were determined by Spearman rank correlation coefficient.
ACKNOWLEDGMENTS
The authors thank all contributing pathologists/urologists and the German Bladder Cancer Network (especially Elke Eltze, Edwin Herrmann, Marieta Toma, Sabine Siegert, Stefan Denzinger, Tobias Grimm, Tumorzentrum Regensburg e.V.) for providing study material. Furthermore, we greatly appreciate the help of Antonio Sechi, Institute of Biomedical Engineering, Department of Cell Biology, University Hospital RWTH Aachen, regarding the acquisition of high quality FISH photographs for this publication using a Zeiss Axiovert 200 microscope, and Katherine A. Hoadley, UNC Lineberger Comprehensive Cancer Center, University of North Carolina, Chapel Hill, for support with the re-clustering analysis.
We are grateful for the technical support given by the laboratory staff of the Institute of Pathology RWTH Aachen University and the Institute of Pathology University Hospital Erlangen.
CONFLICTS OF INTEREST
The authors declare that they have no conflicts of interest.
GRANT SUPPORT
This study was supported by START-funds of the Medical Faculty of the RWTH Aachen University (NTG grant number: 42/13).
REFERENCES
1. Shen SS, Al-Ahmadie H, Mahfouz SM Squamous cell neoplasms. Tumous of the urinary tract. In: Moch H, Humphrey PA, Ulbright TM, Reuter VE, eds. WHO Classification of Tumours of the Urinary System and Male Genital Organs (4th edition). Lyon: IARC Press; 2016:108–110.
2. Choi W, Porten S, Kim S, Willis D, Plimack ER, Hoffman-Censits J, Roth B, Cheng T, Tran M, Lee IL, Melquist J, Bondaruk J, Majewski T, et al. Identification of distinct basal and luminal subtypes of muscle-invasive bladder cancer with different sensitivities to frontline chemotherapy. Cancer Cell. 2014; 25:152–65. doi: 10.1016/j.ccr.2014.01.009.
3. Cancer Genome Atlas Research N. Comprehensive molecular characterization of urothelial bladder carcinoma. Nature. 2014; 507: 315–22. doi: 10.1038/nature12965.
4. Sjodahl G, Lauss M, Lovgren K, Chebil G, Gudjonsson S, Veerla S, Patschan O, Aine M, Ferno M, Ringner M, Mansson W, Liedberg F, Lindgren D, et al. A molecular taxonomy for urothelial carcinoma. Clin Cancer Res. 2012; 18: 3377–86. doi: 10.1158/1078-0432.CCR-12-0077-T.
5. Zargar-Shoshtari K, Sverrisson EF, Sharma P, Gupta S, Poch MA, Pow-Sang JM, Spiess PE, Sexton WJ. Clinical Outcomes After Neoadjuvant Chemotherapy and Radical Cystectomy in the Presence of Urothelial Carcinoma of the Bladder With Squamous or Glandular Differentiation. Clin Genitourin Cancer. 2016; 14:82–8. doi: 10.1016/j.clgc.2015.08.006.
6. Helsten T, Elkin S, Arthur E, Tomson BN, Carter J, Kurzrock R. The FGFR Landscape in Cancer: Analysis of 4,853 Tumors by Next-Generation Sequencing. Clin Cancer Res. 2016; 22:259–67. doi: 10.1158/1078-0432.CCR-14-3212.
7. di Martino E, Tomlinson DC, Knowles MA. A Decade of FGF Receptor Research in Bladder Cancer: Past, Present, and Future Challenges. Adv Urol. 2012; 2012:429213. doi: 10.1155/2012/429213.
8. Hernandez S, Lopez-Knowles E, Lloreta J, Kogevinas M, Amoros A, Tardon A, Carrato A, Serra C, Malats N, Real FX. Prospective study of FGFR3 mutations as a prognostic factor in nonmuscle invasive urothelial bladder carcinomas. J Clin Oncol. 2006; 24:3664–71. doi: 10.1200/JCO.2005.05.1771.
9. Fischbach A, Rogler A, Erber R, Stoehr R, Poulsom R, Heidenreich A, Schneevoigt BS, Hauke S, Hartmann A, Knuechel R, Veeck J, Gaisa NT. Fibroblast growth factor receptor (FGFR) gene amplifications are rare events in bladder cancer. Histopathology. 2015; 66:639–49. doi: 10.1111/his.12473.
10. Williams SV, Hurst CD, Knowles MA. Oncogenic FGFR3 gene fusions in bladder cancer. Hum Mol Genet. 2013; 22:795–803. doi: 10.1093/hmg/dds486.
11. Weiss J, Sos ML, Seidel D, Peifer M, Zander T, Heuckmann JM, Ullrich RT, Menon R, Maier S, Soltermann A, Moch H, Wagener P, Fischer F, et al. Frequent and focal FGFR1 amplification associates with therapeutically tractable FGFR1 dependency in squamous cell lung cancer. Sci Transl Med. 2010; 2:62ra93. doi: 10.1126/scitranslmed.3001451.
12. Dutt A, Ramos AH, Hammerman PS, Mermel C, Cho J, Sharifnia T, Chande A, Tanaka KE, Stransky N, Greulich H, Gray NS, Meyerson M. Inhibitor-sensitive FGFR1 amplification in human non-small cell lung cancer. PLoS One. 2011; 6:e20351. doi: 10.1371/journal.pone.0020351.
13. Schildhaus HU, Heukamp LC, Merkelbach-Bruse S, Riesner K, Schmitz K, Binot E, Paggen E, Albus K, Schulte W, Ko YD, Schlesinger A, Ansen S, Engel-Riedel W, et al. Definition of a fluorescence in-situ hybridization score identifies high- and low-level FGFR1 amplification types in squamous cell lung cancer. Mod Pathol. 2012; 25:1473–80. doi: 10.1038/modpathol.2012.102.
14. Wolff DJ, Bagg A, Cooley LD, Dewald GW, Hirsch BA, Jacky PB, Rao KW, Rao PN, Association for Molecular Pathology Clinical Practice; American College of Medical Genetics Laboratory Quality Assurance. Guidance for fluorescence in situ hybridization testing in hematologic disorders. J Mol Diagn. 2007; 9:134–43. doi: 10.2353/jmoldx.2007.060128.
15. Tomlinson DC, Baldo O, Harnden P, Knowles MA. FGFR3 protein expression and its relationship to mutation status and prognostic variables in bladder cancer. J Pathol. 2007; 213:91–8. doi: 10.1002/path.2207.
16. Hoadley KA, Yau C, Wolf DM, Cherniack AD, Tamborero D, Ng S, Leiserson MD, Niu B, McLellan MD, Uzunangelov V, Zhang J, Kandoth C, Akbani R, et al. Multiplatform analysis of 12 cancer types reveals molecular classification within and across tissues of origin. Cell. 2014; 158:929–44. doi: 10.1016/j.cell.2014.06.049.
17. Goke F, Bode M, Franzen A, Kirsten R, Goltz D, Goke A, Sharma R, Boehm D, Vogel W, Wagner P, Lengerke C, Kristiansen G, Kirfel J, et al. Fibroblast growth factor receptor 1 amplification is a common event in squamous cell carcinoma of the head and neck. Mod Pathol. 2013; 26:1298–306. doi: 10.1038/modpathol.2013.58.
18. Wang R, Wang L, Li Y, Hu H, Shen L, Shen X, Pan Y, Ye T, Zhang Y, Luo X, Zhang Y, Pan B, Li B, et al. FGFR1/3 tyrosine kinase fusions define a unique molecular subtype of non-small cell lung cancer. Clin Cancer Res. 2014; 20:4107–14. doi: 10.1158/1078-0432.CCR-14-0284.
19. Singh D, Chan JM, Zoppoli P, Niola F, Sullivan R, Castano A, Liu EM, Reichel J, Porrati P, Pellegatta S, Qiu K, Gao Z, Ceccarelli M, et al. Transforming fusions of FGFR and TACC genes in human glioblastoma. Science. 2012; 337:1231–5. doi: 10.1126/science.1220834.
20. Neuzillet Y, van Rhijn BW, Prigoda NL, Bapat B, Liu L, Bostrom PJ, Fleshner NE, Gallie BL, Zlotta AR, Jewett MA, van der Kwast TH. FGFR3 mutations, but not FGFR3 expression and FGFR3 copy-number variations, are associated with favourable non-muscle invasive bladder cancer. Virchows Arch. 2014; 465:207–13. doi: 10.1007/s00428-014-1596-4.
21. Bodoor K, Ghabkari A, Jaradat Z, Alkhateeb A, Jaradat S, Al-Ghazo MA, Matalka I, Musleh H, Haddad Y. FGFR3 mutational status and protein expression in patients with bladder cancer in a Jordanian population. Cancer Epidemiol. 2010; 34:724–32. doi: 10.1016/j.canep.2010.05.003.
22. Youssef RF, Kapur P, Mosbah A, Abol-Enein H, Ghoneim M, Lotan Y. Role of fibroblast growth factor in squamous cell carcinoma of the bladder: prognostic biomarker and potential therapeutic target. Urol Oncol. 2015; 33:111 e1–7. doi: 10.1016/j.urolonc.2014.09.020.
23. Sung JY, Sun JM, Chang Jeong B, Il Seo S, Soo Jeon S, Moo Lee H, Yong Choi H, Young Kang S, Choi YL, Young Kwon G. FGFR3 overexpression is prognostic of adverse outcome for muscle-invasive bladder carcinoma treated with adjuvant chemotherapy. Urol Oncol. 2014; 32:49 e23–31. doi: 10.1016/j.urolonc.2013.07.015.
24. ClinicalTrials.gov Bethesda, MD: U.S. National Library of Medicine, National Institutes of Health; 1993. Updated daily.
25. Gaisa NT, Braunschweig T, Reimer N, Bornemann J, Eltze E, Siegert S, Toma M, Villa L, Hartmann A, Knuechel R. Different immunohistochemical and ultrastructural phenotypes of squamous differentiation in bladder cancer. Virchows Arch. 2011; 458:301–12. doi: 10.1007/s00428-010-1017-2.
26. Hafner C, van Oers JM, Vogt T, Landthaler M, Stoehr R, Blaszyk H, Hofstaedter F, Zwarthoff EC, Hartmann A. Mosaicism of activating FGFR3 mutations in human skin causes epidermal nevi. J Clin Invest. 2006; 116:2201–7. doi: 10.1172/JCI28163.
27. van Oers JM, Lurkin I, van Exsel AJ, Nijsen Y, van Rhijn BW, van der Aa MN, Zwarthoff EC. A simple and fast method for the simultaneous detection of nine fibroblast growth factor receptor 3 mutations in bladder cancer and voided urine. Clin Cancer Res. 2005; 11:7743–8. doi: 10.1158/1078-0432.CCR-05-1045.
28. The Cancer Genome Atlas [database online]. Bethesda, MD: National Cancer Institute; 2005. Updated monthly.
29. A language and environment for statistical computing [computer program]. Version 3.2.2. Vienna, Austria: R Foundation for Statistical Computing; 2015.
30. ConsensusClusterPlus [computer program]. R package version 1.24.0. Wilkerson M and Waltman P; 2013.
31. Langfelder P, Horvath S. WGCNA: an R package for weighted correlation network analysis. BMC Bioinformatics. 2008; 9:559. doi: 10.1186/1471-2105-9-559.
32. Langfelder P, Horvath S. Fast R Functions for Robust Correlations and Hierarchical Clustering. J Stat Softw. 2012; 46:i11.
33. dplyr: A Grammar of Data Manipulation [computer program]. Version 0.4.3. Vienna, Austria: R Foundation for Statistical Computing Wickham H FR.; 2015.
34. Wilkerson MD, Hayes DN. ConsensusClusterPlus: a class discovery tool with confidence assessments and item tracking. Bioinformatics. 2010; 26:1572–3. doi: 10.1093/bioinformatics/btq170.