
INTRODUCTION
Despite the therapy development in recent years, gastric cancer (GC) remains one of the leading causes of cancer death in the world [1], partly due to the absence of effective therapeutic targets and prognostic markers. Dozens of molecules predictive for cancer progression and prognosis are discovered each year, whereas seldom is applied in clinical settings because of limited consistency between biological and clinical data and low repeatability of multiple studies with different samples or methods [2].
Yet remarkably, the unique matricellular glycoprote Secreted Protein Acidic and Rich in Cysteine (SPARC) is gaining increasing attention, either for its extensive biological effect on tumor development, invasion, metastasis, angiogenesis and inflammation by mediating cell-microenvironment interaction [3], or for the predictive potential for the efficacy of nanoparticle albumin-bound (NAB) chemotherapy drugs via inducing drug accumulation [4]. Biologically, SPARC was found to promote cancer development in some tumors with highly metastatic characteristics, such as breast cancer and melanoma, but act as a tumor suppressor in some other cancer types [5, 6]. Clinically, SPARC has been uncovered as the potential prognostic marker in several cancer types [7–9].
In GC, the function of SPARC is still controversial. Some clinical studies identified SPARC as a predictor of worse prognosis for GC [10–12], whereas others found insignificant/inverse results using comparable methods [13, 14]. So far, there was only one meta-analysis for the prognostic value of SPARC in GC. However, one study showing maximum weight in the fix-effect meta-analysis extracted data based on the non-SPARC-specific survival curve [15]. Meanwhile, some laboratory studies on cell lines and animal models showed that SPARC could attenuate the angiogenesis but inhibit the proliferation of tumor [16–18], whereas others indicated SPARC to promote cancer development, invasion and metastasis [19]. Therefore, the overall role of SPARC in GC remains to be unraveled either biologically, clinically or systematically.
The current study revealed the clinicopathological significance of SPARC in GC based on 4 distinct lines of investigation. SPARC was the potential predictor for the progression and prognosis of GC, as demonstrated by the IHC evaluation of our own cohort of 137 GC cases, externally validated by a meta-analysis of 5 English-published studies, and further supported by the bioinformatical assay of online dataset, and our own cellular experiments.
RESULTS
Patient characteristics
As shown in Table 1, the cohort contained 137GC patients (103 men, 34 women), and the median age at surgery was 60 years old. D2 lymph node dissection was performed in 131 cases. Based on the criteria of American Joint Committee on Cancer (AJCC) (7th edition), the majority (78.1%) of patients had advanced TNM stage, and unexpected metastases were found in 4 cases (2.9%) during the surgery and postoperative pathology examination. Patients with stage I–II did not receive adjuvant chemotherapy. Patients with stage III received 5-fluorouracil (5-Fu) based adjuvant chemotherapy. Patients with stage IV received salvage chemotherapy. The median survival duration was 1028 days (range: 8–1859 days).
Table 1: Characteristics of the gastric cancer study cohort
Characteristics |
Number of patients (%) |
|---|---|
Age (years) |
|
Median (range) |
60.0 (38.0–78.0) |
Gender |
|
Female |
34 (24.8) |
Male |
103 (75.2) |
Surgery D2 |
|
Yes |
131 (95.6) |
No |
6 (4.4) |
Location |
|
Fundus & cardia |
8 (5.8) |
Body |
55 (40.1) |
Antrum & pylous |
74 (54.0) |
Differentiation |
|
Well & moderate |
62 (45.3) |
Poor & mixed |
75 (54.7) |
Lauren type |
|
Intestinal |
59 (43.1) |
Diffused |
78 (56.9) |
T stage |
|
T1–T3 |
29 (21.2) |
T4 |
108 (78.8) |
N stage |
|
N0 |
31 (22.6) |
N1–N3 |
106 (77.4) |
M stage |
|
M0 |
133 (97.1) |
M1 |
4 (2.9) |
TNM Stage |
|
I & II |
30 (21.9) |
III & IV |
107 (78.1) |
SPARC expression and its association with clinicopathological variables
SPARC staining was weak in cancer cells, while exhibited a relatively strong signal in the cytoplasm of surrounding stromal cells. Among the 137 cancer specimens in the current study, 84 (61.3%) demonstrated high immunoactivity of SPARC (Figure 1). The association of SPARC expression with clinicopathological characteristics of the cohort is shown in Table 2. Enhanced SPARC staining was significantly correlated with differentiation (P = 0.01) and Lauren type (P = 0.02) of cancer, but not with the other clinicopathological variables, such as the age and gender of patients, and the surgical procedure, location, invasion depth, lymph node involvement, and distant metastasis of cancers.
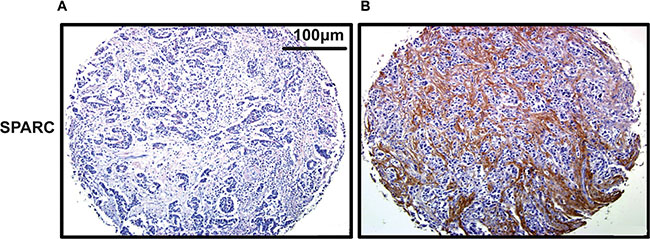
Figure 1: Representative staining of SPARC in gastric cancer tissue by IHC (200×). (A) No staining of SPARC in cancer tissue; (B) Positive SPARC staining in the surrounding desmoplastic stroma.
Table 2: Association of SPARC expression in cancer stroma with clinicopathologic parameters
Characteristics |
Low expression of SPARC, n (%) |
High expression of SPARC, n (%) |
P-value |
|---|---|---|---|
Age (years) |
|
|
0.56 |
Mean +/− SD |
60.2 +/− 10.7 |
59.1 +/− 10.2 |
|
Gender |
|
|
0.73 |
Female |
14 (26.4) |
20 (23.8) |
|
Male |
39 (73.6) |
64 (76.2) |
|
Surgery D2 |
|
|
0.88 |
Yes |
50 (94.3) |
81 (96.4) |
|
No |
3 (5.7) |
3 (3.6) |
|
Location |
|
|
0.06 |
Fundus & cardia |
4 (7.5) |
4 (4.8) |
|
Body |
16 (30.2) |
39 (46.4) |
|
Antrum & pylous |
33 (62.3) |
41 (48.8) |
|
Differentiation |
|
|
0.01 |
Well & moderate |
32 (60.4) |
30 (35.7) |
|
Poor & mixed |
21 (39.6) |
54 (64.3) |
|
Lauren type |
|
|
0.02 |
Intestinal |
30 (56.6) |
29 (34.5) |
|
Diffused |
23 (43.4) |
55 (65.5) |
|
T stage |
|
|
0.46 |
T1–T3 |
9 (17.0) |
20 (23.8) |
|
T4 |
44 (83.0) |
64 (76.2) |
|
N stage |
|
|
0.83 |
N0 |
13 (24.5) |
18 (21.4) |
|
N1–N3 |
40 (75.5) |
66 (78.6) |
|
M stage |
|
|
0.96 |
M0 |
52 (98.1) |
81 (96.4) |
|
M1 |
1 (1.9) |
3 (3.6) |
|
Influence of SPARC expression on survival
In a Kaplan-Meier (KM) analysis, SPARC expression was significantly related with overall survival (OS), and patients with high SPARC expression usually demonstrated shorter OS (log-rank P = 0.022) (Figure 2). Univariate analysis using COX proportional hazard (PH) models showed that advanced T stage, presence of lymph node metastasis, and high SPARC expression significantly predicted reduced OS (P = 0.007, 0.001, and 0.024, respectively) (Table 3). In the multivariate COX PH analysis, SPARC expression (Hazard ratio (HR) = 1.835, P = 0.022), surgical procedure (HR = 0.296, P = 0.024), T stage (HR = 3.032, P = 0.005), and N-stage (HR = 3.866, P = 0.002) were revealed independent indicators for OS, and the prognostic model for GC were further validated using 1000 times bootstrapping (Table 3). Moreover, the predictive ability of the prognostic model was slightly improved by the inclusion of SPARC level (Figure 3), as demonstrated by the increase of the resulting area under the curve (AUC) value from 0.798 to 0.811 at the 5th year of follow up.
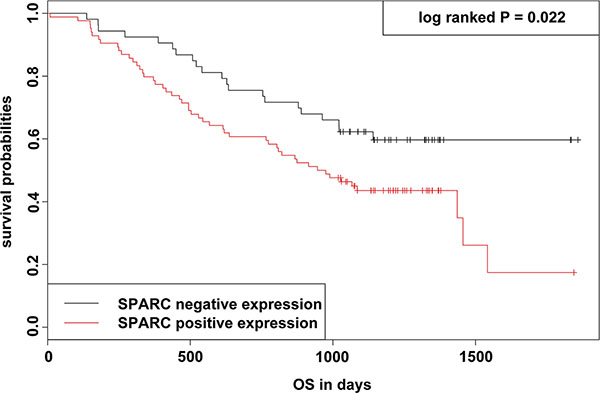
Figure 2: KM survival curve and log-rank test for patients classified as showing either positive or negative SPARC expression in GC. Patients with SPARC high expression exhibited a significant worse survival than those with SPARC low expression (P = 0.022; log-rank test).
Table 3: Univariate and multivariate analyses of overall survival according to clinicopathological parameters and SPARC levels with 1000 bootstraping
Characteristics |
No |
Uni–variant analysis |
Multi–variant analysis |
||||||
|---|---|---|---|---|---|---|---|---|---|
Patients |
Events |
HR |
95% CI |
P–value |
HR |
95% CI |
P–value |
Bootstrapping 95% CI |
|
Age (years) |
137 |
71 |
1.011 |
0.988–1.034 |
0.368 |
|
|
|
|
Gender |
|
|
1.124 |
0.635–1.988 |
0.689 |
|
|
|
|
Female |
34 |
15 |
|
|
|
|
|
|
|
Male |
103 |
56 |
|
|
|
|
|
|
|
Surgery D2 |
|
|
0.508 |
0.185–1.396 |
0.189 |
0.296 |
0.103–0.852 |
0.024 |
0.076–0.847 |
Yes |
131 |
67 |
|
|
|
|
|
|
|
No |
6 |
4 |
|
|
|
|
|
|
|
Location |
|
|
0.750 |
0.516–1.089 |
0.130 |
|
|
|
|
Fundus & cardia |
8 |
6 |
|
|
|
|
|
|
|
Body |
55 |
31 |
|
|
|
|
|
|
|
Antrum & pylous |
74 |
34 |
|
|
|
|
|
|
|
Differentiation |
|
|
1.047 |
0.655–1.675 |
0.847 |
|
|
|
|
Well & moderate |
62 |
33 |
|
|
|
|
|
|
|
Poor & mixed |
75 |
38 |
|
|
|
|
|
|
|
Lauren type |
|
|
1.627 |
0.998–2.650 |
0.051 |
|
|
|
|
Intestinal |
59 |
25 |
|
|
|
|
|
|
|
Diffused |
78 |
46 |
|
|
|
|
|
|
|
T stage |
|
|
2.769 |
1.313–5.837 |
0.007 |
3.032 |
1.394–6.594 |
0.005 |
1.608–8.174 |
T1–T3 |
29 |
8 |
|
|
|
|
|
|
|
T4 |
108 |
63 |
|
|
|
|
|
|
|
N stage |
|
|
3.917 |
1.692–9.067 |
0.001 |
3.866 |
1.664–8.982 |
0.002 |
1.865–10.979 |
N0 |
31 |
6 |
|
|
|
|
|
|
|
N1–N3 |
106 |
65 |
|
|
|
|
|
|
|
M stage |
|
|
1.409 |
0.431–4.609 |
0.571 |
|
|
|
|
M0 |
133 |
68 |
|
|
|
|
|
|
|
M1 |
4 |
3 |
|
|
|
|
|
|
|
SPARC expression |
|
|
1.798 |
1.080–2.995 |
0.024 |
1.835 |
1.093–3.083 |
0.022 |
1.179–3.401 |
Negative |
53 |
21 |
|
|
|
|
|
|
|
Positive |
84 |
50 |
|
|
|
|
|
|
|
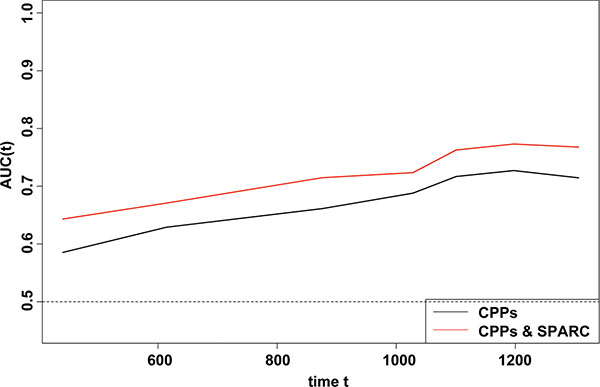
Figure 3: Time-dependent ROC analyses for the CPPs, and the combination of SPARC and CPPs. The inclusion of the SPARC expression score in the model improved the predictive ability slightly.
Additionally, survival analysis with online GC dataset (GSE62254) also showed that SPARC expression was significantly related with OS, and patients with high SPARC expression demonstrated shorter OS (log-rank P = 0.004) and disease free survival (DFS) (log-rank P < 0.001) (Supplementary Figure S3).
Meta-analysis for the prognostic role of SPARC in GC as an external validation
A PRISMA flow diagram of the literature search and selection is presented in Supplementary Figure S1. There were totally 5 studies including 566 patients (ranging from 43 to 227 patients per study) were included in the current meta-analysis and the main characteristics of the eligible studies were summarized in Supplementary Table S1. The pooled HR was calculated to unravel the association of SPARC expression with OS using the methods described in the Supplementary File S1. As the test for heterogeneity was significant (I2 = 66.8%, P = 0.0169), a random-effect model was used. High SPARC expression was highly correlated with reduced OS (pooled HR = 1.60, 95% confidence interval (CI): 1.01–2.53, transformed from lnHR and its 95% CI; Figure 4A), and the further chronologically cumulative meta-analysis demonstrated that our current study enhanced the combining effect favoring the prognostic role of SPARC in GC (pooled HR = 1.59, 95% CI: 1.12–2.23, transformed from lnHR and its 95% CI; Figure 4B). In addition, there was no publication bias of the eligible studies demonstrated by the funnel plot and an Egger’s test (P = 0.1404, Supplementary Figure S2).
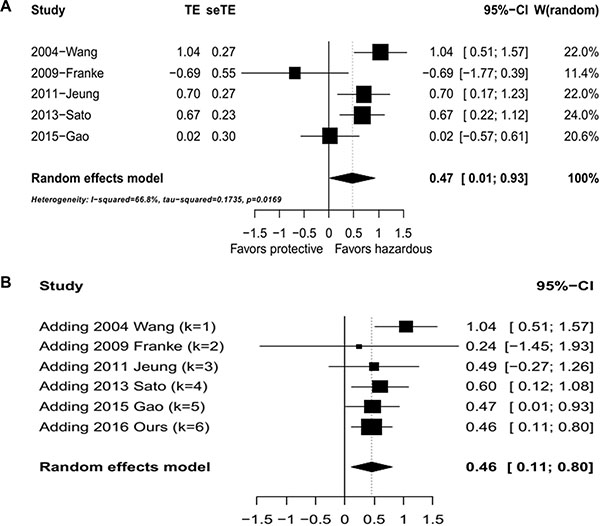
Figure 4: Meta analysis of overall survival against SPARC levels. (A) Hazard ratio plot of overall survival against SPARC levels. (B) Hazard ratio plot of studies of overall survival against SPARC expression with cumulative meta analysis.
Gene set enrichment analysis (GSEA) analysis for SPARC expression in GC
To investigate biologic characteristics shared by the different SPARC expression levels, we performed GSEA assay, a robust computational method that determines whether an a-priori defined set of genes shows statistically significant, concordant differences between both groups. The most significant pathways for both up- and down-regulated gene sets in the significance order (size of FWER P values) are listed in the Supplementary Table S2 and Figure 5.Three pathways, including “VECCHI_GASTRIC_CANCER_ADVANCED_VS_EARLY_UP”, “KIM_LRRC3B_TARGETS”,and “NOJIMA_SFRP2_TARGETS_UP”, were significant in SPARC high expression phenotype, and three pathways, including “VECCHI_GASTRIC_CANCER_ADVANCED_VS_EARLY_DN”, “KANG_DOXORUBICIN_RESISTANCE_UP”, and “KANG_FLUOROURACIL_RESISTANCE_DN”, were significant in SPARC low expression phenotype. The results indicated SPARC high expression induced GC progression and sensitivity to chemotherapy treatment such as adriamycin (Adr) and 5-Fu.
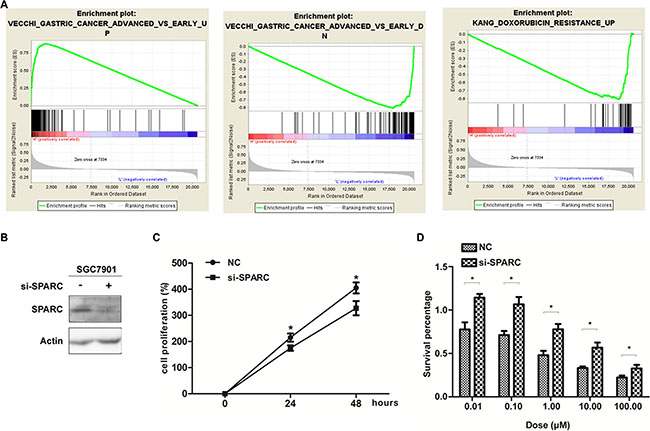
Figure 5: SPARC expression and GC proliferation as well as drug sensitivity properties. (A) The GSEA results showing the correlation of SPARC levels and GC related gene sets in MSigDB. gene set "gastric cancer advanced vs early up (Vecchi)" was enriched in SPARC high expression phonotype (left), gene sets "gastric cancer advanced vs early down (Vecchi)" (middle), and "doxorubicin resistance up (Kang)" (right), were enriched in SPARC low expression phonotype. (B) Western-blot analysis for the protein level of SPARC in SGC7901 transfected with SPARC siRNA for 24 hours. (C) MTT assay showing SPARC knock-down inhibited SGC7901proliferation compared with control cells. (D) MTT assay showing the Adr-sensitivity of SGC7901 with SPARC siRNA transfection for 24 hours. Each data point represents the mean ± SD of three independent experiments. (*P < 0.05).
SPARC increase Adr sensitivity demonstrated by cellular experiments
Our previous data showed a high expression level of SPARC in SGC7901 GC cell line [20]. SPARC was decreased in SGC7901/Adr cell line, comparing with the parental cell line SGC7901 (Supplementary Figure S4). This result is consistent with the findings in our microarray data, which compared the mRNA expression levels between SGC7901/Adr and SGC7901 with Affymetrix HGU133 Plus2 chips (data not shown). In order to confirm the induction of SPARC on Adr sensitivity, we did MTT experiment using siRNA to knock down SPARC expression in GC cell line SGC7901. The results indicated that Adr resistance was increased in SGC7901 cells with reduced SPARC expression.
DISCUSSION
The current study firstly investigated the clinicopathological significance and the potential function of SPARC in GC simultaneously with multiple methods including IHC assay, meta-analysis, bioinformatical assay, and cellular experiments. The IHC staining of our own 137 GC specimens revealed that high SPARC expression significantly correlated with poorer differentiation and diffuse type of cancer, and independently predicted shorter OS. The meta-analysis of 5 available English publications on PubMed further validated SPARC to be an independent predictor for worse prognosis of GC patients. Using online data GSE62254, survival analysis confirmed the prognostic value of SPARC in GC, and GSEA results demonstrated the association of high SPARC expression with GC progression and sensitivity to treatment of Adr and 5-Fu. Further cellular experiments confirmed the induction of Adr sensitivity by SPARC in GC.
Similar to our results, the close association between SPARC expression and worse differentiation was previously observed in ovarian and prostate cancer, and was supposed to be due to the modulation of SPARC on the cell-matrix interactions [21, 22]. These results might be explained by the following clues: GC cell differentiation was accompanied with decreased expression of WNT signaling, and the activated WNT signal could increase the expression of SPARC [23, 24]. The correlation between WNT/SPARC and GC differentiation would be an intriguing topic for further investigation. It was also noticed that SPARC expression was either statistically meaningless for the prediction of cancer differentiation or significantly related with better cancer differentiation in some previous studies in GC [10, 12]. We supposed that the discrepant conclusions from the above studies might attribute to the heterogeneity of GC.
The previous clinical studies could not get a consistent conclusion about the association of SPARC with patient survival. We currently demonstrated SPARC to be the independent predictor for reduced OS in GC. Combining our current study and the previous report, the prognostic role of SPARC on GC is made robust based on the following several lines of evidence: 1) The current immunohistochemistry (IHC) assay was performed on a cohort of more than one hundred cases, and validated by a strict bootstrapping procedure; 2) The cumulative meta-analysis combining with our current IHC assay reached a consistent conclusion with a more narrow 95% CI, comparing with the non-cumulative analysis without our study; 3) Both survival analysis and GSEA results using an online dataset reached the coincident conclusion; and 4) Some previous biological experiments declared that down-regulation of SPARC could induce the growth and invasion recession of GC cells, and might explain the poor patient prognosis mediated by SPARC. All these suggested the potential value of this marker for clinical prognostic prediction in GC.
The distribution and the related function of SPARC in the stroma and cancer cells is an intriguing topic. We and some other scientists have demonstrated that SPARC in cancer cells could regulate the apoptosis, prohibit the angiogenesis and promote the invasion and the proliferation of tumors [18–20, 25]. In cancer stroma, SPARC regulates extracellular matrix (ECM) assembly, exhibits anti-adhesive function, and promotes emigration and invasion [3]. In our current meta-analysis, the expression of SPARC in GC, no matter the location, is the independent predictor for poor prognosis of patients, and the conclusion is well supported by all the aforementioned studies. Moreover, the relationship of SPARC overexpression with gastric-cancer progression is further confirmed by our study using GSEA and MTT assay.
The relationship between SPARC and chemotherapy drugs was another interesting topic. Anthracycline antibiotics are widely used in various chemotherapy regimens in combination with other drugs in GC. However, the efficacy is not entirely satisfactory due to drug resistance and no candidate predictor for drug sensitivity until now. The current results supported low expression of SPARC might predict Adr resistance in GC based on data derived from both GSEA and molecular experiment, and it was consistent with the findings in patients treated by Adr that higher SPARC expression predicted higher pathological complete remission rate in breast cancer and longer OS in diffuse large B-cell lymphoma, respectively [26, 27]. The potential mechanism was as follows: Adr-induced-apoptosis was enhanced by the activation of JNK [28], while Adr resistance was associated with the activation of AKT and the up-regulation of Notch1 and PTEN [29], respectively. Furthermore, SPARC was found to up-regulate the expression and activation of JNK [30], while suppress the activity of AKT and the signaling and expression of Notch1 [31–33], and the function of SPARC was negatively regulated by PTEN [34].
As for the relationship of SPARC and 5-FU, our preliminary results demonstrated that down regulation of SPARC in GC might enhance 5-FU sensitivity, which is distinct with the previous reports about SPARC in liver and colon cancers [35, 36], and the diversity is supposed to be related with the cancer type difference. Therefore, our future research would focus on the relationship of SPARC with 5-FU and other chemotherapy drugs in various cancers.
It was noticed that the percentage of male in our cohort was 75.2% (103/137), which seemed a little higher comparing with some other GC studies. However, as shown by the randomized clinical trials published in the recent 5 years, the ratio of male GC patients is between 64.6% and 73.9% (Supplementary Table S3). Then we randomly reviewed the high-quality retrospective studies for Chinese GC, and found the ratio of male GC patients to be about 57.8%–80.7% (Supplementary Table S3). Thus it was considered that there is no evidence for the impact of gender on the results of our study so far.
The heterogeneity of the current meta-analysis might be explained as follows. First, GC patients have different clinicopathological characteristics, such as age, race, TNM stage and the operation mode. In addition, only 2 of the 5 publications reported the patients’ status of postoperative adjuvant therapy, and no information about the salvage therapy was elucidated. Second, the detection method for SPARC is different. Two of the studies used RT-PCR, whereas the other 3 used IHC. Moreover, the difference of primer sequence, antibody, and the cut off value selected might result in the different features of SPARC detection, such as the positive rate of 50%–72% and the histological location in stroma/cancer cells. Third, the HR data were got from different statistical approaches, such as the survival plots, the original reports or the calculation results. All the above factors might lead to between-study heterogeneity. However, it is difficult to perform meta-regression due to the small number of the included studies. Further multi-center researches using standardized methods are encouraged.
In summary, to evaluate the relationship between SPARC expression and the clinicopathological variables and the prognosis of GC, an IHC-based study of 137 cases and a meta-analysis based on published papers on PubMed were performed. Further survival analysis and GSEA with online data supported above results and revealed a potential association between SPARC expression and chemotherapy sensitivity in GC. The aforementioned several lines of investigation came to the conclusion that increased SPARC expression led to a worse clinical outcome. It is noticed that the evaluation standard and the immunostaining location of IHC for SPARC are not uniform, which directly hamper the integration of the existed literatures. Thus further larger-sample studies with standardized IHC staining/evaluation criteria for SPARC were warranted in future. Our future plan is to perform some more cellular experiments to study the association between SPARC expression and chemo-sensitivity in various cancers.
MATERIALS AND METHODS
Patients and tumor specimens in the IHC assay
Human specimens were approved to be used by the Ethics Committee of China Medical University (CMU). Clinical medical records and follow-up data of primary GC patients underwent initial surgical resection from May 2006 to Sep. 2008 were reviewed, and the ones with complete information and available specimens were recruited in the current study, while those undergone endoscopic mucosal resection, palliative resection, or preoperative chemotherapy were excluded. The OS was set on the period from the date of surgery to death or the most recent clinic visit (Sep. 2012).
Formalin-fixed, paraffin-embedded blocks were obtained from the archives of the Department of Pathology of the First Hospital of CMU, and three pathologists examined all specimens to confirm histopathological features. Tumors were staged according to AJCC criteria
Tissue microarray and IHC
A tissue microarray was constructed in collaboration with Shanghai Biochip (Shanghai, China). Two punch cores of 1.0 mm were taken from the non-necrotic area of tumor foci or the corresponding non-tumor portion. IHC were performed as before [37] and the detailed protocol is shown in the Supplementary File S1. Negative control was obtained by the omission of the primary antibody in a slide with whole-tumor-section. All sections were evaluated blind by 2 experienced pathologists. If an inconsistency occurred, a third pathologist was consulted to achieve consensus. The staining intensity was scored as 0 (negative), 1 (weak), 2 (medium), and 3 (strong). Extent of staining was scored as 0 (0%), 1 (1 to 25%), 2 (26 to 50%), 3 (51 to 75%), and 4 (76 to 100%). The sum-indexes (−), (+), (++), and (+++) indicated final staining score of 0, 1–3, 4–5, and 6–7, respectively. For statistical analysis, sum-indexes (−) and (+) were defined as low SPARC expression, while sum-indexes (++) and (+++) were defined as high SPARC expression.
Statistical analysis for IHC data and meta-analysis
SPARC expression was analyzed as a dichotomous variable (Low VS High). Gender (Female VS Male), Surgery D2 (Yes VS No), Location (Fundus & cardia VS Body VS Antrum & pylorus), Differentiation (Well & moderate VS Poor & mixed), Lauren type (Intestinal VS Diffused), T stage (T1-T3 VS T4), N stage (N0 VS N1-3), and M stage (M0 VS M1) were considered as categorical variables. Age was measured as a continuous variable. The associations between SPARC expression and the categorical variables were tested with Chi-square test or Fisher exact test, as appropriate. Welch’s two-sample t-test was used to compute the P value for continuous variables.
Survival curves were plotted by the Kaplan-Meier (KM) method and compared with the log-rank test. HR and 95% CI was estimated using univariate and multivariate Cox PH models, respectively. Stepwise selection methods (including both “backward” and “forward” selection) were applied to construct the final multivariate model based on the Akaike information criterion (AIC) value. Internal validation of the final Cox model was checked with the estimation of covariable coefficients and 95% CIs using bootstrapping (1000 replications). The prediction accuracy of SPARC in the Cox model was assessed by the time-dependent receiver-operating characteristics (ROC) curves for the censored data. AUC was constructed according to Heagerty et al. [38], and the AUC (t) curve was plotted based on the evaluation of the risk scores to illustrate time-dependent sensitivity and specificity for the corresponding ROC curve at each observed event time.
A meta-analysis based on published literatures was used as an external validation. Using the methods described in the Supplementary File S1, clinicopathological variables including SPARC-detection method, SPARC positivity rate, HRs and the corresponding 95% CIs were collected, and the pooled HR of SPARC in GC was estimated.
Statistical analysis and meta-analysis were performed using R/meta software (R 3.0.2). All statistic tests in this study were two tailed with P < 0.05 as statistically significant, unless otherwise stated.
Microarray, survival analysis, and GSEA
Totally 39 GEO datasets on PubMed were found to be about GC and GSE62254 is the only dataset with survival data available which was listed in the supplementary table of the relevant paper (PMID: 25894828) [39]. Series matrix data of 300 GC tissues from Korean patients using HGU133plus2 Affymetrix chip was downloaded. SPARC expression was trisected into 3 levels: low, median, and high. The cutoff was set to 0.33 and 0.67. Survival curves were plotted by the Kaplan-Meier (KM) method and compared with the log-rank test.
Gene Set Enrichment Analysis (GSEA) was performed using the software GSEA v2.2.2 (www.broadinstitute.org/gsea). SPARC expression level was dichotomized as low and high categories to annotate phenotype, and GC related gene sets from MSigDB was used [40–46]. All other parameters were set based on their default values.
Cell culture, reagents and cellular experiments
The human GC cell line SGC7901 was obtained from the Academy of Military Medical Science (Beijing, China). The Adr -resistant variant of SGC7901 (SGC7901/Adr) was kindly provided by the Fourth Military Medical University (Xi’an, China). Antibodies for SPARC were obtained from Cell Signaling Technology (Beverly, MA, USA), and the secondary goat anti-rabbit and goat anti-mouse antibodies were purchased from Santa Cruz Biotechnology (Santa Cruz, CA, USA). Adriamycin sensitivity of SGC7901 with or without SPARC siRNA transfection was further investigated using MTT assay. The detailed information and the techniques for cell culture, Western Blot, siRNA, and MTT assay were described in our previous study elsewhere [20, 47] and the current Supplementary File S1.
CONFLICTS OF INTEREST
The authors declare that they have no conflicts of interest.
FUNDING
This work was supported in part by the National Natural Science Foundation of China (No. 81302023, No.81372546 and No.81201801), National Major Scientific and Technological Special Project (2013ZX09303002), and Science and Technology Projects of Liaoning Province (2014225013, 2014226033).
REFERENCES
1. Shen L, Shan YS, Hu HM, Price TJ, Sirohi B, Yeh KH, Yang YH, Sano T, Yang HK, Zhang X, Park SR, Fujii M, Kang YK, et al. Management of gastric cancer in Asia: resource-stratified guidelines. Lancet Oncol. 2013; 14:e535–547.
2. Bidard FC, Pierga JY, Soria JC, Thiery JP. Translating metastasis-related biomarkers to the clinic—progress and pitfalls. Nat Rev Clin Oncol. 2013; 10:169–179.
3. Chlenski A, Cohn SL. Modulation of matrix remodeling by SPARC in neoplastic progression. Semin Cell Dev Biol. 2010; 21:55–65.
4. Guarneri V, Dieci MV, Conte P. Enhancing intracellular taxane delivery: current role and perspectives of nanoparticle albumin-bound paclitaxel in the treatment of advanced breast cancer. Expert Opin Pharmacother. 2012; 13:395–406.
5. Tang L, Feng J. SPARC in Tumor Pathophysiology and as a Potential Therapeutic Target. Curr Pharm Des. 2014; 20:6182–90
6. Nagaraju GP, Dontula R, El-Rayes BF, Lakka SS. Molecular mechanisms underlying the divergent roles of SPARC in human carcinogenesis. Carcinogenesis. 2014; 35:967–973.
7. Sinn M, Sinn BV, Striefler JK, Lindner JL, Stieler JM, Lohneis P, Bischoff S, Blaker H, Pelzer U, Bahra M, Dietel M, Dorken B, Oettle H, et al. SPARC expression in resected pancreatic cancer patients treated with gemcitabine: results from the CONKO-001 study. Ann Oncol. 2014; 25:1025–1032.
8. Giallongo C, La Cava P, Tibullo D, Barbagallo I, Parrinello N, Cupri A, Stagno F, Consoli C, Chiarenza A, Palumbo GA, Di Raimondo F. SPARC expression in CML is associated to imatinib treatment and to inhibition of leukemia cell proliferation. BMC cancer. 2013; 13:60.
9. Wang HY, Li YY, Shao Q, Hou JH, Wang F, Cai MB, Zeng YX, Shao JY. Secreted protein acidic and rich in cysteine (SPARC) is associated with nasopharyngeal carcinoma metastasis and poor prognosis. J Transl Med. 2012; 10:27.
10. Sato T, Oshima T, Yamamoto N, Yamada T, Hasegawa S, Yukawa N, Numata K, Kunisaki C, Tanaka K, Shiozawa M, Yoshikawa T, Akaike M, Rino Y, et al. Clinical significance of SPARC gene expression in patients with gastric cancer. J Surg Oncol. 2013; 108:364–368.
11. Jeung HC, Rha SY, Im CK, Shin SJ, Ahn JB, Yang WI, Roh JK, Noh SH, Chung HC. A randomized phase 2 study of docetaxel and S-1 versus docetaxel and cisplatin in advanced gastric cancer with an evaluation of SPARC expression for personalized therapy. Cancer. 2011; 117:2050–2057.
12. Wang CS, Lin KH, Chen SL, Chan YF, Hsueh S. Overexpression of SPARC gene in human gastric carcinoma and its clinic-pathologic significance. Br J Cancer. 2004; 91:1924–1930.
13. Franke K, Carl-McGrath S, Rohl FW, Lendeckel U, Ebert MP, Tanzer M, Pross M, Rocken C. Differential Expression of SPARC in Intestinal-type Gastric Cancer Correlates with Tumor Progression and Nodal Spread. Transl Oncol. 2009; 2:310–320.
14. Gao YY, Han RB, Wang X, Ge SH, Li HL, Deng T, Liu R, Bai M, Zhou LK, Zhang XY, Ba Y, Huang DZ. Change of SPARC expression after chemotherapy in gastric cancer. Cancer Biol Med. 2015; 12:33–40.
15. Zhao ZS, Wang YY, Chu YQ, Ye ZY, Tao HQ. SPARC is associated with gastric cancer progression and poor survival of patients. Clin Cancer Res. 2010; 16:260–268.
16. Inoue M, Senju S, Hirata S, Ikuta Y, Hayashida Y, Irie A, Harao M, Imai K, Tomita Y, Tsunoda T, Furukawa Y, Ito T, Nakamura Y, et al. Identification of SPARC as a candidate target antigen for immunotherapy of various cancers. Int J Cancer. 2010; 127:1393–1403.
17. Wang L, Yang M, Shan L, Qi L, Chai C, Zhou Q, Yao K, Wu H, Sun W. The role of SPARC protein expression in the progress of gastric cancer. Pathol Oncol Res. 2012; 18:697–702.
18. Zhang JL, Chen GW, Liu YC, Wang PY, Wang X, Wan YL, Zhu J, Gao HQ, Yin J, Wang W, Tian ML. Secreted protein acidic and rich in cysteine (SPARC) suppresses angiogenesis by down-regulating the expression of VEGF and MMP-7 in gastric cancer. PloS one. 2012; 7:e44618.
19. Yin J, Chen G, Liu Y, Liu S, Wang P, Wan Y, Wang X, Zhu J, Gao H. Downregulation of SPARC expression decreases gastric cancer cellular invasion and survival. J Exp Clin Cancer Res. 2010; 29:59.
20. Li A, Qu X, Li Z, Qu J, Song N, Ma Y, Liu Y. Secreted protein acidic and rich in cysteine antagonizes bufalin-induced apoptosis in gastric cancer cells. Mol Med Rep. 2015; 12:2926–2932.
21. Chen J, Wang M, Xi B, Xue J, He D, Zhang J, Zhao Y. SPARC is a key regulator of proliferation, apoptosis and invasion in human ovarian cancer. PloS one. 2012; 7:e42413.
22. Derosa CA, Furusato B, Shaheduzzaman S, Srikantan V, Wang Z, Chen Y, Seifert M, Ravindranath L, Young D, Nau M, Dobi A, Werner T, McLeod DG, et al. Elevated osteonectin/SPARC expression in primary prostate cancer predicts metastatic progression. Prostate Cancer Prostatic Dis. 2012; 15:150–156.
23. Kim JH, Shin HS, Lee SH, Lee I, Lee YS, Park JC, Kim YJ, Chung JB, Lee YC. Contrasting activity of Hedgehog and Wnt pathways according to gastric cancer cell differentiation: relevance of crosstalk mechanisms. Cancer Sci. 2010; 101:328–335.
24. Guo AJ, Choi RC, Cheung AW, Chen VP, Xu SL, Dong TT, Chen JJ, Tsim KW. Baicalin, a flavone, induces the differentiation of cultured osteoblasts: an action via the Wnt/beta-catenin signaling pathway. J Biol Chem. 2011; 286:27882–27893.
25. Zhang J, Wang P, Zhu J, Wang W, Yin J, Zhang C, Chen Z, Sun L, Wan Y, Wang X, Chen G, Liu Y. SPARC expression is negatively correlated with clinicopathological factors of gastric cancer and inhibits malignancy of gastric cancer cells. Oncol Rep. 2014; 31:2312–2320.
26. Lindner JL, Loibl S, Denkert C, Ataseven B, Fasching PA, Pfitzner BM, Gerber B, Gade S, Darb-Esfahani S, Sinn BV, Huober J, Engels K, Tesch H, et al. Expression of secreted protein acidic and rich in cysteine (SPARC) in breast cancer and response to neoadjuvant chemotherapy. Ann Oncol. 2015; 26:95–100.
27. Perry AM, Cardesa-Salzmann TM, Meyer PN, Colomo L, Smith LM, Fu K, Greiner TC, Delabie J, Gascoyne RD, Rimsza L, Jaffe ES, Ott G, Rosenwald A, et al. A new biologic prognostic model based on immunohistochemistry predicts survival in patients with diffuse large B-cell lymphoma. Blood. 2012; 120:2290–2296.
28. Kim R, Ohi Y, Inoue H, Toge T. Enhancement of chemotherapeutic agents induced-apoptosis associated with activation of c-Jun N-terminal kinase 1 and caspase 3 (CPP32) in bax-transfected gastric cancer cells. Anticancer Res. 2000; 20:439–444.
29. Zhou W, Fu XQ, Zhang LL, Zhang J, Huang X, Lu XH, Shen L, Liu BN, Liu J, Luo HS, Yu JP, Yu HG. The AKT1/NF-kappaB/Notch1/PTEN axis has an important role in chemoresistance of gastric cancer cells. Cell Death Dis. 2013; 4:e847.
30. Francki A, McClure TD, Brekken RA, Motamed K, Murri C, Wang T, Sage EH. SPARC regulates TGF-beta1-dependent signaling in primary glomerular mesangial cells. J Cell Biochem. 2004; 91:915–925.
31. Bhoopathi P, Chetty C, Dontula R, Gujrati M, Dinh DH, Rao JS, Lakka SS. SPARC stimulates neuronal differentiation of medulloblastoma cells via the Notch1/STAT3 pathway. Cancer Res. 2011; 71:4908–4919.
32. Bhoopathi P, Gorantla B, Sailaja GS, Gondi CS, Gujrati M, Klopfenstein JD, Rao JS. SPARC overexpression inhibits cell proliferation in neuroblastoma and is partly mediated by tumor suppressor protein PTEN and AKT. PloS one. 2012; 7:e36093.
33. Kessler CB, Delany AM. Increased Notch 1 expression and attenuated stimulatory G protein coupling to adenylyl cyclase in osteonectin-null osteoblasts. Endocrinology. 2007; 148:1666–1674.
34. Thomas SL, Alam R, Lemke N, Schultz LR, Gutierrez JA, Rempel SA. PTEN augments SPARC suppression of proliferation and inhibits SPARC-induced migration by suppressing SHC-RAF-ERK and AKT signaling. Neuro Oncol. 2010; 12:941–955.
35. Hua HW, Jiang F, Huang Q, Liao ZJ, Ding G. Re-sensitization of 5-FU resistance by SPARC through negative regulation of glucose metabolism in hepatocellular carcinoma. Tumour Biol. 2015; 36:303–313.
36. Rahman M, Chan AP, Tai IT. A peptide of SPARC interferes with the interaction between caspase8 and Bcl2 to resensitize chemoresistant tumors and enhance their regression in vivo. PloS one. 2011; 6:e26390.
37. Li Z, Yamada S, Inenaga S, Imamura T, Wu Y, Wang KY, Shimajiri S, Nakano R, Izumi H, Kohno K, Sasaguri Y. Polypeptide N-acetylgalactosaminyltransferase 6 expression in pancreatic cancer is an independent prognostic factor indicating better overall survival. Br J Cancer. 2011; 104:1882–1889.
38. Heagerty PJ, Lumley T, Pepe MS. Time-dependent ROC curves for censored survival data and a diagnostic marker. Biometrics. 2000; 56:337–344.
39. Cristescu R, Lee J, Nebozhyn M, Kim KM, Ting JC, Wong SS, Liu J, Yue YG, Wang J, Yu K, Ye XS, Do IG, Liu S, et al. Molecular analysis of gastric cancer identifies subtypes associated with distinct clinical outcomes. Nat Med. 2015; 21:449–456.
40. Tian X, Jin RU, Bredemeyer AJ, Oates EJ, Blazewska KM, McKenna CE, Mills JC. RAB26 and RAB3D are direct transcriptional targets of MIST1 that regulate exocrine granule maturation. Mol Cell Biol. 2010; 30:1269–1284.
41. Kim M, Kim JH, Jang HR, Kim HM, Lee CW, Noh SM, Song KS, Cho JS, Jeong HY, Hahn Y, Yeom YI, Yoo HS, Kim YS. LRRC3B, encoding a leucine-rich repeat-containing protein, is a putative tumor suppressor gene in gastric cancer. Cancer Res. 2008; 68:7147–7155.
42. Vecchi M, Nuciforo P, Romagnoli S, Confalonieri S, Pellegrini C, Serio G, Quarto M, Capra M, Roviaro GC, Contessini Avesani E, Corsi C, Coggi G, Di Fiore PP, et al. Gene expression analysis of early and advanced gastric cancers. Oncogene. 2007; 26:4284–4294.
43. Nojima M, Suzuki H, Toyota M, Watanabe Y, Maruyama R, Sasaki S, Sasaki Y, Mita H, Nishikawa N, Yamaguchi K, Hirata K, Itoh F, Tokino T, et al. Frequent epigenetic inactivation of SFRP genes and constitutive activation of Wnt signaling in gastric cancer. Oncogene. 2007; 26:4699–4713.
44. Takada H, Imoto I, Tsuda H, Nakanishi Y, Ichikura T, Mochizuki H, Mitsufuji S, Hosoda F, Hirohashi S, Ohki M, Inazawa J. ADAM23, a possible tumor suppressor gene, is frequently silenced in gastric cancers by homozygous deletion or aberrant promoter hypermethylation. Oncogene. 2005; 24:8051–8060.
45. Kim HK, Choi IJ, Kim HS, Kim JH, Kim E, Park IS, Chun JH, Kim IH, Kim IJ, Kang HC, Park JH, Bae JM, Lee JS, et al. DNA microarray analysis of the correlation between gene expression patterns and acquired resistance to 5-FU/cisplatin in gastric cancer. Biochem Biophys Res Commun. 2004; 316:781–789.
46. Kang HC, Kim IJ, Park JH, Shin Y, Ku JL, Jung MS, Yoo BC, Kim HK, Park JG. Identification of genes with differential expression in acquired drug-resistant gastric cancer cells using high-density oligonucleotide microarrays. Clin Cancer Res. 2004; 10:272–284.
47. Zhang Y, Qu X, Teng Y, Li Z, Xu L, Liu J, Ma Y, Fan Y, Li C, Liu S, Wang Z, Hu X, Zhang J, et al. Cbl-b inhibits P-gp transporter function by preventing its translocation into caveolae in multiple drug-resistant gastric and breast cancers. Oncotarget. 2015; 6:6737–6748. doi: 10.18632/oncotarget.3253.