
INTRODUCTION
Occurrence of distant metastases is the main cause of sporadic colorectal cancer (sCRC) death, and the liver is the most common site for metastatic spread of the primary tumor [1, 2]. Metastasis is a complex multi-step process leading to the accumulation of genomic alterations in single tumor cells over the lifetime of a tumor from a benign lesion to invasive and metastatic spreading states leading to patient death [3, 4]. Genomic abnormalities which are potentially characteristic of such advanced stages of the disease are complex and so far, they have been poorly described and only partially understood. This relates to the fact that most genomic studies performed in colorectal cancer have focused on primary tumors, particularly in stage II disease, at diagnosis; in contrast, few studies have compared the deregulated transcripts of primary versus paired metastatic samples. Despite this, multiple mRNAs and miRNAS found to be expressed in primary tumors have been associated with metastatic colorectal carcinoma. Among others, these include mRNA of PTEN/PI3K [5], EGFR [6], TGFβ [7], and TP53 [8], as well as the metastatic CRC-associated miRNAs, miR-31 [9], miR-503 [10] and miR-133a [11].
Microarray analysis allows simultaneous investigation of several thousands of cancer-related and cancer-specific genes [12], such gene expression profiling (GEP) being highlighted as a potential tool to identify biomarkers for better prognostication and treatment of different types of cancer, including sCRC [13]. Thus, microarray data might provide significant insight into the biological differences between patients within a given cancer type with good- and poor-prognosis, at the same time it might be used as a screening tool for the identification of molecules to be targeted by existing or future (individualized) therapies. In recent years, several GEP have been identified as predictors for CRC stage II patient outcome. These include those being tested with the Oncotype DX® Colon Cancer test (Genomic Health, Inc., Redwood City, CA) [14] and Coloprint® (Agendia, Inc., Irvine, CA) gene chips, among other GEP platforms [13]. However, the molecular mechanisms underlying the association of such genomic profiles with metastatic colorectal carcinoma remain largely unknown.
Here we evaluate the molecular heterogeneity of sCRC tumors based on simultaneous assessment of the overall GEP for both coding mRNA and non-coding RNA genes -including miRNA, small nucleolar and large intergenic RNAs- in primary sCRC tumor samples from 23 consecutive patients and their paired liver metastases vs. non-tumoral tissues (n = 9). Overall, our results define a common GEP for all metastatic sCRC, which confirms and extends on previous observations [15] revealing new (specific) mRNA and miRNA signatures to be (potential) protective biomarker signatures for distant-disease.
RESULTS
Overall transcriptional profile of metastatic sCRC
Venn diagram analysis showed a total of 9,157 mRNA (3,744 down- and 5,413 up-regulated genes) and 118 miRNA genes (60 down- and 58 up-regulated) to be deregulated in primary tumors (vs. non-tumoral colorectal tissue) and 10,454 mRNA (4,777 down- and 5,677 up-regulated) and 254 miRNA genes (68 down- and 186 up-regulated) to be altered in liver metastases (vs. non-tumoral colorectal tissue). Overall, primary tumors and their paired liver metastases shared a total of 7,339 mRNA (3,297 down- and 4,042 up-regulated) and 109 miRNA (53 down- and 56 up-regulated) deregulated genes (Figure 1). Interestingly, one quarter of all mRNA (1,815/9,157; 20%) and miRNA transcripts (15/118; 13%) was exclusively found in primary tumors while one third of all differentially expressed mRNA transcripts (3,021/10,454; 29%) and the majority miRNA transcripts (145/254; 57%) were found to be deregulated only in liver metastases. Those genes most strongly overexpressed in primary tumors included the FOXQ1, MMP7, CLDN1, TACSTD2 and COL11A1 mRNAs and the miR-31, miR-4417, miR-503, miR-3647 and miR-592 miRNA transcripts; in turn, the CLCA4, CA1, SLC4A4, AQP8, and ZG16 mRNAs together with the miR-215, miR-139, miR-133a, miR-378c and miR-378d miRNAs were those genes showing the strongest down-regulated levels across all primary tumor samples analyzed (Table 1). Of note, those mRNAs and miRNAs transcripts differentially expressed in primary tumors vs. non-tumoral colorectal tissues, allowed for clear cut discrimination between both types of samples (Figure 2).
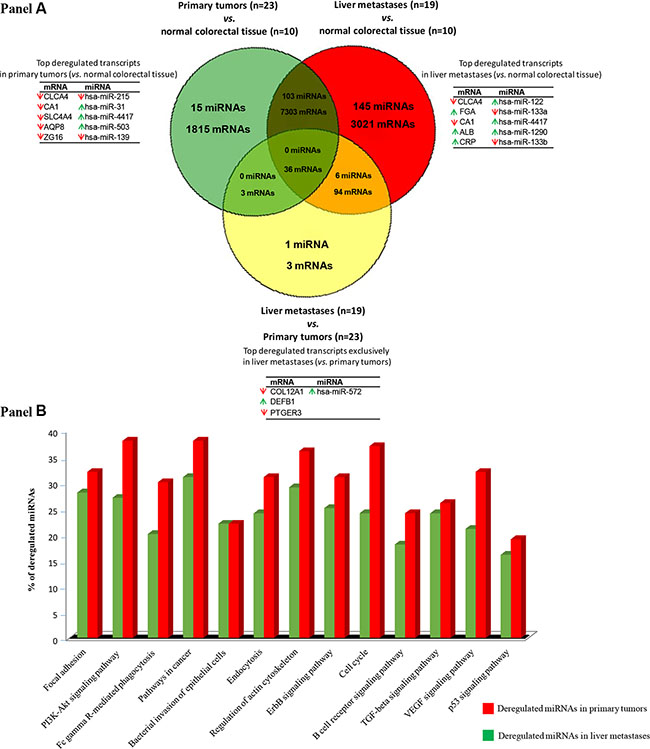
Figure 1: Gene expression profiles (GEP) of primary vs. metastatic colorectal cancer. (Panel A) Venn diagram representing mRNA and miRNA differentially expressed between the different types of samples analyzed: primary sporadic colorectal tumors vs. normal colorectal tissue, colorectal liver metastases vs. normal colorectal tissue and primary sporadic colorectal tumors vs. their paired liver metastases (q-values < 0.01). (Panel B) Most represented canonical pathways involved in metastatic colorectal tumors as defined by their GEP of both coding and non-coding RNAs (q < 0.01).
Table 1: Top mRNAs and miRNAs up- and down-regulated in primary sporadic colorectal tumors (n = 23) vs. non-tumoral colorectal tissues (n = 10)
Gene Name |
Gene ID |
Fold Change T vs. Non-T |
Chr. band |
Start (bp) |
Stop (bp) |
Strand |
Transcript description |
|---|---|---|---|---|---|---|---|
Up-regulated mRNA transcripts |
|||||||
FOXQ1 |
ENSG00000164379 |
44.1 |
6p25 |
1312440 |
1314758 |
+ |
protein-coding |
MMP7 |
ENSG00000137673 |
31.1 |
11q21 |
102520508 |
102530753 |
− |
protein-coding |
CLDN1 |
ENSG00000163347 |
26.2 |
3q28 |
190305701 |
190322475 |
− |
protein-coding |
TACSTD2 |
ENSG00000184292 |
22.9 |
1p32 |
58575423 |
58577773 |
− |
protein-coding |
COL11A1 |
ENSG00000060718 |
21.4 |
1p21 |
102876467 |
103108496 |
− |
protein-coding |
KIAA1199 |
ENSG00000103888 |
17.1 |
15q24 |
80779343 |
80951776 |
+ |
protein-coding |
CTHRC1 |
ENSG00000164932 |
14.7 |
8q22 |
103371515 |
103383005 |
+ |
protein-coding |
DUSP27 |
ENSG00000198842 |
14.4 |
1q24 |
167094045 |
167129165 |
+ |
protein-coding |
KRT23 |
ENSG00000108244 |
13.8 |
17q21 |
40922696 |
40937643 |
− |
protein-coding |
SRPX2 |
ENSG00000102359 |
12.3 |
Xq22 |
100644166 |
100671299 |
+ |
protein-coding |
NFE2L3 |
ENSG00000050344 |
10.8 |
7p15 |
26152227 |
26187137 |
+ |
protein-coding |
Up-regulated miRNA transcripts |
|||||||
hsa-miR-31 |
ENSG00000199177 |
10.3 |
9p21 |
21512114 |
21512184 |
− |
hsa-miR |
hsa-miR-4417 |
ENSG00000264341 |
8.2 |
1p36 |
5624131 |
5624203 |
+ |
hsa-miR |
hsa-miR-503 |
ENSG00000208005 |
8.1 |
Xq26 |
133680358 |
133680428 |
− |
hsa-miR |
hsa-miR-1290 |
ENSG00000221662 |
5.9 |
1p34 |
18897071 |
18897148 |
− |
hsa-miR |
hsa-miR-3687 |
ENSG00000264063 |
5.5 |
21p11 |
9826203 |
9826263 |
+ |
hsa-miR |
hsa-miR-592 |
ENSG00000207692 |
4.9 |
7q31 |
126698142 |
126698238 |
− |
hsa-miR |
hsa-miR-183 |
ENSG00000207691 |
4.6 |
7q32 |
129774905 |
129775014 |
− |
hsa-miR |
hsa-miR-224 |
ENSG00000207621 |
4.5 |
Xq28 |
151958578 |
151958658 |
− |
hsa-miR |
hsa-miR-1246 |
ENSG00000207584 |
4.2 |
2q31 |
176600980 |
176601052 |
− |
hsa-miR |
hsa-miR-21 |
ENSG00000199004 |
3.9 |
17q23 |
59841266 |
59841337 |
+ |
hsa-miR |
hsa-miR-424 |
ENSG00000223749 |
3.8 |
Xq26 |
133677367 |
133680741 |
− |
hsa-miR |
Down-regulated mRNA transcripts |
|||||||
CLCA4 |
ENSG00000016602 |
−134.1 |
1p22 |
87012759 |
87046437 |
+ |
protein-coding |
CA1 |
ENSG00000133742 |
−85.4 |
8q21 |
86239837 |
86291243 |
− |
protein-coding |
SLC4A4 |
ENSG00000080493 |
−60.8 |
4q21 |
71092756 |
71572087 |
+ |
protein-coding |
AQP8 |
ENSG00000103375 |
−51.8 |
16p12 |
25227052 |
25240261 |
+ |
protein-coding |
ZG16 |
ENSG00000174992 |
−45.6 |
16p11 |
29778240 |
29782973 |
+ |
protein-coding |
MS4A12 |
ENSG00000071203 |
−43.8 |
11q12 |
60260251 |
60274903 |
+ |
protein-coding |
CA2 |
ENSG00000104267 |
−37.2 |
8q21 |
85463852 |
85481493 |
+ |
protein-coding |
GUCA2B |
ENSG00000044012 |
−35.7 |
1p34 |
42619092 |
42621495 |
+ |
protein-coding |
CHGA |
ENSG00000100604 |
−35.2 |
14q32 |
93389425 |
93401638 |
+ |
protein-coding |
GUCA2A |
ENSG00000197273 |
−35.2 |
1p34 |
42628362 |
42630395 |
− |
protein-coding |
CLCA1 |
ENSG00000016490 |
−34.8 |
1p22 |
86934051 |
86965977 |
+ |
protein-coding |
SLC26A3 |
ENSG00000091138 |
−33.7 |
7q31 |
107405912 |
107443678 |
− |
protein-coding |
UGT2B17 |
ENSG00000197888 |
−31 |
4q13 |
69402902 |
69434245 |
− |
protein-coding |
Down-regulated miRNA transcripts |
|||||||
hsa-miR-215 |
ENSG00000207590 |
−11 |
1q41 |
220117853 |
220117962 |
+ |
hsa-miR |
hsa-miR-139-5p |
ENSG00000272036 |
−8 |
11q13 |
72615063 |
72615130 |
− |
hsa-miR |
hsa-miR-133a |
ENSG00000207764 |
−7.1 |
20q13 |
61162119 |
61162220 |
+ |
hsa-miR |
hsa-miR-378c |
ENSG00000264803 |
−7 |
10q26 |
130962588 |
130962668 |
− |
hsa-miR |
hsa-miR-378d |
ENSG00000263631 |
−6.7 |
4p16 |
5923275 |
5923328 |
− |
hsa-miR |
hsa-miR-422a |
ENSG00000199156 |
−6.6 |
15q22 |
63870930 |
63871019 |
− |
hsa-miR |
hsa-miR-375 |
ENSG00000198973 |
−6.4 |
2q35 |
219866362 |
219866431 |
− |
hsa-miR |
hsa-miR-378f |
ENSG00000264926 |
−6.3 |
1p36 |
23929070 |
23,929,147 |
+ |
hsa-miR |
hsa-miR-378i |
ENSG00000263463 |
−6.1 |
22q13 |
41923222 |
41923297 |
− |
hsa-miR |
hsa-miR-378g |
ENSG00000263526 |
−5.6 |
1p21 |
94745860 |
94745900 |
− |
hsa-miR |
hsa-miR-133b |
ENSG00000199080 |
−5.4 |
6p22 |
52148923 |
52149041 |
+ |
hsa-miR |
hsa-miR-138 |
ENSG00000207954 |
−4.5 |
3p21 |
44114212 |
44114310 |
+ |
hsa-miR |
hsa-miR-378e |
ENSG00000263831 |
−4.2 |
5q35 |
169455492 |
169455570 |
+ |
hsa-miR |
hsa-miR-143 |
ENSG00000208035 |
−3.7 |
5q32 |
148808481 |
148808586 |
+ |
hsa-miR |
q-values < .01; T: tumoral samples; Non-T: non-tumoral samples; hsa-miR: human micro-RNA.
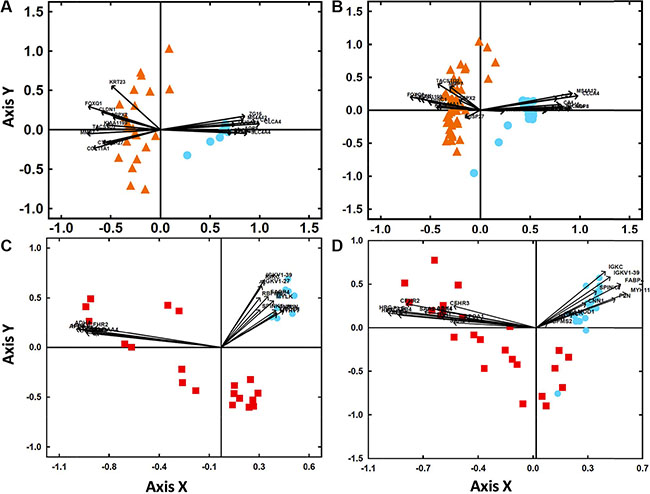
Figure 2: Classification of sCRC tumors vs non-tumoral colorectal tissues based on the gene expression profile (GEP) of those transcripts more strongly deregulated in primary tumors and their liver metastases. (Panel A) Biplot analysis of 23 primary colorectal tumors (orange triangles) vs. 10 non-tumoral colorectal tissues (blue circles) from our sCRC patient series. (Panel B) Biplot analysis of 47 primary colorectal tumors (orange triangles) vs. 25 non-tumoral colorectal tissue samples (blue circles) from an independent external validation dataset (GEO database, accession number GSE21510). (Panel C) Biplot analysis of 19 liver metastases (red squares) vs. 10 non-tumoral colorectal tissues (blue circles) from our sCRC patient series. (Panel D) Biplot analysis of 24 liver metastases (red squares) vs. 23 non-tumoral colorectal tissues (blue circles) from an independent external validation dataset (GEO database, accession number GSE35834).
Overall, liver metastases from the 19 colorectal cancer patients analyzed systematically showed deregulated transcripts of those genes identified as being also deregulated in their paired primary colorectal carcinomas (Table 2). Thus, both the primary tumors and their paired liver metastases showed overexpression of FOXQ1, MMP7, CLDN1 and TACSTD2 mRNAS and the miR-4417, miR-503, miR-1290, miR-3687, miR-183, miR-224 and miR-1246 miRNAs, together with down-regulated levels of the CLCA4, CA1, AQP8, ZG16, GUCA2B and SLC26A3 mRNAS and the miR-215, miR-133a, miR-375, miR-133b and miR-138 miRNAs. Interestingly, most of these genes with highly deregulated expression in both primary tumors and their corresponding liver metastases have been previously found to be altered/involved in colorectal cancer (e.g., FOXQ1, MMP7, TACSTD2 CLCA4, CA1, AQP8, ZG16, GUCA2B and SLC26A3) and/or they have been identified as genes that are relevant to the metastatic process (e.g., FOXQ1, MMP7, TACSTD2 CLCA4, CA1, AQP8 and SLC26A3); similarly the miRNAs, miR-503, miR-3687, miR-215, miR-133a, miR-375, miR-183, miR-1290, miR-224, miR-1246, have also been reported to be typically altered in CRC. Despite the similarities observed between the GEP of primary and metastatic tumors, some transcripts were found to be specifically deregulated in liver metastases while expressed at normal levels in their paired primary tumors, reflecting either an increased genomic instability of metastatic cells or their adaption to the liver microenvironment (Table 3). Newly deregulated metastatic transcripts included overexpression of APOA1, HRG, UGT2B4, RBP4 and ADH4 mRNAS and the miR-3180-3p, miR-3197, miR-3178, miR-4793 and miR-4440 miRNAs, together with decreased expression of the IGKV1-39, IGKC, IGKV1-27, FABP4 and MYLK mRNAS and the miR-363, miR-1, miR-143, miR-27b and miR-28-5p miRNAs. Furthermore, once the 19 paired liver metastasis and primary tumor samples were specifically compared (paired analysis) 52 mRNAS (14 down- and 38 up-regulated genes) and only two over-expressed miRNAs were observed (miR-122 and miR-4322; Supplementary Table 2), these including the most differentially expressed mRNAs and miRNAs identified with the unpaired comparison of all samples. Of note, among the regulated miRNAs in both the paired and unpaired comparisons was miR-122, a miRNA which is highly expressed in the liver, wich could potentially be due to the presence of normal liver tissue in the metastasis samples. In order to determine the degree of contamination by residual liver cells in metastatic tissues, we analyzed the expression levels of 41 liver-associated genes, as selected from the Tissue-specific Gene Expression and Regulation database (TIGER) plus miR-122 in normal liver (n = 5), CRC liver metastases (n = 19), normal colorectal mucosa (n=9) and primary CRC tumors (n = 23). All 41 liver-specific genes showed similar expression levels in CRC liver metastases, normal colorectal mucosa and primary CRC tumors, while they were highly expressed in the normal liver samples (Supplementary Figure 1). In contrast, miR122 was highly expressed in the liver and CRC liver metastases, whereas it showed lower expression levels in normal mucosa and primary CRC tumors, suggesting that over-expression of miR122 in liver metastatic tissues was not specifically due to residual liver cell-associated background in the metastatic CRC tissues.
Table 2: Top mRNAs and miRNAs up- and down-regulated in colorectal liver metastases (n = 19) vs. non-tumoral colorectal tissues (n = 10)
Gene Name |
Gene ID |
Fold Change T vs. Non-T |
Chr. band |
Start (bp) |
Stop (bp) |
Strand |
Transcript description |
|---|---|---|---|---|---|---|---|
Up-regulated mRNA transcripts |
|||||||
FGA |
ENSG00000171560 |
157.6 |
4q28 |
154583126 |
154590766 |
− |
protein-coding |
ALB |
ENSG00000163631 |
96.2 |
4q13 |
73397114 |
73421412 |
+ |
protein-coding |
CRP |
ENSG00000132693 |
84.6 |
1q23 |
159712289 |
159,714,589 |
− |
protein-coding |
HP |
ENSG00000257017 |
75.9 |
16q22 |
72054566 |
72,061,056 |
+ |
protein-coding |
FGB |
ENSG00000171564 |
64.2 |
4q28 |
154562956 |
154572763 |
+ |
protein-coding |
MMP7 |
ENSG00000137673 |
59.2 |
11q22 |
102520508 |
102530753 |
− |
protein-coding |
APOA2 |
ENSG00000158874 |
54.4 |
1q23 |
161222292 |
161223631 |
− |
protein-coding |
ORM1 |
ENSG00000228278 |
50 |
9q31 |
114323023 |
114326479 |
+ |
protein-coding |
APOA1 |
ENSG00000118137 |
36.1 |
11q23 |
116835751 |
116837950 |
− |
protein-coding |
CLDN1 |
ENSG00000163347 |
34.2 |
3q28 |
190305701 |
190322475 |
− |
protein-coding |
FOXQ1 |
ENSG00000164379 |
31.2 |
6p25 |
1312440 |
1314758 |
+ |
protein-coding |
TACSTD2 |
ENSG00000184292 |
29.2 |
1p32 |
58575423 |
58577773 |
− |
protein-coding |
Up-regulated miRNA transcripts |
|||||||
hsa-miR-122 |
ENSG00000207778 |
1318.7 |
18q21 |
58451068 |
58451176 |
+ |
hsa-miR |
hsa-miR-4417 |
ENSG00000264341 |
19.9 |
1p36 |
5564071 |
5564143 |
+ |
hsa-miR |
hsa-miR-1290 |
ENSG00000221662 |
16.1 |
1p34 |
18897071 |
18897148 |
− |
hsa-miR |
hsa-miR-3687 |
ENSG00000264063 |
9.7 |
21p11 |
9826203 |
9826263 |
+ |
hsa-miR |
hsa-miR-503 |
ENSG00000208005 |
9 |
Xq26 |
133680358 |
133680428 |
− |
hsa-miR |
hsa-mir-885 |
ENSG00000216135 |
8.9 |
3p25 |
10394481 |
10394562 |
− |
hsa-miR |
hsa-miR-183 |
ENSG00000207691 |
8.6 |
7q32 |
129774905 |
129775014 |
− |
hsa-miR |
hsa-miR-224 |
ENSG00000207621 |
8.4 |
Xq28 |
151958578 |
151958658 |
− |
hsa-miR |
hsa-miR-1246 |
ENSG00000207584 |
8.1 |
2q31 |
176600980 |
176601052 |
− |
hsa-miR |
Down-regulated mRNA transcripts |
|||||||
CLCA4 |
ENSG00000016602 |
−216.3 |
1p22 |
87012759 |
87046437 |
+ |
protein-coding |
CA1 |
ENSG00000133742 |
−142.4 |
8q21 |
86239837 |
86291243 |
− |
protein-coding |
MS4A12 |
ENSG00000071203 |
−81.7 |
11q12 |
60260251 |
60274903 |
+ |
protein-coding |
ZG16 |
ENSG00000174992 |
−66.5 |
16p11 |
29778240 |
29782973 |
+ |
protein-coding |
SLC26A3 |
ENSG00000091138 |
−65.1 |
7q31 |
107405912 |
107443678 |
− |
protein-coding |
CLCA1 |
ENSG00000016490 |
−65 |
1p22 |
86934051 |
86965977 |
+ |
protein-coding |
ACTG2 |
ENSG00000163017 |
−61 |
2p13 |
73892314 |
73892314 |
+ |
protein-coding |
AQP8 |
ENSG00000103375 |
−55 |
16p12 |
25227052 |
25240261 |
+ |
protein-coding |
CA2 |
ENSG00000104267 |
−53.6 |
8q21 |
85463852 |
85481493 |
+ |
protein-coding |
FCGBP |
ENSG00000090920 |
−52 |
19q13 |
39863323 |
39934626 |
− |
protein-coding |
GUCA2B |
ENSG00000044012 |
−43.8 |
1p34 |
42619092 |
42621495 |
+ |
protein-coding |
Down-regulated miRNA transcripts |
|||||||
hsa-miR-133a |
ENSG00000207764 |
−22.5 |
20q13 |
61162119 |
61162220 |
+ |
hsa-miR |
hsa-miR-133b |
ENSG00000199080 |
−10.8 |
6p12 |
52148923 |
52149041 |
+ |
hsa-miR |
hsa-miR-10b |
ENSG00000207744 |
−7.5 |
2q31 |
176150303 |
176150412 |
+ |
hsa-miR |
hsa-miR-215 |
ENSG00000207590 |
−7 |
1q41 |
220117853 |
220117962 |
+ |
hsa-miR |
hsa-miR-363 |
ENSG00000207572 |
−5.9 |
Xq26 |
134169361 |
134169473 |
− |
hsa-miR |
hsa-miR-143 |
ENSG00000208035 |
−5.4 |
5q32 |
148808481 |
148808586 |
+ |
hsa-miR |
hsa-miR-497 |
ENSG00000273895 |
−5.2 |
17p13 |
7017911 |
7018022 |
− |
hsa-miR |
hsa-miR-1 |
ENSG00000174407 |
−5.2 |
20q13 |
62550453 |
62570764 |
+ |
hsa-miR |
hsa-miR-138 |
ENSG00000207954 |
−4.9 |
3p21 |
44114212 |
44114310 |
+ |
hsa-miR |
hsa-miR-375 |
ENSG00000198973 |
−4.5 |
2q35 |
219866362 |
219866431 |
− |
hsa-miR |
q-values < .01; T: tumoral samples; Non-T: non-tumoral samples; hsa-miR: human micro-RNA.
Table 3: Top up- and down-regulated mRNAs and miRNAs differentially expressed in colorectal liver metastases (n = 19) vs. non-tumoral colorectal tissues (n = 10) vs. primary tumors (n = 23)
Gene Name |
Gene ID |
Fold Change T vs. Non−T |
Chr. band |
Start (bp) |
Stop (bp) |
Strand |
Transcript description |
|---|---|---|---|---|---|---|---|
Up-regulated mRNA transcripts |
|||||||
APOA1 |
ENSG00000118137 |
10.2 |
11q23 |
116835751 |
116837950 |
− |
protein-coding |
HRG |
ENSG00000113905 |
10.0 |
3q27 |
186660216 |
186678240 |
+ |
protein-coding |
UGT2B4 |
ENSG00000156096 |
9.3 |
4q13 |
69480165 |
69526014 |
− |
protein-coding |
RBP4 |
ENSG00000138207 |
9.0 |
10q23 |
93591687 |
93601744 |
− |
protein-coding |
ADH4 |
ENSG00000198099 |
8.3 |
4q22 |
99123657 |
99157792 |
− |
protein-coding |
SAA2-SAA4 |
ENSG00000148965 |
8.1 |
11p15 |
18231355 |
18248674 |
− |
protein-coding |
ITIH1 |
ENSG00000055957 |
7.9 |
3p21 |
52777586 |
52792068 |
+ |
protein-coding |
CFHR3 |
ENSG00000116785 |
7.6 |
1q32 |
196774795 |
196795406 |
+ |
protein-coding |
HPX |
ENSG00000110169 |
7.5 |
11p15 |
6431038 |
6442617 |
− |
protein-coding |
CFHR2 |
ENSG00000080910 |
7.1 |
1q31 |
196943759 |
196959226 |
+ |
protein-coding |
PLG |
ENSG00000122194 |
7.1 |
6q26 |
160702193 |
160754054 |
+ |
protein-coding |
Up-regulated miRNA transcripts |
|||||||
hsa-miR-3180-3p |
ENSG00000257563 |
4.8 |
16p12 |
18402178 |
18402271 |
− |
hsa-miR |
hsa-miR-3197 |
ENSG00000263681 |
4.7 |
21q22 |
41167557 |
41167629 |
+ |
hsa-miR |
hsa-miR-3178 |
ENSG00000266232 |
4.2 |
16p13 |
2531922 |
2532005 |
− |
hsa-miR |
hsa-miR-4793 |
ENSG00000263898 |
4.1 |
3p21 |
48644194 |
48644280 |
− |
hsa-miR |
hsa-miR-4440 |
ENSG00000266109 |
4.0 |
2q37 |
239068817 |
239068914 |
− |
hsa-miR |
hsa-miR-4486 |
ENSG00000265210 |
3.6 |
11p15 |
19575310 |
19575372 |
+ |
hsa-miR |
hsa-miR-150-star |
ENSG00000207782 |
3.5 |
19q13 |
49500762 |
49500873 |
− |
hsa-miR |
hsa-miR-483-5p |
ENSG00000207805 |
3.5 |
11p15 |
2134111 |
2134222 |
− |
hsa-miR |
hsa-miR-642b |
NA |
3.4 |
19q13 |
45674932 |
45675008 |
− |
hsa-miR |
hsa-miR-1247 |
ENSG00000277601 |
3.4 |
14q32 |
101560287 |
101560422 |
− |
hsa-miR |
Down-regulated mRNA transcripts |
|||||||
IGKV1-39 |
ENSG00000242371 |
−15.9 |
2p11 |
89319,625 |
89320146 |
− |
protein-coding |
IGKC |
ENSG00000239975 |
−15.0 |
2p12 |
88857161 |
89085723 |
− |
protein-coding |
IGKV1-27 |
ENSG00000244575 |
−13.3 |
2p11 |
89213417 |
89,213,928 |
− |
protein-coding |
FABP4 |
ENSG00000170323 |
−13.1 |
8q21 |
81478419 |
81483263 |
− |
protein-coding |
MYLK |
ENSG00000065534 |
−11.5 |
3q21 |
123610049 |
123884331 |
− |
protein-coding |
PLN |
ENSG00000198523 |
−11.3 |
6q22 |
118548279 |
118560730 |
+ |
protein-coding |
RBPMS2 |
ENSG00000166831 |
−11.0 |
15q22 |
64739892 |
64775587 |
− |
protein-coding |
CNN1 |
ENSG00000130176 |
−9.8 |
19p13 |
11538717 |
11550324 |
+ |
protein-coding |
SPINK4 |
ENSG00000122711 |
−9.8 |
9p13 |
33218365 |
33248567 |
+ |
protein-coding |
LMOD1 |
ENSG00000163431 |
−9.3 |
1q32 |
201896452 |
201946588 |
− |
protein-coding |
MYH11 |
ENSG00000133392 |
−9.3 |
16p13 |
15703135 |
15857033 |
− |
protein-coding |
Down-regulated miRNA transcripts |
|||||||
hsa-miR-363 |
ENSG00000207572 |
−5.9 |
Xq26 |
134169361 |
134169473 |
− |
hsa-miR |
hsa-miR-1 |
ENSG00000174407 |
−5.2 |
20q13 |
62550453 |
62570764 |
+ |
hsa-miR |
hsa-miR-143 |
ENSG00000208035 |
−3.9 |
5q32 |
149428918 |
149429023 |
+ |
hsa-miR |
hsa-miR-27b |
ENSG00000207864 |
−2.1 |
9q22 |
95085435 |
95085542 |
+ |
hsa-miR |
hsa-miR-28-5p |
ENSG00000207651 |
−2.0 |
3q28 |
188688781 |
18868866 |
+ |
hsa-miR |
hsa-miR-99b |
ENSG00000207550 |
−1.7 |
19q13 |
51692612 |
51692681 |
+ |
hsa-miR |
hsa-miR-152 |
ENSG00000207947 |
−1.7 |
17q21 |
48037154 |
48037262 |
− |
hsa-miR |
hsa-miR-125b |
ENSG00000207971 |
−1.5 |
11q24 |
122099757 |
122099844 |
− |
hsa-miR |
hsa-miR-3064 |
ENSG00000265695 |
−1.5 |
17q23 |
64500773 |
64500839 |
− |
hsa-miR |
hsa-miR-30d |
ENSG00000199153 |
−1.4 |
8q24 |
134804876 |
134804945 |
− |
hsa-miR |
q-values < .01; T: tumoral samples; Non-T: non-tumoral samples; hsa-miR: human micro-RNA.
Functional characterization of deregulated GEP in metastatic sCRC
Analysis of the biological and functional significance of the deregulated GEPs observed in our metastatic colorectal tumors, revealed 58 significantly altered canonical pathways in primary CRC tumors (vs. non-tumoral colorectal tissue) and 65 associated with liver mestastases (vs. non-tumoral colorectal tissue) (Figure 1). Those pathways specifically altered in primary tumors (Supplementary Table 3) were associated with an abnormally increased expression of genes that are involved in focal adhesion (e.g., PRKCA, CRK, and BCL2), PI3K-Akt signaling (e.g., PHLPP2, PRKCA, PPP2R3A and KIT) and cancer pathways (e.g., COL4A5, LAMC1 and BCL2L1). Conversely, canonical pathways found to be specifically deregulated in liver metastatic samples (Supplementary Table 4) included multiple genes related to intercellular adhesion and the metastatic processes (e.g., IGF1R, PIK3CA, PTEN and EGFR), endocytosis (e.g., the PDGFRA, SMAD2, ERBB3, PML and FGFR2), and the cell cycle (e.g., SMAD2, CCND2, E2F5 and MYC), as well as, the TGFβ signaling pathway (e.g., RHOA, SMAD2, SMAD4, SMAD5, SMAD6, BMPR1A, SMAD7 and MYC), with the FDR values significantly higher for the liver metastases vs. primary tumors (≥ 0.0005 to 2.075E-13).
Validation of tumor markers with high discriminating power between primary tumors and non-tumoral colorectal tissues
The discriminating power of the top mRNAs found to be deregulated (up-regulated and down-regulated) in common in primary sporadic colorectal tumors (n = 23) and colorectal liver metastases (n = 19) [vs. non-tumoral colorectal tissues (n = 10)] was further validated using GEP data from two independent series of sCRC available at the public GEO database (47 primary tumors vs. 25 non-tumoral colorectal tissues and 24 liver metastases vs. 23 non-tumoral colorectal tissues; Figure 2). In line with those findings described above for our sCRC cases, all primary tumors and non-tumoral samples from the two validation cohorts could be classified as having a sCRC-associated GEP based on overexpression of FOXQ1, MMP7, CLDN1, TACSTD2, COL11A1, KIAA1199, CTHRC1, DUSP27, KRT23, SRPX2 and NFE2L3 and decreased expression of CLCA4, CA1, SLC4A4, AQP8, ZG16, MS4A12, CA2, GUCA2B, CHGA, GUCA2A, CLCA1, SLC26A3 and UGT2B17, respectively. Similarly, 23/24 (96%) liver metastatic samples were also properly classified as distinct from non-tumoral colorectal tissue based on overexpression of APOA1, HRG, UGT2B4, RBP4, ADH4, SAA2-SAA4, ITIH1, CFHR3, HPX, CFHR2 and PLG, while all non-tumoral samples showed decreased expression of IGK1-39, IGKC, IGKV1-27, FABP4, MYLK, PLN, RBPMS2, CNN1, SPINK4, LMOD1 and MYH11 (Figure 2).
miRNAs genes that potentially regulate gene expression in metastatic sCRC
In order to determine the impact of the miRNAs gene expression signature on the GEP of sCRC tumors, both the miRNA and mRNA gene expression data sets were combined to investigate potential correlations between miRNAs and mRNA genes which are specifically altered in colorectal liver metastases. Evaluation of each pair of potential miRNA-mRNA interacting genes identified potential interactions for 38 inversely correlated and 437 directly correlated (absolute R2 value ≥ 0.80; p < .0001) pairs of miRNA-mRNA genes. Based on currently available miRNA target prediction algorithms and databases, such interactions corresponded to only three predictable and 4 experimentally validated interactions for the inversely correlated pairs of miRNA-mRNA (Table 4). Of note, both the 4 experimentally validated pairs of mRNA/miRNA genes (miR-20a/DNAJB4, miR-497/PHF19, miR-335/PTPRH and miR-195/SLC23A3) and the 3 predicted miRNA-mRNA pairs (miR-363/LRRC1, miR-3124/PRRC2C and miR-363/ MIER3) were systematically altered in all 19 liver metastatic samples analyzed in this study.
Table 4: miRNA-mRNA interactions found in metastatic colorectal cancer by pearson correlation analysis of the expression signal identified for those transcripts differentially and exclusively (vs. primary tumors) expressed in colorectal liver metastases (n = 19) as detected by the affymetrix pimeview human gene expression array and the microRNA 3.0 expression array
miRNA |
mRNA Gene Name |
Gene ID |
R2 |
Classification of Interaction |
Source of validation/prediction |
|---|---|---|---|---|---|
hsa-miR-20a |
DNAJB4 |
ENSG00000162616 |
−0.84 |
Validated |
miRTarBase |
hsa-miR-497 |
PHF19 |
ENSG00000119403 |
−0.83 |
Validated |
miRTarBase |
hsa-miR-335 |
PTPRH |
ENSG00000080031 |
−0.82 |
Validated |
miRTarBase, DIANAmT |
hsa-miR-195 |
SLC23A3 |
ENSG00000213901 |
−0.82 |
Validated |
miRTarBase |
hsa-miR-363 |
LRRC1 |
ENSG00000137269 |
−0.89 |
Predicted |
MiRanda |
hsa-miR-3124 |
PRRC2C |
ENSG00000117523 |
−0.86 |
Predicted |
Targetscan |
hsa-miR-363 |
MIER3 |
ENSG00000155545 |
−0.81 |
Predicted |
Targetscan |
hsa-miR-10b-star |
NBPF1 |
ENSG00000219481 |
−0.85 |
Not known |
|
hsa-miR-30a |
KIF4A |
ENSG00000090889 |
−0.85 |
Not known |
|
hsa-miR-31 |
QPRT |
ENSG00000103485 |
−0.85 |
Not known |
|
hsa-miR-1910 |
RASL12 |
ENSG00000103710 |
−0.84 |
Not known |
|
hsa-miR-30a |
SKA1 |
ENSG00000154839 |
−0.84 |
Not known |
|
hsa-miR-195 |
SKA1 |
ENSG00000154839 |
−0.83 |
Not known |
|
hsa-miR-3162 |
TFCP2L1 |
ENSG00000115112 |
−0.83 |
Not known |
|
hsa-miR-486 |
SPC24 |
ENSG00000161888 |
−0.83 |
Not known |
|
hsa-miR-497 |
SKA1 |
ENSG00000154839 |
−0.83 |
Not known |
|
hsa-miR-885 |
RNF43 |
ENSG00000108375 |
−0.83 |
Not known |
|
hsa-miR-195 |
F2RL1 |
ENSG00000164251 |
−0.82 |
Not known |
|
hsa-miR-195 |
KIF4A |
ENSG00000090889 |
−0.82 |
Not known |
|
hsa-miR-30a |
BORA |
ENSG00000136122 |
−0.82 |
Not known |
|
hsa-miR-4484 |
CASP1 |
ENSG00000137752 |
−0.82 |
Not known |
|
hsa-miR-497 |
HMMR |
ENSG00000072571 |
−0.82 |
Not known |
|
hsa-miR-497 |
KIF4A |
ENSG00000090889 |
−0.82 |
Not known |
|
hsa-miR-497 |
PTTG1 |
ENSG00000164611 |
−0.82 |
Not known |
|
hsa-miR-195 |
CKMT1A |
ENSG00000223572 |
−0.81 |
Not known |
|
hsa-miR-20a |
PCSK5 |
ENSG00000099139 |
−0.81 |
Not known |
|
hsa-miR-223 |
PDE9A |
ENSG00000160191 |
−0.81 |
Not known |
|
hsa-miR-363 |
MRPS17 |
ENSG00000239789 |
−0.81 |
Not known |
|
hsa-miR-4443 |
RRP1 |
ENSG00000160214 |
−0.81 |
Not known |
|
hsa-miR-150 |
TFCP2L1 |
ENSG00000115112 |
−0.80 |
Not known |
|
hsa-miR-20a |
RNF152 |
ENSG00000176641 |
−0.80 |
Not known |
|
hsa-miR-20a |
SOCS2 |
ENSG00000120833 |
−0.80 |
Not known |
|
hsa-miR-30a |
MS4A8 |
ENSG00000166959 |
−0.80 |
Not known |
|
hsa-miR-363 |
CNBP |
ENSG00000169714 |
−0.80 |
Not known |
|
hsa-miR-363 |
UQCRC2 |
ENSG00000140740 |
−0.80 |
Not known |
|
hsa-miR-497 |
CKMT1A |
ENSG00000223572 |
−0.80 |
Not known |
|
hsa-miR-497 |
F2RL1 |
ENSG00000164251 |
−0.80 |
Not known |
|
hsa-miR-497 |
HDHD2 |
ENSG00000167220 |
−0.80 |
Not known |
|
hsa.miR.378g |
PMEPA1 |
ENSG00000124225 |
−0.80 |
Not known |
p-values <.0001; R2: Pearson correlation coefficient.
DISCUSSION
In the present study we investigated the expression of both coding mRNA and non-coding RNA genes -including miRNA, small nucleolar and large intergenic RNAs- in paired primary tumor and liver metastases samples from primary colorectal carcinoma patients. To the best of our knowledge, this is the first study in which the overall coding and non-coding GEP of sCRC liver metastases are compared with their paired primary tumors and non-tumoral colorectal tissues, by high-resolution arrays. Overall, primary tumors and their paired metastases frequently revealed many genes to be altered in common at both sites; these findings support the existence of a very close genomic relationship between the GEP of primary colorectal tumors and their paired liver metastases, as it has also been suggested to occur at the DNA level [16]. Deregulated expression observed in common in both groups of (paired) tumor samples included increased expression of genes linked to liver metastatic sCRC, tumor development, growth (TACSTD2) [17] and invasiveness (FOXQ1, MMP7 and CLDN1) [18, 19], together with decreased expression of genes related to differentiation (CLCA4, CLCA1 and AQP8) [20, 21], apoptosis (CA1) [22], immunity (ZG16) [23], and protection (FCGBP and CA2) [24] of CRC cells. Thus, the functional networks most strongly affected in primary tumors included those involved in focal adhesion, PI3K-Akt and ErbB signaling and other cancer pathways, FcδR-mediated phagocytosis, endocytosis, bacterial invasion of epithelial cells, plus the TP53 signaling pathway, all of which have been previously shown to be directly involved in the development and progression of sCRC [25–29].
Another functional gene network which was also frequently altered in sCRC liver metastases was the TGFβ signaling pathway, a network that plays a critical role in the regulation of cell growth, differentiation and development in a broad range of neoplasms [7]. In fact, such findings have led to the speculation that TGFβ signaling might be responsible, at least in part, for the aggressiveness of CRC tumors in our series, through an increased invasive capacity which is a prerequisite for the settlement and growth of distant metastasis [18]. In this regard, recent studies in which the miRNAS signature of metastatic CRC has been investigated, have also identified a network of regulatory miRNA-driven interactions that regulate expression of key genes associated with TGFβ signaling and metastasis, including the miR-378 gene family [30]. In line with these observations, here we found the miRNA-378c, -378d, -378f, -378i, -378g and -378e to be among the most strongly down-regulated miRNAs in primary CRC tumors. Zhang et al. [30], evaluated the levels of miR-378 in CRC cell lines and 84 paired CRC cancer and normal adjacent mucosa tissues, their results highlighting miR-378 expression to be an independent prognostic factor potentially due to its ability to inhibit cell growth and invasion in CRC. Most interestingly, here we found that miR-378g could directly target PMEPA1, a gene that plays a relevant role in the TGF-β signaling pathway [31, 32]. In this regard, it has been recently shown that the TGF-β signaling regulator PMEPA1 suppresses prostate cancer metastases to bone [32]. Despite this, the impact of an altered PMEPA1 expression on CRC, as well as the potential underlying mechanisms for such association, still remain to be investigated. Moreover, several miRNA whose expression was strongly down-regulated in metastatic CRC samples, are also involved in the TGFβ signaling pathway; these included the miR-133a, miR-133b, miR-1 and miR-375 miRNAs [33].
Previous studies in which the miRNA signature of metastatic CRC has been investigated, have identified a unique pattern of miRNA which are differentially expressed in metastatic tumors and that include a network of regulatory miRNA-driven interactions involved in the expression of key genes associated with the epithelial to mesenchymal transition (EMT) and tumor metastasis, such as the miR-200 gene family [15]. However, in these studies the transcriptional profiles of the metastatic liver was defined though comparison of the gene expression profile of CRC metastatic tissues against normal liver, despite the background GEP of the tumor present in the liver derives from cells of the (tumoral) intestinal mucosa and not from liver tissues. Similarly, Lin et al. [34] using supervised SAM analysis, identified 963 unique genes to be significantly overexpressed in colorectal liver metastases vs. primary CRC (and normal liver tissue). However, several of the differently expressed genes are known to be up-regulated in normal liver vs colon tissues (i.e.: ARG1, BAAT, BHMT, CDO1, CRHBP, F11, F5, FGL1, HAMP, HAMP and ITIH2).
Of note, miR-122 emerged as the most up-regulated miRNA gene in liver metastases vs. both non-tumoral colorectal mucosa and primary CRC tissues. Overexpression of miR-122 and the simultaneus suppression of its target gene, cationic amino acid transporter 1, has been shown to be involved in the development of colorectal liver metastasis [35]. However, Pizzini et al. [36] have previously suggest that overexpression of miR-122 in CRC liver metastatic tissues could be due to the presence of normal residual liver tissue. Based on an extensive analysis of other liver associated genes, our data suggests this might not be the case and that miR-122 could in fact the overexpression by metastatic liver cells. In this regard, it should be noted that an interesting cross-talk has been reported between hepatocarcinoma cells, through which cells expressing miR-122 send this miRNA via microvesicles to inhibit the proliferation of miR-122 deficient cells. In a reciprocal process, miR-122 deficient cells secrete insulin-like growth factor to decrease miR-122 expression in miR-122 expressing cells [37].
Our results also showed miR-10b to be down-regulated in liver metastatic tissues vs non-tumoral colorectal mucosa. The expression levels of this miRNA in metastataic samples (vs. primary tumors) have previously been correlated with CRC patients survival [36]. In this regard, Hur et al have recently identified a metastasis-specific microRNA signature that includes high miR-10b expression in primary tumors, to be an independent predictor of distant metastasis [38]. In addition, it is also well known that miR-10b functionally contributes to tumor invasion and metastasis in breast cancer [39], and to a worse prognosis in both esophageal [40] and pancreatic cancer patients [41]. Despite all the above, delineation of the specific functional effects of miRNA levels on the expression of mRNA transcripts still remains a challenge. Here we identified several miRNAs whose expression levels were significantly correlated with the amount of mRNA of specific genes. Among other pairs of miRNA-mRNA genes identified, the miR-20a and the DNAJB4 gene transcript emerged in our series, as significantly correlated. DNAJB4 (DnaJ heat shock protein family member B4) is a chaperone with a strong tumor suppressor effect in CRC whose down-regulation has been associated with patient outcome [42]. In this regard, miR-20a has also been shown to induce EMT, to regulate the migration and invasion of SW480 cells [43] and to contribute to an increased chemoresistance of CRC [44]. Of note, here we did not find any (inverse) correlation between the levels of expression of miR-20a and the mRNA levels of other genes reported to be altered IN parallel in CRC such as the PCSK5, RNF152 and SOCS2 genes [45–47]. Other miRNAs which have been found to be altered in CRC include the miR-497, which might mediate overexpression of genes involved in cell proliferation (e.g. PHF19, SKA1, KIF4A) and genes associated with cell migration and invasion (e.g. PTTG1, F2RL1) as well as genes related to the transfer of high energy phosphate from mitochondria, potentially related to the failure to eliminate cancer cells via apoptosis (e.g. CKMT1A) [48, 49].
Interestingly, clearcut discrimination between primary CRC, liver metastases and non-tumoral colorectal tissue could be obtained via those mRNAs found to be most strongly up- and down-regulated exclusively in primary tumors and their liver metastases, as also confirmed in two external series of 47 metastatic CRC [50] and 24 colorectal liver metastases [36]. These results indicate that these gene signatures could potentially serve in the future as prior knowledge for the discovery of biomarker candidates for primary sCRC tumors for early diagnosis, more efficient treatment and/or monitoring of metastatic CRC. In line with this hypothesis, strong expression of the MMP7, CLDN1, TACSTD2, CTHRC1, KRT23 and SRPX2 genes has been previously reported at the protein level in CRC tissues, their expression been also associated with tumor progression and an increased angiogenesis [51]; of note most of these proteins (i.e.: MMP7, TACSTD2, CTHRC1 and KRT23) have also been found to be secreted and to be present in both tumor tissues and the plasma from CRC patients [52]. Therefore, secretion of these proteins outside the tumor cell supports the potential utility of these genes as serum biomarkers for early diagnosis and monitoring of CRC patients. However, additional studies are still required to further validate in non-metastatic CRC the mRNA and miRNA expression profiles here described.
In summary, here we report on a high number of a mRNA and miRNA that are altered in common in (paired) primary and metastatic colorectal tumors, and that allow clearcut distinction between the tumoral and normal colon tissues based on a few mRNAs potentially critical in either the metastatic process and/or the adaption of metastatic cells to the metastatic niche/environment. In this regard, activation of genes associated with the TGFβ signaling pathway emerged as potentially relevant candidate genes in CRC metastasis.
MATERIALS AND METHODS
Patients and samples
Tissue specimens from 23 sporadic colorectal adenocarcinomas and 19 paired liver metastases (n = 42 samples) were obtained from 23 patients with metastatic lesions susceptible of being resected (16 males and 7 females; median age of 66 years, ranging from 48 to 80 years) after informed consent had been given by each subject; in four patients no metastatic liver tissue was available. The studied cases corresponded to 23 consecutive metastatic colorectal cancer patients. Patients underwent surgical resection of both primary and metastatic tumor tissues at the Department of Surgery of the University Hospital of Salamanca (Salamanca, Spain), prior to any cytotoxic therapy was given. Tumor diagnosis and classification was performed according to the AJCC criteria [53]. According to tumor grade, 11 cases were classified as well-differentiated tumors, 10 as moderately- and 2 as poorly-differentiated carcinomas. In all cases, histopathological grade was systematically confirmed in a second independent evaluation by an experienced pathologist (M.A.A and OB). Median follow-up at the moment of closing the study was of 25 months (range: 11–39 months).
Primary tumors were localized in the rectum (n = 11) and either in the right (cecum, ascending or transverse) or the left (descending and sigmoid) colon (n = 12). The mean size of the primary tumors was of 5.4 ± 2.0 cm with the following distribution according to their TNM stage at diagnosis [54]: T3N0M0, 2 cases; T3N1M1, 8; T3N1M0, 1; T3N0M1, 3; T3N2M1, 2; T4N0M1, 2; T4N1M1, 1; T4N2M1, 2; T2N0M0, 1 and; T3N2M0, 1 case. Eighteen liver metastases were synchronous and 5 were metachronous metastases. The mean size of liver metastases was of 3.6 ± 2.1 cm. The most relevant clinical and laboratory data for each individual metastatic colorectal cancer patient studied is summarized in Supplementary Table 1.
Colorectal tissue samples not required for diagnostic purpose were collected immediately after surgical resection, snap frozen and stored in OCT at −80°C (Tumor Biobank of the University Hospital of Salamanca, Red de Bancos de Tumores de Castilla y León, Salamanca, Spain). Once the histopathological diagnosis had been established, sections from paraffin-embedded tissue samples were cut from three different areas representative of the tumor tissue with > 70% tumor cell infiltration by hematoxylin-eosin staining, after excluding stroma-enriched tumor areas. In order to enrich the tumor cells, the neighbour areas of those containing ≥ 70% tumor cells, as well as liver tissue samples were then microdissected from the frozen tumor tissue samples stored in OCT, following the pathologist criteria. Normal mucosa samples (n = 9) were taken at a minimum distance of 10 cm from the tumor site. The study was approved by the local ethics committee (University Hospital of Salamanca, Salamanca, Spain).
RNA extraction and gene expression profiling (GEP) microarray studies
For GEP, sample preparation was performed as described in the Affymetrix GeneChip Expression Analysis Manual (Santa Clara, CA, USA). Briefly, each frozen tissue (≥ 0.3 g) was crushed to powder at cryogenic temperatures and homogeneized in Trizol (Life Technologies Inc, Rockville, MD). Total RNA was then extracted using the miRNeasy mini kit according to the instructions of the manufacturer (Qiagen, Valencia, CA); subsequently, the quality and integrity of the RNA was evaluated in an Agilent 2100 Bioanalyzer (Agilent Technologies Inc, Santa Clara, CA). Total RNA (100–1000 ng) from both tumoral and non-tumoral colorectal tissues was hybridized to both the Affymetrix PimeView Human Gene Expression and the microRNA 3.0 Expression arrays, following the instructions of the manufacturer. Fluorescence signals were detected using the GeneChip Scanner 3000 7G (Affymetrix) and data stored as .CEL files. GEP raw data has been deposited in the Gene Expression Omnibus (GEO) database with the GSE81582 accession number, includes data based on sets of 49,395 and 5,683 probes for the Affymetrix PimeView Human Gene Expression microarray and the microRNA 3.0 microarray, respectively.
For data analysis, GEP raw data was normalized with the Robust Multi-array Average (RMA) algorithm, which included sequential background correction, intra- and inter-microarray well normalization, probe set summarization and calculation of expression signals [55]. Unsupervised classification of samples and genes was performed by MultiDimensional Scaling (MDS) and hierarchical clustering analyses (HCA) based on the expression signal detected for each gene for each probe set, and the Simfit statistical software (http://www.simfit.org.uk/). Clustering was run using Euclidean distances and the linkage method group average. Differentially expressed (miRNA and mRNA) genes between tumoral and non-tumoral samples were identified by supervised two-class unpaired Significance Analysis of Microarray (SAM) [56] based on a q-value cut off ≤ .01 and an absolute fold change cutoff ≥ 2.0. Differentially expressed mRNA and miRNA in pairwise group comparisons, involving groups of samples paired per patient (n = 19 paired liver metastasis vs 19 primary tumor samples) were calculated with SAM using a two-class pair wise design. The false discovery rate (FDR) cutoff for statistical significance was set at values < .01.
For the identification of miRNA candidates acting as gene-regulators in colorectal samples, Pearson correlation analysis was performed to identify significant associations between deregulated miRNA and mRNA gene transcripts in both primary colorectal tumors (vs. non-tumoral colorectal tissues) and colorectal liver metastases (vs. non-tumoral colorectal tissues) through the psych R-package, based on an adjusted FDR of ≤ .05. Each potential miRNA-mRNA interaction identified was subsequently evaluated against databases of experimentally validated miRNA interactions (TarBase 6.0 and miRWalk-database) and miRNA target prediction tools (DIANA-microT-CDS v5.0, miRWalk-database and miRecords) [57, 58]. Functional enrichment analysis of deregulated genes, as well as analysis of canonical pathways, was based on the use of the WebGestalt suite (http://bioinfo.vanderbilt.edu/webgestalt).
Enrichment of kyoto encyclopedia of genes and genomes (KEGG) pathways
To identify significantly altered KEGG pathways for each comparison performed, we applied the hypergeometric distribution statistical test was applied to calculate the probability of overlap of the deregulated transcripts, targets of significantly differentially expressed miRNAs, and gene expression involved in KEGG pathways; p-values were corrected using the Benjamini-Hochberg .
Validation of miRNA expression profiles by quantitative real-time PCR (QR-PCR)
TaqMan miRNA expression assays were used to validate GEP in the same samples that were used for the microarray studies, via the Step One Plus Real-Time PCR System -Applied Biosystems (ABI), Foster City, CA, USA- according to the manufacturer’s instructions. The assays ID for the miRNAs studied were as follows: 002245 (hsa-miR-122), 2246 (hsa-miR-133a), 002249 (hsa-miR-143) and 461910 (hsa-miR-4417). Each PCR was carried out in duplicate in a final volume of 10 uL using the TaqMan Fast Universal Mastermix (ABI) and the following cycling parameters: incubation at 95°C (20s), followed by 50 cycles at 95°C (1s) and an incubation at 60°C (20s). miRNA expression data was normalized against the RNU43 internal control, and it was further analyzed using the StepOne software (v2.0; ABI). The relative amounts of the quantified miRNAs were calculated using the following equation: 2−ΔCT (ΔCT = CT GENE-CT RNU43) expressed as arbitrary units (AU). For all genes evaluated, RQ-PCR results showed a high degree of correlation with microarray data (r2 ≥ 0.79, p < .0001; Supplementary Figure 2).
External validation series of sCRC tumors
External validation of the predictive value of those differentially expressed genes found in our series to discriminate between primary tumors and non-tumoral colorectal tissues, was performed in a group of previously reported metastatic sCRC patients (n = 47) from whom GEP array data files (Affymetrix Human Genome U133 Plus 2.0 Array) are publicly available at the GEO database (accession number GSE21510) [50]. Additionally, to discriminate between liver metastases and non-tumoral colorectal tissues, we performed an external validation in another group of previously reported metastatic sCRC patients (n = 24) from whom GEP array data files (Affymetrix Human Exon 1.0 ST Array) are also publicly available at the GEO database (accession number GSE35834) [36].
Downloaded data CEL files were normalized using the RMA algorithm and overlapping probe sets were defined on the basis of probe specificity, using the GATExplorer server [59]. Probe sets with the best specificity to the interrogated genes were selected, and the expression signals detected for each gene for each probe set were further analyzed using the column metric preserving biplot assay [60] implemented in the SIMFIT statistical software (http://www.simfit.org.uk/).
External validation series of DEFB1, COL12A1 and PTGER3 gene expression
External validation of those genes found to be differentially expressed in our series between primary tumors and their corresponding liver metastases (DEFB1, COL12A1 and PTGER3), was performed in a group of previously reported metastatic sCRC patients (n = 18) from whom RNA-seq data files (Illumina, CA) are publicly available at the GEO database (accession number GSE50760) [61]; in line with our observations, these results confirmed the existence of significant differences in the expression of the DEFB1, COL12A1 and PTGER3 genes between paired primary tumor and their corresponding liver metastases (Supplementary Figure 3).
Other statistical methods
The Mann-Whitney U test and a linear regression model were used to evaluate the statistical significance of differences observed between groups and to explore the degree of correlation between different variables, respectively (SPSS version 15.0; IBM; NY; USA). P-values ≤ .05 were considered to be associated with statistical significance.
CONFLICTS OF INTEREST
None.
FUNDING
This work has been partially supported by grants from the Instituto de Salud Carlos III (ISCIII; Ministerio de Sanidad y Consumo, Madrid, Spain) (PI12/02053-FIS), Gerencia Regional de Salud de Castilla y León, Valladolid, Spain (GRS1302/A/16), Consejería de Sanidad (Junta de Castilla y Leon, Valladolid, Spain) (BIO/SA02/13 and BIO/SA46/14), RTICC from the ISCIII (RD12/0020/0035-FEDER, RD12/0036/0048-FEDER), Fundación Memoria de Don Samuel Solórzano Barruso, (Salamanca, Spain) and Fundación Eugenio Rodríguez Pascual, (Madrid, Spain). JM Sayagués and ME Sarasquete are supported by grants (CES11/004 and CP13/00080; respectively) from the ISCIII, Ministerio de Ciencia e Innovación, Madrid, Spain.
REFERENCES
1. Tsai HL, Lu CY, Hsieh JS, Wu DC, Jan CM, Chai CY, Chu KS, Chan HM, Wang JY. The prognostic significance of total lymph node harvest in patients with T2–4N0M0 colorectal cancer. J Gastrointest Surg. 2007; 11:660–5.
2. Macartney-Coxson DP, Hood KA, Shi HJ, Ward T, Wiles A, O’Connor R, Hall DA, Lea RA, Royds JA, Stubbs RS, Rooker S. Metastatic susceptibility locus, an 8p hot-spot for tumour progression disrupted in colorectal liver metastases: 13 candidate genes examined at the DNA, mRNA and protein level. BMC Cancer. 2008; 8:187.
3. Vogelstein B, Fearon ER, Hamilton SR, Kern SE, Preisinger AC, Leppert M, Nakamura Y, White R, Smits AM, Bos JL. Genetic alterations during colorectal-tumor development. N Engl J Med. 1988; 319:525–32.
4. Fearon ER, Hamilton SR, Vogelstein B. Clonal analysis of human colorectal tumors. Science. 1987; 238:193–7.
5. Negri FV, Bozzetti C, Lagrasta CA, Crafa P, Bonasoni MP, Camisa R, Pedrazzi G, Ardizzoni A. PTEN status in advanced colorectal cancer treated with cetuximab. Br J Cancer. 2010; 102:162–4.
6. Lan YT, Jen-Kou L, Lin CH, Yang SH, Lin CC, Wang HS, Chen WS, Lin TC, Jiang JK, Chang SC. Mutations in the RAS and PI3K pathways are associated with metastatic location in colorectal cancers. J Surg Oncol. 2015; 111:905–10.
7. Xu X, Chen R, Li Z, Huang N, Wu X, Li S, Li Y, Wu S. MicroRNA-490–3p inhibits colorectal cancer metastasis by targeting TGFbetaR1. BMC Cancer. 2015; 15:1023.
8. Mollevi DG, Serrano T, Ginesta MM, Valls J, Torras J, Navarro M, Ramos E, Germà JR, Jaurrieta E, Moreno V, Figueras J, Capellà G, Villanueva A. Mutations in TP53 are a prognostic factor in colorectal hepatic metastases undergoing surgical resection. Carcinogenesis. 2007; 28:1241–6.
9. Mlcochova J, Faltejskova-Vychytilova P, Ferracin M, Zagatti B, Radova L, Svoboda M, Nemecek R, John S, Kiss I, Vyzula R, Negrini M, Slaby O1. MicroRNA expression profiling identifies miR-31–5p/3p as associated with time to progression in wild-type RAS metastatic colorectal cancer treated with cetuximab. Oncotarget. 2015; 6:38695–704. doi: 10.18632/oncotarget.5735.
10. Chang SW, Yue J, Wang BC, Zhang XL. miR-503 inhibits cell proliferation and induces apoptosis in colorectal cancer cells by targeting E2F3. Int J Clin Exp Pathol. 2015; 8:12853–60.
11. Zheng K, Liu W, Liu Y, Jiang C, Qian Q. MicroRNA-133a suppresses colorectal cancer cell invasion by targeting Fascin1. Oncol Lett. 2015; 9:869–74.
12. Gutierrez ML, Corchete L, Teodosio C, Sarasquete ME, del Mar AM, Iglesias M, Esteban C, Sayagues JM, Orfao A, Muñoz-Bellvis L. Identification and characterization of the gene expression profiles for protein coding and non-coding RNAs of pancreatic ductal adenocarcinomas. Oncotarget. 2015; 6:19070–86. doi: 10.18632/oncotarget.4233.
13. Kopetz S, Tabernero J, Rosenberg R, Jiang ZQ, Moreno V, Bachleitner-Hofmann T, Lanza G, Stork-Sloots L, Maru D, Simon I, Capellà G, Salazar R. Genomic classifier ColoPrint predicts recurrence in stage II colorectal cancer patients more accurately than clinical factors. Oncologist. 2015; 20:127–33.
14. Kelley RK, Van Bebber SL, Phillips KA, Venook AP. Personalized medicine and oncology practice guidelines: a case study of contemporary biomarkers in colorectal cancer. J Natl Compr Canc Netw. 2011; 9:13–25.
15. Mudduluru G, Abba M, Batliner J, Patil N, Scharp M, Lunavat TR, Leupold JH, Oleksiuk O, Juraeva D, Thiele W, Rothley M, Benner A, Ben-Neriah Y, et al. A Systematic Approach to Defining the microRNA Landscape in Metastasis. Cancer Res. 2015; 75:3010–9.
16. Munoz-Bellvis L, Fontanillo C, Gonzalez-Gonzalez M, Garcia E, Iglesias M, Esteban C, Gutierrez ML, Abad MM, Bengoechea O, De Las Rivas J, Orfao A, Sayagués JM. Unique genetic profile of sporadic colorectal cancer liver metastasis versus primary tumors as defined by high-density single-nucleotide polymorphism arrays. Mod Pathol. 2012; 25:590–601.
17. Furi I, Kalmar A, Wichmann B, Spisak S, Scholler A, Bartak B, Tulassay Z, Molnár B. Cell Free DNA of Tumor Origin Induces a ‘Metastatic’ Expression Profile in HT-29 Cancer Cell Line. PLoS ONE. 2015; 10:e0131699.
18. Peng X, Luo Z, Kang Q, Deng D, Wang Q, Peng H, Wang S, Wei Z. FOXQ1 mediates the crosstalk between TGF-beta and Wnt signaling pathways in the progression of colorectal cancer. Cancer Biol Ther. 2015; 16:1099–109.
19. Kinugasa T, Akagi Y, Ochi T, Tanaka N, Kawahara A, Ishibashi Y, Gotanda Y, Yamaguchi K, Shiratuchi I, Oka Y, Kage M, Shirouzu K. Increased claudin-1 protein expression in hepatic metastatic lesions of colorectal cancer. Anticancer Res. 2012; 32:2309–14.
20. Yang B, Cao L, Liu B, McCaig CD, Pu J. The transition from proliferation to differentiation in colorectal cancer is regulated by the calcium activated chloride channel A1. PLoS ONE. 2013; 8:e60861.
21. Zhu J, Li C, Ji W. Identification of genes in ulcerative colitis associated colorectal cancer based on centrality analysis of co-expression network. Neoplasma. 2015; 62:756–64.
22. Peng Y, Li X, Wu M, Yang J, Liu M, Zhang W, Xiang B, Wang X, Li X, Li G, Shen S. New prognosis biomarkers identified by dynamic proteomic analysis of colorectal cancer. Mol Biosyst. 2012; 8:3077–88.
23. Wang L, Hahnloser D, Boardman LA, Burgart LJ, French AJ, Thibodeau S. Loss of expression of zymogen granule protein 16 in colorectal cancer. Cancer Res Abstract. 2005; 1:452.
24. Yasui Y, Tanaka T. Protein expression analysis of inflammation-related colon carcinogenesis. J Carcinog. 2009; 8:10.
25. Pandurangan AK. Potential targets for prevention of colorectal cancer: a focus on PI3K/Akt/mTOR and Wnt pathways. Asian Pac J Cancer Prev. 2013; 14:2201–5.
26. Jung HC, Eckmann L, Yang SK, Panja A, Fierer J, Morzycka-Wroblewska E, Kagnoff MF. A distinct array of proinflammatory cytokines is expressed in human colon epithelial cells in response to bacterial invasion. J Clin Invest. 1995; 95:55–65.
27. Marszalowicz GP, Snook AE, Magee MS, Merlino D, Berman-Booty LD, Waldman SA. GUCY2C lysosomotropic endocytosis delivers immunotoxin therapy to metastatic colorectal cancer. Oncotarget. 2014; 5:9460–71. doi: 10.18632/oncotarget.2455.
28. Szmida E, Karpinski P, Leszczynski P, Sedziak T, Kielan W, Ostasiewicz P, Sasiadek MM. Aberrant methylation of ERBB pathway genes in sporadic colorectal cancer. J Appl Genet. 2015; 56:185–92.
29. Caro XJ. New concepts in primary fibrositis syndrome. Compr Ther. 1989; 15:14–22.
30. Zhang GJ, Zhou H, Xiao HX, Li Y, Zhou T. MiR-378 is an independent prognostic factor and inhibits cell growth and invasion in colorectal cancer. BMC Cancer. 2014; 14:109.
31. Brunschwig EB, Wilson K, Mack D, Dawson D, Lawrence E, Willson JK, Lu S, Nosrati A, Rerko RM, Swinler S, Beard L, Lutterbaugh JD, et al. PMEPA1, a transforming growth factor-beta-induced marker of terminal colonocyte differentiation whose expression is maintained in primary and metastatic colon cancer. Cancer Res. 2003; 63:1568–75.
32. Fournier PG, Juarez P, Jiang G, Clines GA, Niewolna M, Kim HS, Walton HW, Peng XH, Liu Y, Mohammad KS, Wells CD, Chirgwin JM, Guise TA. The TGF-beta Signaling Regulator PMEPA1 Suppresses Prostate Cancer Metastases to Bone. Cancer Cell. 2015; 27:809–21.
33. Butz H, Racz K, Hunyady L, Patocs A. Crosstalk between TGF-beta signaling and the microRNA machinery. Trends Pharmacol Sci. 2012; 33:382–93.
34. Lin AY, Chua MS, Choi YL, Yeh W, Kim YH, Azzi R, Adams GA, Sainani K, van de Rijn M, So SK, Pollack JR. Comparative profiling of primary colorectal carcinomas and liver metastases identifies LEF1 as a prognostic biomarker. PLoS ONE. 2011; 6:e16636.
35. Iino I, Kikuchi H, Miyazaki S, Hiramatsu Y, Ohta M, Kamiya K, Kusama Y, Baba S, Setou M, Konno H. Effect of miR-122 and its target gene cationic amino acid transporter 1 on colorectal liver metastasis. Cancer Sci. 2013; 104:624–30.
36. Pizzini S, Bisognin A, Mandruzzato S, Biasiolo M, Facciolli A, Perilli L, Rossi E, Esposito G, Rugge M, Pilati P, Mocellin S, Nitti D, Bortoluzzi S, et al. Impact of microRNAs on regulatory networks and pathways in human colorectal carcinogenesis and development of metastasis. BMC Genomics. 2013; 14:589.
37. Basu S, Bhattacharyya SN. Insulin-like growth factor-1 prevents miR-122 production in neighbouring cells to curtail its intercellular transfer to ensure proliferation of human hepatoma cells. Nucleic Acids Res. 2014; 42:7170–85.
38. Hur K, Toiyama Y, Schetter AJ, Okugawa Y, Harris CC, Boland CR, Goel A. Identification of a metastasis-specific MicroRNA signature in human colorectal cancer. J Natl Cancer Inst. 2015; 107.
39. Ma L, Teruya-Feldstein J, Weinberg RA. Tumour invasion and metastasis initiated by microRNA-10b in breast cancer. Nature. 2007; 449:682–8.
40. Tian Y, Luo A, Cai Y, Su Q, Ding F, Chen H, Liu Z. MicroRNA-10b promotes migration and invasion through KLF4 in human esophageal cancer cell lines. J Biol Chem. 2010; 285:7986–94.
41. Nakata K, Ohuchida K, Mizumoto K, Kayashima T, Ikenaga N, Sakai H, Lin C, Fujita H, Otsuka T, Aishima S, Nagai E, Oda Y, Tanaka M. MicroRNA-10b is overexpressed in pancreatic cancer, promotes its invasiveness, and correlates with a poor prognosis. Surgery. 2011; 150:916–22.
42. Liu Y, Zhou J, Zhang C, Fu W, Xiao X, Ruan S, Zhang Y, Luo X, Tang M. HLJ1 is a novel biomarker for colorectal carcinoma progression and overall patient survival. Int J Clin Exp Pathol. 2014; 7:969–77.
43. Zhang GJ, Li Y, Zhou H, Xiao HX, Zhou T. miR20a is an independent prognostic factor in colorectal cancer and is involved in cell metastasis. Mol Med Rep. 2014; 10:283–91.
44. Chai H, Liu M, Tian R, Li X, Tang H. miR-20a targets BNIP2 and contributes chemotherapeutic resistance in colorectal adenocarcinoma SW480 and SW620 cell lines. Acta Biochim Biophys Sin (Shanghai). 2011; 43:217–25.
45. Choi S, Korstanje R. Proprotein convertases in high-density lipoprotein metabolism. Biomark Res. 2013; 1:27.
46. Wang JL, Lin YW, Chen HM, Kong X, Xiong H, Shen N, Hong J, Fang JY. Calcium prevents tumorigenesis in a mouse model of colorectal cancer. PLoS ONE. 2011; 6:e22566.
47. Letellier E, Schmitz M, Baig K, Beaume N, Schwartz C, Frasquilho S, Antunes L, Marcon N, Nazarov PV, Vallar L, Even J, Haan S. Identification of SOCS2 and SOCS6 as biomarkers in human colorectal cancer. Br J Cancer. 2014; 111:726–35.
48. Jiang Y, Meng Q, Qi J, Shen H, Sun S. MiR-497 promotes metastasis of colorectal cancer cells through Nrdp1 inhibition. Tumour Biol. 2015; 36:7641–7.
49. Qian XL, Li YQ, Gu F, Liu FF, Li WD, Zhang XM, Fu L. Overexpression of ubiquitous mitochondrial creatine kinase (uMtCK) accelerates tumor growth by inhibiting apoptosis of breast cancer cells and is associated with a poor prognosis in breast cancer patients. Biochem Biophys Res Commun. 2012; 427:60–6.
50. Tsukamoto S, Ishikawa T, Iida S, Ishiguro M, Mogushi K, Mizushima H, Uetake H, Tanaka H, Sugihara K. Clinical significance of osteoprotegerin expression in human colorectal cancer. Clin Cancer Res. 2011; 17:2444–50.
51. Uhlen M, Oksvold P, Fagerberg L, Lundberg E, Jonasson K, Forsberg M, Zwahlen M, Kampf C, Wester K, Hober S, Wernerus H, Björling L, Ponten F. Towards a knowledge-based Human Protein Atlas. Nat Biotechnol. 2010; 28:1248–50.
52. Nanjappa V, Thomas JK, Marimuthu A, Muthusamy B, Radhakrishnan A, Sharma R, Ahmad Khan A, Balakrishnan L, Sahasrabuddhe NA, Kumar S, Jhaveri BN, Sheth KV, Kumar Khatana R, et al. Plasma Proteome Database as a resource for proteomics research: 2014 update. Nucleic Acids Res. 2014; 42:D959–D965.
53. World Health Organization. WHO International Histological Classification of Tumors, Vol 1–25. Geneva, 1967–1981; 2nd edn, Berlin: Springer-Verlag, 1988-. 1992.
54. Greene FL. Current TNM staging of colorectal cancer. Lancet Oncol. 2007; 8:572–3.
55. Saeed AI, Sharov V, White J, Li J, Liang W, Bhagabati N, Braisted J, Klapa M, Currier T, Thiagarajan M, Sturn A, Snuffin M, Rezantsev A, et al. TM4: a free, open-source system for microarray data management and analysis. Biotechniques. 2003; 34:374–8.
56. Tusher VG, Tibshirani R, Chu G. Significance analysis of microarrays applied to the ionizing radiation response. Proc Natl Acad Sci USA. 2001; 98:5116–21.
57. Dweep H, Sticht C, Pandey P, Gretz N. miRWalk--database: prediction of possible miRNA binding sites by “walking” the genes of three genomes. J Biomed Inform. 2011; 44:839–47.
58. Xiao F, Zuo Z, Cai G, Kang S, Gao X, Li T. miRecords: an integrated resource for microRNA-target interactions. Nucleic Acids Res. 2009; 37(Database issue):D105-D110.
59. Risueno A, Fontanillo C, Dinger ME, De las RJ. GATExplorer: genomic and transcriptomic explorer; mapping expression probes to gene loci, transcripts, exons and ncRNAs. BMC Bioinformatics. 2010; 11:221.
60. Gabriel KR, Odoroff CL. Biplots in biomedical research. Stat Med. 1990; 9:469–85.
61. Kim SK, Kim SY, Kim JH, Roh SA, Cho DH, Kim YS, Kim JC. A nineteen gene-based risk score classifier predicts prognosis of colorectal cancer patients. Mol Oncol. 2014; 8:1653–66.