
INTRODUCTION
Colorectal cancer (CRC) is the third most common cancer and the third leading cause of cancer death in the United States [1]. Lymph node status is accepted as one of the most important prognostic factors in colorectal cancer [2]. The classic staging system for colorectal cancer is the tumor node metastasis (TNM) staging system, which stages lymph node involvement according to the absolute number of positive lymph nodes [2]. However, the TNM system does not take into account examined tumor-free lymph nodes. Therefore, lymph node ratio (LNR) has recently emerged as an important prognostic factor and a suitable staging method for node positive patients [3–5]. Nevertheless, it was still under controversy due to contradictory LNR consequences in the previous studies [6, 7]. A previous systematic review considered the evidence on LNR as a prognostic factor in the colorectal cancer [3]. However, the main research tool for this study is systemic review (only four series submitted for meta analysis). Since many new studies in the last years have investigated this topic and the last review date was around ten year ago, we aimed to clarify the prognostic role of NLR in patients with lymph node-positive colorectal cancer and conduct the first meta-analysis on this topic.
RESULTS
Eligible and characteristics of studies
We identified 1598 potentially relevant articles from our search of the published literature. After removing duplications, scanning titles and abstracts and reading the full-text, 33 records [5, 7–38] encompassing a total of 81,331 (75,838 node positive) CRC patients were eligible for the present study based on our inclusion and exclusion criteria (Figure 1).
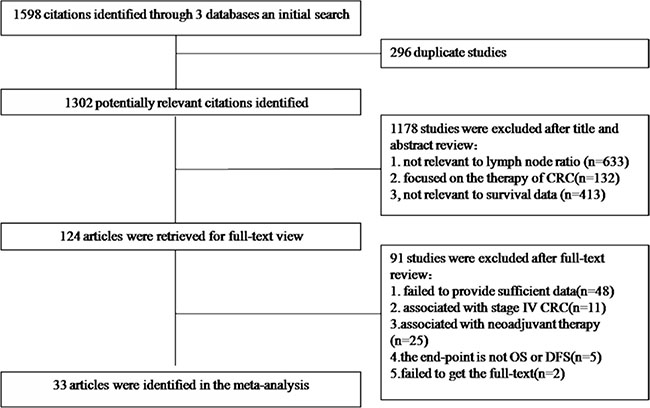
Figure 1: A flow chart showed the selection of studies.
Demographic details and clinicopathologic characteristics of the included studies were summarized in Table 1 and Table 2. The 75838 node positive colorectal cancer patients were all underwent curative surgery, and their median age ranged from 54 to 75 years. Of all the 33 studies, 16 were focused on colon cancer, 5 on rectal cancer, and 12 considered both the colon and the rectum. We also investigated the situation of lymph nodes harvested and the treatment strategy (Table 2). The follow-up time ranged from 30.2 months to 86 months. The patients included in this study were diagnosed between 1991 and 2012.
Table 1: Demographic details of all identified studies
Study |
Year |
Sample |
Patient age |
Follow-up time |
Country |
Endpoint |
|---|---|---|---|---|---|---|
Xue |
2014 |
180 |
Median 54 years |
Median 49 months |
China |
DFS |
Arda |
2014 |
58 |
Median 60 years |
Mean 4-year |
Turkey |
OS DFS |
Wang |
2013 |
245 |
Median 61 years |
Mean 6-year |
China |
OS |
Yen |
2013 |
612 |
Median 67 years |
Median 52 months |
Taiwan |
OS,DFS |
Tiago |
2013 |
70 |
NA |
Median 33 months |
Brazil |
DFS |
Zhu |
2012 |
161 |
Mean 59.1 years |
NA |
China |
OS DFS |
Liang |
2012 |
174 |
Mean 62 years |
Median 62.5 months |
China |
OS DFS |
Kritsanasakul |
2012 |
227 |
Mean 62.8 years |
Median 86 months |
Thailand |
OS |
Jung |
2012 |
78 |
Median 64 years |
Median 46 months |
Korea |
OS DFS |
Shimomura |
2011 |
266 |
Median 64 years |
Median 42.4 months |
Japan |
DFS |
Hong |
2011 |
130 |
Mean 64 years |
Median 50 months |
Korea |
DFS |
Greenberg |
2011 |
65 |
Mean 69 years |
Mean 34 moths |
Israel |
OS,DFS |
Vaccaro |
2009 |
362 |
Mean 67.4 years |
Median 42 months |
Argentina |
OS DFS |
Galizia |
2009 |
145 |
Median 66 years |
Median 43 months |
Italy |
DFS |
Wang |
2012 |
256 |
Mean 57.9 |
Median 37 months |
China |
OS |
Jing |
2012 |
145 |
Median 66 years |
Median 35.4 months |
China |
DFS |
Tong |
2011 |
505 |
Median 61 years |
Median 31.08 months |
China |
OS |
Shao |
2011 |
282 |
NA |
NA |
China |
OS |
Jung |
2010 |
514 |
Median 63 years |
Median 48.5 months |
Korea |
OS DFS |
Wang |
2008 |
24477 |
Mean 69.2 years |
NA |
America |
OS |
Peng |
2008 |
318 |
Mean 55.3 years |
Median 41 months |
China |
OS, DFS |
Derwinger |
2008 |
265 |
Mean 72 years |
Mean 3-year |
Sweden |
DFS |
Lee |
2007 |
201 |
Median 59 years |
Median 41 months |
Korea |
DFS |
Chin |
2009 |
624 |
Mean 64.1 years |
Mean 5-year |
Taiwan |
DFS |
Arslan |
2014 |
440 |
Median 66 years |
Median 30.6 months |
Turkey |
OS |
Kim |
2009 |
232 |
NA |
Median 53 months |
Korea |
OS |
Kobayashi |
2011 |
452 |
NA |
Median 5.3 years |
Japan |
OS |
Lykke |
2013 |
3119 |
Median 72 years |
Mean 5-year |
Denmark |
OS |
Moug |
2014 |
1514 |
Mean 71.9 years |
Median 5.3 years |
Scotland |
OS |
Thoma |
2012 |
1908 |
Mean 68 years |
Median 30.2 months |
England |
OS |
Parnaby |
2015 |
921 |
Median 75 years |
Median 52.8 months |
England |
OS,DFS |
Chen |
2011 |
36712 |
Mean 69.6 years |
NA |
America |
OS |
Zhou |
2015 |
180 |
Mean 59 years |
Median 41.8 months |
China |
OS |
“NA”: not available; “OS”: overall survival;”DFS”: disease free survival.
Table 2: Clinicopathologic characteristics of all studies
Study |
Stage |
Location |
Inclusion period |
Treatment |
No. of nodes (N+) |
|---|---|---|---|---|---|
Xue |
III |
colorectum |
2007–2012 |
R0 surgery |
median 8,(2) |
Arda |
III |
colon |
2006–2014 |
R0 surgery |
NA |
Wang |
III |
colorectum |
2000–2006 |
R0 surgery + AT |
NA |
Yen |
III |
colorectum |
2004–2008 |
R0 surgery + AT |
median 18,(3) |
Tiago |
III |
colon |
2005–2010 |
R0 surgery |
median 18.5 |
Zhu |
III |
rectum |
2005–2010 |
R0 surgery |
mean 13.4 |
Liang |
III |
colorectum |
2000–2003 |
R0 surgery |
median 10,(3) |
Kritsanasakul |
I–III |
colorectum |
1998–2007 |
R0 surgery + AT |
median 10 (1.7) |
Jung |
I–III |
colon |
1999–2007 |
R0 surgery + AT |
median 7 |
Shimomura |
III |
colorectum |
1991–2008 |
R0 surgery + AT |
median 14,(2) |
Hong |
III |
colon |
2000–2006 |
R0 surgery + AT |
median 28,(2) |
Greenberg |
I–III |
colorectum |
2003–2009 |
R0 surgery + AT |
median 16 |
Vaccaro |
III |
colorectum |
1980–2005 |
R0 surgery + AT |
median 20,(2) |
Galizia |
III |
colon |
1996–2007 |
R0 surgery + AT |
median 15,(2) |
Wang |
III |
colon |
1999–2008 |
R0 surgery + AT |
mean 23.3(4.2) |
Jing |
III |
colon |
1998–2008 |
R0 surgery + AT |
mean 13.22(3.77) |
Tong |
III |
colorectum |
1994–2007 |
R0 surgery |
median 12,(2) |
Shao |
II–III |
colorectum |
2000–2005 |
R0 surgery |
mean 11.44(2.21) |
Jung |
III |
colorectum |
1998–2007 |
R0 surgery + AT |
median 14,(2) |
Wang |
III |
colon |
1988–2003 |
curative surgery |
NA |
Peng |
III |
rectum |
1990–2004 |
R0 surgery + AT |
mean 12(3.8) |
Derwinger |
III |
colon |
1999–2003 |
R0 surgery + AT |
median 11 |
Lee |
III |
colon |
1995–2001 |
R0 surgery + AT |
median 17,(3) |
Chin |
III |
colon |
1995–2003 |
R0 surgery + AT |
NA |
Arslan |
I–III |
colon |
2005–2011 |
R0 surgery |
median 19 |
Kim |
III |
rectum |
1996–2006 |
R0 surgery + AT |
median 17,(3) |
Kobayashi |
III |
rectum |
1991–1998 |
R0 surgery + AT |
median 37(2) |
Lykke |
I–III |
colon |
2003–2008 |
R0 surgery |
median 13(2) |
Moug |
I–III |
colon |
2000–2004 |
R0 surgery + AT |
median 11 |
Thoma |
III |
colorectum |
1997–2007 |
R0 surgery + AT |
median 11(4) |
Parnaby |
I–III |
colon |
2006–2012 |
R0 surgery + AT |
median 16 |
Chen |
III |
colon |
1992–2004 |
R0 surgery |
NA |
Zhou |
II–III |
rectum |
2005–2010 |
R0 surgery + AT |
median 11(4) |
“AT”: adjuvant treatment; “No. of nodes (N+)”: total number of lymph nodes harvested (number of positive lymph nodes); “NA”: not available.
All the HRs and their 95% CIs in the collected articles were listed in Table 3. We also summarized the methodological quality details. Firstly, the cut-off value of the LNRs was quite different from each other and stratified methods were not consistent (Table 3). Secondly, almost all of researchers used the multivariate statistical analysis models. Thirdly, most studies were retrospective study in design, while 5 articles were designed as the prospectively studies. Regarding the relationship between LNR and the clinicopathological characteristics of node positive colorectal cancer patients, no significant differences emerged for mean age and gender. Furthermore, the LNR was not associated with tumor location or T stage [15, 23, 39]. Higher LNR patients have, however, significant major proportion of a higher lymphovascular invasion and poor differentiation [15, 23, 39].
Table 3: Summary table of HRs (95% CI) and HR calculation
Study |
HR (95%CI) |
LNR cutoff value |
LNR stratification |
Statistical analysis |
Study design |
|---|---|---|---|---|---|
OS |
|||||
Arda |
1.712 (0.982–2.984) |
0.25 |
NA |
MA |
R |
Wang |
1.641 (1.099–2.450) |
0.3 |
Log rank analysis |
MA |
R |
Yen |
1.54 (1.05–2.22) |
0.17 |
Log rank analysis |
MA |
R |
Zhu |
3.655 (1.939–6.888) |
0.43 |
Mean |
MA |
R |
Liang |
1.42 (1.13–1.76) |
0.125, 0.26, 0.5 |
Quartiles |
MA |
R |
Kritsanasakul |
2.62 (1.79–3.85) |
0.35, 0.69 |
ROC curve analysis |
MA |
R |
Jung |
1.402 (1.265–4.564) |
0, 0.01, 0.28 |
Median value |
MA |
R |
Greenberg |
12.2 (2.178–68.622) |
0.13 |
ROC curve analysis |
MA |
R |
Vaccaro |
2.3 (1.3–4.1) |
0.25 |
Quartiles |
MA |
R |
Wang |
1.754 (1.344–2.289) |
0.11, 0.39 |
Log rank analysis |
MA |
P |
Tong |
1.958 (1.652–2.321) |
0.35, 0.69 |
Log rank analysis |
MA |
R |
Shao |
1.263 (1.027–1.552) |
0, 0.17, 0.41, 0.69 |
Literature data |
MA |
R |
Jung |
1.589 (1.106–2.284) |
0.18 |
Quartiles |
MA |
R |
Wang |
2.30 (2.083–2.545) |
1/14, 0.25, 0.5 |
ROC curve analysis |
MA |
SEER |
Peng |
3.41 (1.63–7.13) |
0.14, 0.49 |
Literature data |
MA |
R |
Arslan |
2.197 (1.357–3.556) |
0.05, 0.20 |
NA |
UA |
P |
Kim |
2.261(1.234–4.143) |
0.1, 0.2, 0.4 |
Quartiles |
MA |
R |
Kobayashi |
2.114 (1.241–3.600) |
0.04, 0.079, 0.15 |
Quartiles |
MA |
R |
Lykke |
1.560 (1.232–1.975) |
0, 1/12, 1/4 , 1/2 |
Literature data |
MA |
P |
Moug |
2.117 1.350–3.318) |
0.05, 0.19, 0.39 |
Literature data |
MA |
P |
Thoma |
1.799 (1.132–2.859 ) |
0, 0.11 ,0.21, 0.36, 0.60 |
NA |
MA |
P |
Parnaby |
2.464 (1.487–4.083) |
0, 0.17, 0.41, 0.69 |
Literature data |
MA |
L |
Chen |
1.975 (1.519–2.568) |
0.1, 0.24, 0.49, 0.99, 1 |
Log rank analysis |
MA |
SEER |
Zhou |
1.71 (1.1–2.65) |
0, 0.19 |
ROC curve analysis |
MA |
R |
DFS |
|||||
Xue |
2.098 (1.050–4.192) |
0.17 |
ROC curve analysis |
MA |
R |
Arda |
1.736 (0.997–3.024) |
0.25 |
NA |
MA |
R |
Yen |
1.53 (1.05–2.23) |
0.17 |
Log rank analysis |
MA |
R |
Tiago |
74.88 (1.55–3617.01) |
0.15 |
Literature data |
MA |
R |
Zhu |
2.775 (1.544–4.988) |
0.43 |
Mean |
MA |
R |
Liang |
1.39 (1.15–1.69) |
0.125, 0.26, 0.5 |
Quartiles |
MA |
R |
Jung |
3.073 (1.496–6.313 ) |
0, 0.01, 0.28 |
Median value |
MA |
R |
Shimomura |
2.425 (1.497–3.922) |
0.2 |
ROC curve analysis |
MA |
R |
Hong |
5.868 (1.585–21.729) |
0.1638 |
Quartiles |
MA |
R |
Greenberg |
3.297 (0.875–12.427) |
0.13 |
ROC curve analysis |
MA |
R |
Vaccaro |
2.6 (1.5–4.8) |
0.25 |
Quartiles |
MA |
R |
Galizia |
5.56 (3.45–12.5) |
0.1818 |
ROC curve analysis |
MA |
R |
Jing |
11.75(3.20–43.12) |
0.11, 0.20. 429 |
Quartiles |
MA |
R |
Jung |
1.596 (1.122–2.268) |
0.18 |
Quartiles |
MA |
R |
Peng |
3.82 (1.96–7.47) |
0.14, 0.49 |
Literature data |
MA |
R |
Derwinger |
10.6 (3.2–31.8) |
0.12, 0.27, 0.4 |
Quartiles |
MA |
R |
Lee |
2.880 (1.950–4.253) |
0.11, 0.24, |
Quartiles |
MA |
R |
Chin |
3.915 (1.249–12.269) |
0.4, 0.7 |
Log rank analysis |
MA |
R |
Parnaby |
2.877 (1.837–4.507) |
0, 0.17, 0.41, 0.69 |
Literature data |
MA |
R |
Study design is described as prospective (P) or retrospective (R). SEER surveillance, epidemiology, and end results cancer registry; L location cancer registry.
NA, not available; OS, overall survival; DFS, disease -free survival;
ROC curve: receiver operating characteristic curve. LNR: lymph node ratio,
MA, multivariate statistical analysis models; UA, univariate statistical analysis models.
Meta-analysis results
As shown in Figure 2, a pooled HR and its 95%CI were calculated with a random model because of the heterogeneity test showed that statistically significant heterogeneity exists between the studies (for OS: I2 = 60.5%, P = 0.000; for DFS: I2 = 71.7%, P = 0.000). The result showed that elevated LNR may predict poor OS (n = 24) (the pooled HR was 1.91; 95% CI: 1.71–2.14) and DFS (the pooled HR was 2.75; 95% CI: 2.14–3.53). We next conducted subgroup analysis base on some important clinicopathological characteristics. The patients with higher LNR were all associated with decreased OS and DFS (Table 4).
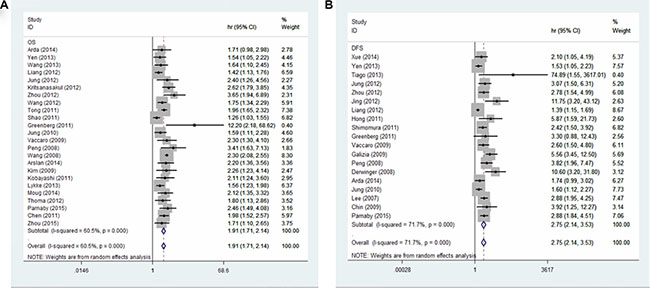
Figure 2: Forest plots show the association between LNR and overall survival (A), disease free survival (B).
Table 4: Results of the meta-analysis
Stratifications |
No. of studies |
Pooled Estimates |
Model |
Heterogeneity |
|||
|---|---|---|---|---|---|---|---|
HR (95% CI) |
P value |
I2(%) |
P value |
||||
OS |
24 |
1.91 (1.71–2.14) |
0.000 |
R |
60.5 |
0.000 |
|
No. of nodes |
No. of nodes≥12 |
13 |
1.97 (1.71–2.26) |
0.000 |
F |
35.2 |
0.101 |
No. of nodes<12 |
8 |
1.74 (1.40–2.17) |
0.000 |
R |
62 |
0.015 |
|
Location |
Colon |
9 |
2.11 (1.95–2.28) |
0.000 |
F |
35.1 |
0.137 |
rectum |
5 |
2.30 (1.79–2.96) |
0.000 |
F |
19.9 |
0.288 |
|
Treatment |
R0 surgery +AT |
15 |
1.96 (1.73–2.22) |
0.000 |
F |
8.8 |
0.355 |
R0 surgery |
9 |
1.83 (1.52–2.20) |
0.000 |
R |
81.3 |
0.000 |
|
Stage |
Stage III |
15 |
1.91 (1.71–2.14) |
0.000 |
R |
50.7 |
0.013 |
DFS |
19 |
2.75 (2.14–3.53) |
0.000 |
R |
71.7 |
0.000 |
|
No. of nodes |
No. of nodes≥12 |
13 |
2.87 (2.18–3.77) |
0.000 |
F |
48.8 |
0.062 |
No. of nodes < 12 |
4 |
2.69 (1.32–5.50) |
0.000 |
R |
81.5 |
0.001 |
|
Location |
Colon |
9 |
3.49 (2.47–4.93) |
0.000 |
R |
48.9 |
0.048 |
Treatment |
R0 surgery + AT |
14 |
3.06 (2.32–4.04) |
0.000 |
R |
63.2 |
0.001 |
R0 surgery |
5 |
1.91 (1.27–2.86) |
0.002 |
R |
59 |
0.045 |
|
Stage |
Stage III |
16 |
2.73 (2.06–3.61) |
0.000 |
R |
74.6 |
0.000 |
“OS”: overall survival; “DFS”: disease free survival; “AT”: adjuvant treatment; “R”: random effects model; “F”: fixed effect model; “No. of nodes”: total number of lymph nodes harvested.
Sensitivity analysis
Obvious heterogeneity was found in some analysis groups (Table 4). The most possible sources of heterogeneity were analyzed by subgroup. But subgroup analysis could not completely explain the heterogeneity. Therefore, we performed sensitivity analysis (Figure 3). In the OS analysis for all, heterogeneity was significant (I2 = 60.5%, P = 0.000). When Shaos’ study and Wangs’ study were removed from analysis, the heterogeneity became insignificant (P = 0.109 and I2 = 28.1%). As to DFS analysis for all (I2 = 71.7%, P = 0.000), we found that Liangs’, Yen’s and Jungs’ study were responsible for the heterogeneity of DFS analysis group (P = 0.091 and I2 = 33.9%). After we excluded the publications with statistically significant heterogeneity and repeated the analysis, the summary estimates for higher LNR did not change statistically significantly (OS for all: the pooled HR was 1.85; 95% CI: 1.72–2.00; DFS for all: the pooled HR was 3.01; 95% CI: 2.55–3.55).
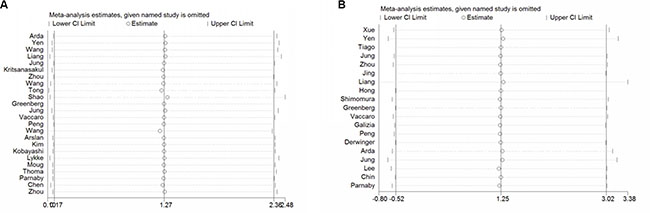
Figure 3: Sensitivity analysis of the association between LNR and overall survival (A), disease free survival (B).
Publication bias
Funnel plots and Egger’s test were conducted to evaluate the publication bias of included studies. No obvious visual asymmetry was observed in funnel plots (Figure 4) for OS, and the P values of the Egger’s test were 0.800. However, statistically significant publication bias was found in the studies of DFS (Egger’s test P value = 0.000). The funnel plot for the studies of DFS showed an asymmetrical distribution of the studies (Figure 4). Therefore we used the trim-and-fill method (Figure 5). As a consequence, there were 6 potential missing studies, and after these 6 potentially unpublished studies were filled, the recalculated pooled HR was 2.24 (95% CI: 1.75–2.88, p < 0.00001) in the random effects model. That indicated a positive outcome even though publication bias still exists.
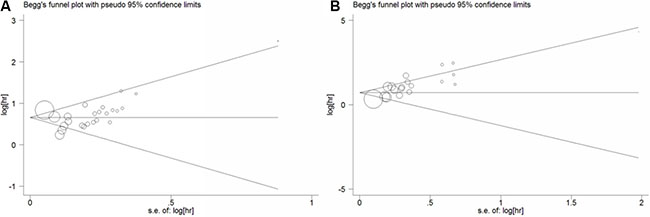
Figure 4: Funnel plot of the association between LNR and overall survival (A), disease free survival (B).
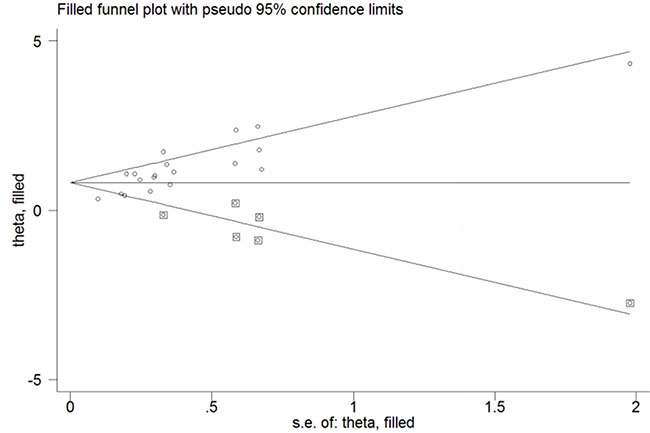
Figure 5: Trim and fill funnel plot for the source of publication bias.
DISCUSSION
The prognosis of patients with colorectal cancer was largely related to the lymph node status, which helps in tumor staging and clinical decision. According to the current TNM staging system proposed by the AJCC/ UICC [2], N categories were determined by the absolute number of involved lymph nodes (N1, one to three; N2, four or more). Although this categorization has been proven to predict long term outcomes and well accepted [40], it is noteworthy that the TNM system does not take into account some important features of lymph node metastasis. In fact, many features of lymph node such as the number of non metastasis lymph nodes and the extra-nodal extension of nodal metastasis retrieved from the resection specimen which has been shown to have a prognostic significance in CRC [41, 42]. Furthermore, LNR can be considered as a hallmark of aggressiveness, since it was associated with a higher percentage of lymphovascular invasion and poor tumor differentiation [15, 23, 39].
In last decades, many researchers suggested that LNR could be a prognostic factor in different types of malignancies especially most of the gastrointestinal cancers [43–46]. This meta-analysis confirmed that higher LNR is statistically significantly associated with a poor survival of colorectal cancer. The results were similar when we subgroup the patients according to some important clinicopathological characteristics. Furthermore, we carried out a sensitivity analysis, which suggested the stability of our meta-analysis. We encountered evidence of publication bias in our main analysis, but our results remained unchanged after we adjusted for this. In current meta-analysis, we excepted the studies which included patients underwent neo-adjuvant treatment because it has reported that the total number of retrieved lymph nodes and positive lymph nodes may decrease after preoperative chemoradiation [47, 48].
Our results have demonstrated the significant weight of LNR in the prognosis of CRC. It is recommended to include LNR as a prognostic parameter in future colorectal staging system. It is important to note that the extent of dissection would influence the LNR. Generally, a more extensive surgical dissection of the specimen results in a higher number of positive nodes. And a ratio based on a small number of lymph nodes ha s a larger standard error, which could affect the reliability of the LNR in those patients who had less extensive dissection [49, 50]. So, adequate lymph nodes retrieved from the operative specimen was still important.
Our study had some advantages. First, this is the first complete meta-analysis identify the prognostic role of LNR in CRC. Second, this meta-analysis included plenty of primary studies (33 papers) and patients (75,838 node positive patients). The statistical power is well enough for our results. However, this study also had several limitations which are largely reflected by those within the primary studies. First, data about other co-morbidities (like cardiovascular diseases) were not reported, but it is known that they play an important prognostic role also in patients with cancer. Second, The cut-off value for defining LNR in each included study is quite different, which may have contributed to heterogeneity. Regarding which cutoff value will be the most reliable for predicting the prognostic values of colorectal cancer patients, the available evidence could not achieve an agreement. This needs a large cohort study or an individual patient data meta-analysis which could stratify and evaluate different LNRs on the CRC prognosis and find out the minute differences in prognostic outcomes. Finally, we also encountered some heterogeneity but were able to investigate sources of this within subgroup analysis and sensitive analysis.
In conclusion, this meta-analysis indicated that higher LNR can be used as a predictor of poor survival and assists in the choice of adjuvant treatment in the clinical setting in patients with CRC. We proposed that the LNR could be a prognostic parameter in future colorectal staging system.
MATERIALS AND METHODS
Search strategy and selection criteria
We systematically searched PubMed, Embase and the Cochrane library (http://www.cochrane.org) using the “lymph node ratio”, “LNR”;”lymph positive node ratio”, “lymph metastatic node ratio” Medical Subject Heading (MeSH) terms “Colorectal Neoplasms” and the individual corresponding free terms such as “colorectal cancer”, ”colon cancer”, “rectal cancer” “colorectal adenocarcinoma”, “colon adenocarcinoma”, “rectal adenocarcinoma”, “colorectal carcinoma”, “colon carcinoma”, “rectal carcinoma”, “colorectal tumor”, “colon tumor”, “rectal tumor”. No language or other restrictions were applied. The last search was updated on 28 November, 2015. In addition, we reviewed references in the retrieved articles to search for additional relevant studies.
Studies eligible in the meta-analysis fulfilled the following inclusion criteria: (1) the patients were pathologically diagnosed as CRC with node-positive who underwent curative surgery (R0 resection);(2) the outcome of interest was overall survival (OS) and disease free survival (DFS);(3) hazard ratio (HR) and 95% confidence intervals (CI) were sufficiently reported. Exclusion criteria were defined as follows: (1) the patients have distant metastasis (TNM stage IV) or received neoadjuvant chemotherapy; (2) Letters, reviews, expert opinions, and case reports.
Data extraction
The following information were extracted from each selected papers if available: first author, year of publication, country of the study population, number of patients, number of nodes examined, type of study, cut-off value for the LNR and definition of the strata, follow-up years, the location and the TNM stage of the tumor, and HRs with 95% CI. Two investigators reviewed and extracted information independently and checked by the other authors. Discrepancies were settled by consensus.
Statistical analysis
The statistical analyses were carried out using STATA 12.0 (STATA Corporation, College Station, TX, USA). The HRs with 95% CI from each study were extracted to generate a pooled HR. Heterogeneity among studies was checked using the chi-squared test and I2 statistics. If the P value < 0.05 and/or I2 > 50% indicating statistical significance, a random effects model was used to obtain summary HRs. Otherwise, a fixed effect model was utilized. In addition, we conducted a sensitivity analysis to investigate the potential sources of heterogeneity and assess the strength of our findings by sequentially excluding one study. Furthermore, factors contributed to heterogeneities were also analyzed by stratifying the subjects according to the tumor location. Publication bias among the studies was investigated by using Begg’s funnel plot and the Egger’s test.
ACKNOWLEDGMENTS
We thank Hao Cheng and Dun Wang for assisting with data collection and management.
CONFLICTS OF INTEREST
The authors declare no competing financial interests.
FUNDING
This study was supported by grants from the National Natural Science Fund of China (NSFC key project 81472304).
REFERENCES
1. Siegel R, Desantis C, Jemal A. Colorectal cancer statistics, 2014. CA Cancer J Clin. 2014; 64:104–117.
2. Edge SB, Byrd DR, Carducci MA, Compton CC, eds. AJCC Cancer Staging Manual. 7th ed. New York, NY: Springer. 2009.
3. Ceelen W, Van Nieuwenhove Y, Pattyn P. Prognostic value of the lymph node ratio in stage III colorectal cancer: a systematic review. Ann Surg Oncol. 2010; 17:2847–2855.
4. Noura S. Impact of metastatic lymph node ratio in node-positive colorectal cancer. World Journal of Gastrointestinal Surgery. 2010; 2:70.
5. Wang J, Hassett JM, Dayton MT, Kulaylat MN. Lymph node ratio: role in the staging of node-positive colon cancer. Ann Surg Oncol. 2008; 15:1600–1608.
6. Gao P, Song YX, Wang ZN, Xu YY, Tong LL, Zhu JL, Tang QC, Xu HM. Integrated ratio of metastatic to examined lymph nodes and number of metastatic lymph nodes into the AJCC staging system for colon cancer. PLoS One. 2012; 7:e35021.
7. Isik A, Peker K, Firat D, Yilmaz B, Sayar I, Idiz O, Cakir C, Demiryilmaz I, Yilmaz I. Importance of metastatic lymph node ratio in non-metastatic, lymph node-invaded colon cancer: a clinical trial. Med Sci Monit. 2014; 20:1369–1375.
8. Arslan NC, Sokmen S, Canda AE, Terzi C, Sarioglu S. The prognostic impact of the log odds of positive lymph nodes in colon cancer. Colorectal Dis. 2014; 16:O386–392.
9. Chen SL, Steele SR, Eberhardt J, Zhu K, Bilchik A, Stojadinovic A. Lymph node ratio as a quality and prognostic indicator in stage III colon cancer. Ann Surg. 2011; 253:82–87.
10. Chin CC, Wang JY, Yeh CY, Kuo YH, Huang WS, Yeh CH. Metastatic lymph node ratio is a more precise predictor of prognosis than number of lymph node metastases in stage III colon cancer. Int J Colorectal Dis. 2009; 24:1297–1302.
11. Dedavide Silva TL, Damin DC. Lymph node ratio predicts tumor recurrence in stage III colon cancer. Rev Col Bras Cir. 2013; 40:463–470.
12. Derwinger K, Carlsson G, Gustavsson B. A study of lymph node ratio as a prognostic marker in colon cancer. Eur J Surg Oncol. 2008; 34:771–775.
13. Galizia G, Orditura M, Ferraraccio F, Castellano P, Pinto M, Zamboli A, Cecere S, De Vita F, Pignatelli C, Lieto E. The lymph node ratio is a powerful prognostic factor of node-positive colon cancers undergoing potentially curative surgery. World J Surg. 2009; 33:2704–2713.
14. Greenberg R, Itah R, Ghinea R, Sacham-Shmueli E, Inbar R, Avital S. Metastatic lymph node ratio (LNR) as a prognostic variable in colorectal cancer patients undergoing laparoscopic resection. Tech Coloproctol. 2011; 15:273–279.
15. Hong KD, Lee SI, Moon HY. Lymph node ratio as determined by the 7th edition of the American Joint Committee on Cancer staging system predicts survival in stage III colon cancer. J Surg Oncol. 2011; 103:406–410.
16. Huh JW, Kim CH, Kim HR, Kim YJ. Factors predicting oncologic outcomes in patients with fewer than 12 lymph nodes retrieved after curative resection for colon cancer. J Surg Oncol. 2012; 105:125–129.
17. Huh JW, Kim YJ, Kim HR. Ratio of metastatic to resected lymph nodes as a prognostic factor in node-positive colorectal cancer. Ann Surg Oncol. 2010; 17:2640–2646.
18. Kim YS, Kim JH, Yoon SM, Choi EK, Ahn SD, Lee SW, Kim JC, Yu CS, Kim HC, Kim TW, Chang HM. Lymph node ratio as a prognostic factor in patients with stage III rectal cancer treated with total mesorectal excision followed by chemoradiotherapy. Int J Radiat Oncol Biol Phys. 2009; 74:796–802.
19. Kobayashi H, Mochizuki H, Kato T, Mori T, Kameoka S, Shirouzu K, Saito Y, Watanabe M, Morita T, Hida J, Ueno M, Ono M, Yasuno M, et al. Lymph node ratio is a powerful prognostic index in patients with stage III distal rectal cancer: a Japanese multicenter study. Int J Colorectal Dis. 2011; 26:891–896.
20. Kritsanasakul A, Boonpipattanapong T, Wanitsuwan W, Phukaoloun M, Prechawittayakul P, Sangkhathat S. Impact of lymph node retrieval on surgical outcomes in colorectal cancers. J Surg Oncol. 2012; 106:238–242.
21. Lee HY, Choi HJ, Park KJ, Shin JS, Kwon HC, Roh MS, Kim C. Prognostic significance of metastatic lymph node ratio in node-positive colon carcinoma. Ann Surg Oncol. 2007; 14:1712–1717.
22. Liang J, Wei Y, Zhao C, Hong C. Metastatic lymph node ratio and outcome of surgical patients with stage III colorectal cancer. [Article in Chinese]. Nan Fang Yi Ke Da Xue Xue Bao. 2012; 32:1663–1666.
23. Lu YJ, Lin PC, Lin CC, Wang HS, Yang SH, Jiang JK, Lan YT, Lin TC, Liang WY, Chen WS, Lin JK, Chang SC. The impact of the lymph node ratio is greater than traditional lymph node status in stage III colorectal cancer patients. World J Surg. 2013; 37:1927–1933.
24. Lykke J, Roikjaer O, Jess P. The relation between lymph node status and survival in Stage I-III colon cancer: results from a prospective nationwide cohort study. Colorectal Dis. 2013; 15:559–565.
25. Moug SJ, Oliphant R, Balsitis M, Molloy RG, Morrison DS. The lymph node ratio optimises staging in patients with node positive colon cancer with implications for adjuvant chemotherapy. Int J Colorectal Dis. 2014; 29:599–604.
26. Parnaby CN, Scott NW, Ramsay G, MacKay C, Samuel L, Murray GI, Loudon MA. Prognostic value of lymph node ratio and extramural vascular invasion on survival for patients undergoing curative colon cancer resection. Br J Cancer. 2015; 113:212–219.
27. Peng J, Xu Y, Guan Z, Zhu J, Wang M, Cai G, Sheng W, Cai S. Prognostic significance of the metastatic lymph node ratio in node-positive rectal cancer. Ann Surg Oncol. 2008; 15:3118–3123.
28. Ren JQ, Liu JW, Chen ZT, Liu SJ, Huang SJ, Huang Y, Hong JS. Prognostic value of the lymph node ratio in stage III colorectal cancer. Chin J Cancer. 2012; 31:241–247.
29. Shao XL, Han HQ, He XL, Fu Q, Lv YC, Liu G. [Impact of number of retrieved lymph nodes and lymph node ratio on the prognosis in patients with stage II and III colorectal cancer]. [Article in Chinese]. Zhonghua Wei Chang Wai Ke Za Zhi. 2011; 14:249–253.
30. Shimomura M, Ikeda S, Takakura Y, Kawaguchi Y, Tokunaga M, Egi H, Hinoi T, Okajima M, Ohdan H. Adequate lymph node examination is essential to ensure the prognostic value of the lymph node ratio in patients with stage III colorectal cancer. Surg Today. 2011; 41:1370–1379.
31. Thomas M, Biswas S, Mohamed F, Chandrakumaran K, Jha M, Wilson R. Dukes C colorectal cancer: is the metastatic lymph node ratio important? Int J Colorectal Dis. 2012; 27:309–317.
32. Tong LL, Gao P, Wang ZN, Song YX, Xu YY, Sun Z, Xing CZ, Wang X, Xu HM. Can lymph node ratio take the place of pN categories in the UICC/AJCC TNM classification system for colorectal cancer? Ann Surg Oncol. 2011; 18:2453–2460.
33. Vaccaro CA, Im V, Rossi GL, Quintana GO, Benati ML, Perez de Arenaza D, Bonadeo FA. Lymph node ratio as prognosis factor for colon cancer treated by colorectal surgeons. Dis Colon Rectum. 2009; 52:1244–1250.
34. Wang LP, Wang HY, Cao R, Zhu C, Wu XZ. Proposal of a new classification for stage III colorectal cancer based on the number and ratio of metastatic lymph nodes. World J Surg. 2013; 37:1094–1102.
35. Xue H, Du X, Xiao C, Yan Y, Zou Z, Xu Y. Predictive value of lymph node ratio for postoperative distant metastasis of stage III colorectal cancer. [Article in Chinese]. Nan Fang Yi Ke Da Xue Xue Bao. 2014; 34:458–462.
36. Zhou D, Ye M, Bai Y, Rong L, Hou Y. Prognostic value of lymph node ratio in survival of patients with locally advanced rectal cancer. Can J Surg. 2015; 58:237–244.
37. Zhu XW, Wu CS, Yuan SC. Prognostic value of lymph node ratio in survival of patients with stage III rectal cancer. [Article in Chinese]. Zhonghua Zhong Liu Za Zhi. 2012; 34:506–509.
38. Wang JN, Wang L, Ma JG, Liu WW, Dai DQ. Regional lymph node staging and establishment of prognostic model for stage III colon cancer. [Article in Chinese]. Zhonghua Wei Chang Wai Ke Za Zhi. 2012; 15:1057–1061.
39. Dedavid e Silva TL, Damin DC. Lymph node ratio predicts tumor recurrence in stage III colon cancer. 2013.
40. Vaccaro CA, Bonadeo FA, Benati ML, Quintana GM, Rubinstein F, Mullen E, Telenta M, Lastiri JM. Colorectal cancer staging: reappraisal of N/PN classification. Dis Colon Rectum. 2004; 47:66–69.
41. Veronese N, Nottegar A, Pea A, Solmi M, Stubbs B, Capelli P, Sergi G, Manzato E, Fassan M, Wood LD, Scarpa A, Luchini C. Prognostic impact and implications of extracapsular lymph node involvement in colorectal cancer: a systematic review with meta-analysis. Ann Oncol. 2016; 27:42–48.
42. Luchini C, Nottegar A, Pea A, Solmi M, Stubbs B, Capelli P, Sergi G, Manzato E, Fassan M, Wood LD, Scarpa A, Veronese N. Extranodal extension is an important prognostic parameter for both colonic and rectal cancer. Ann Oncol. 2016; 27:955–956.
43. Sun G, Xue L, Wang M, Zhao X. Lymph node ratio is a prognostic factor for non-small cell lung cancer. Oncotarget. 2015; 6:33912–33918. doi: 10.18632/oncotarget.5669.
44. Zhou J, Chen QH, Wu SG, He ZY, Sun JY, Li FY, Lin HX, You KL. Lymph node ratio may predict the benefit of postoperative radiotherapy in node-positive cervical cancer. Oncotarget. 2016; 7:29420–8. doi: 10.18632/oncotarget.8840.
45. Isik A, Okan I, Firat D, Yilmaz B, Akcakaya A, Sahin M. A new prognostic strategy for gastric carcinoma: albumin level and metastatic lymph node ratio. Minerva Chir. 2014; 69:147–153.
46. Kutlu OC, Watchell M, Dissanaike S. Metastatic lymph node ratio successfully predicts prognosis in western gastric cancer patients. Surg Oncol. 2015; 24:84–88.
47. Wong KP, Poon JT, Fan JK, Law WL. Prognostic value of lymph node ratio in stage III colorectal cancer. Colorectal Dis. 2011; 13:1116–1122.
48. Moug SJ, Saldanha JD, McGregor JR, Balsitis M, Diament RH. Positive lymph node retrieval ratio optimises patient staging in colorectal cancer. Br J Cancer. 2009; 100:1530–1533.
49. Namm J, Ng M, Roy-Chowdhury S, Morgan JW, Lum SS, Wong JH. Quantitating the impact of stage migration on staging accuracy in colorectal cancer. J Am Coll Surg. 2008; 207:882–887.
50. George S, Primrose J, Talbot R, Smith J, Mullee M, Bailey D, du Boulay C, Jordan H. Will Rogers revisited: prospective observational study of survival of 3592 patients with colorectal cancer according to number of nodes examined by pathologists. Br J Cancer. 2006; 95:841–847.