
INTRODUCTION
Gliomas are the most common and deadly brain tumors of the central nervous system (CNS), which clinically characterized by a high incident rate, a high recurrence rate, and high mortality, accounting for up to 50% of all intracranial tumors [1][2, 3]. Gliomas are classified by World Health Organization (WHO) into four grades in accordance with the morphological resemblance of the neoplastic cells to normal glial tissues [4]. Based on histological criteria, diffuse gliomas are categorized into astrocytoma, oligodendroglioma and oligoastrocytoma, and graded from grade II to IV [5]. Gliomas with diverse genetic variations might originate from distinct cell types and are an important cause of tumor heterogeneity [6, 7]. However, the past two decades have seen the remarkable progress in basic brain tumor biology, especially as far as malignant glioma and medulloblastoma were concerned, the most common CNS cancers of adults and children. For instance, patients with astrocytic glioma, also known as glioblastoma, the most widespread and aggressive glioma variant, have a median survival of only 15 months [8, 9]. Brain tumors are the most common solid tumors affecting children, and the main cause of cancer-related death in children [10]. Despite efforts to improve treatment, children with high-grade glioma still have a dismal outcome with a 5-year survival of less than 20% [11].
Among glioblastoma, patients with grade IV tumors have relatively better, but variable, survivals than patients with grade II and III tumors. Due to their variable prognosis and difficulties in designing and evaluating clinical trials in WHO grade II and III diffuse gliomas, treatment strategies of these gliomas are still controversial [12–14]. The TERT gene contains 16 exons and 15 introns spanning about 35 kb, mapped on chromosome 5p15.33 [15]. The maintenance of telomeres requires a number of telomere associated factors. One such complex is the telomerase enzyme, which contains TERT and TERC, a protein and an RNA component, respectively. TERT uses the RNA subunit of telomerase as a template for the synthesis of single stranded DNA in the telomeric region of the chromosome, loading to prevent the chromosome from shorting in nucleotide repeats region. However, because telomerase activity is absent in the process of the most cell differentiation, resulting in telomeres shorten over time. Telomerase are reduced to a certain length, present in most cancer cells, which may block cancer cells from senescence or apoptosis [16, 17].
Because of the poor prognosis of glioma, there is an urgent need for an easily detectable biomarker to facilitate early detection. In this study, we undertook a retrospective analysis of data from a prospective longitudinal study of 481 patients over an extended time period (2010–2014) to examine the epidemiology of glioma with regard to age, gender, surgery, radiotherapy, chemotherapy (platinum, nimustine, and temozolomide), WHO grade, overall survival (OS), and progress-free survival (PFS). We analyzed the correlation between TERT rs2853676 genetic polymorphisms and glioma prognosis, to identify possible points of intervention that may lead to improved patient survival.
RESULTS
From September 2010 to May 2014, a total of 481 glioma cancer patients at the Tangdu Hospital of The Fourth Military Medical University in China were included in this study. Table 1 summarizes the population and clinical characteristics. The average age of all patients (264 men and 217 women) was 40.79 years (ranging from 1 to 81 years); 43.2% of patients were less than 40 years old. 315 (62.5%) patients were treated with gamma knife (GK) radiotherapy, 122 (25.4%) patients were treated with conformal radiotherapy (CRT), and the rest 44 patients did not receive any radiotherapy. 198 (41.2%) patients were treated with chemotherapy, while 283 (58.8%) patients were not treated. There were 294 cases with grade I–II tumors and 187 cases with grade III–IV tumors.
Table 1: Patients and clinical characteristics
Variable |
|
No. |
Percent (%) |
|---|---|---|---|
Gender |
male |
264 |
54.9 |
|
female |
217 |
35.1 |
Age |
Mean (range), years |
40.79(1-81) |
|
|
<40 |
208 |
43.2 |
|
≥40 |
273 |
56.8 |
Surgery |
GTR |
328 |
68.2 |
|
NTR+STR |
153 |
31.8 |
Radiotherapy |
GK |
315 |
62.5 |
|
CRT |
122 |
25.4 |
|
No |
44 |
9.1 |
Chemotherapy |
Yes |
198 |
41.2 |
|
No |
283 |
58.8 |
WHO Grade |
Grade I-II |
294 |
61.1 |
|
Grade III-IV |
187 |
38.9 |
Overall Survival |
Median follow-up |
11 months |
|
|
Survival |
26 |
5.4 |
|
Loss to follow-up |
17 |
3.5 |
|
Death |
438 |
91.1 |
OS rate, % |
1 year |
31 |
|
|
2 years |
10.3 |
|
|
3 years |
7.5 |
|
Progression-free survival |
Median follow-up |
8 months |
|
|
Progression-free |
24 |
5 |
|
Progression |
453 |
94.2 |
|
Total |
477 |
99.2 |
|
Missing System |
4 |
0.8 |
PFS rate, % |
1 year |
15.7 |
|
|
2 years |
7.3 |
|
|
3 years |
4.7 |
|
|
Total Number |
481 |
|
Abbreviations: GTR: gross-total resection; NTR: near-total resection; STR: sub-total resection;
GK: Gamma Knife; CRT: Conformal Radiotherapy; OS: Overall Survival; PFS: Progression-free Survival.
Patients were followed up since the diagnosis until the end of May, 2014. Among the 481 patients, 17 patients were lost from the follow-up data and 438 (91.1%) death cases occurred until the end of the follow-up. The median follow-up time of OS was 11 months, and the OS rates of one year, two years and three years were 31%, 10.3% and 7.5%, respectively. The median follow-up time of PFS was 8 months, and the PFS rates of one year, two years and three years were 15.7%, 7.3%, 4.7%, respectively. OS and PFS curves were drawn using the Kaplan-Meier method in Figure 1A and Figure 1B, respectively.
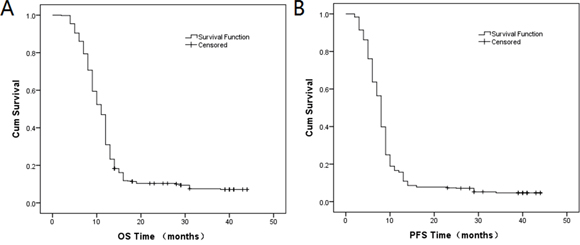
Figure 1: Kaplan-Meier curves of A. OS and B. PFS.
As shown in Table 2, we found that there only existed statistical difference in the distribution of age with a P-value = 0.001, but for distribution of gender, age, surgery, radiotherapy and chemotherapy between grade I–II and grade III–IV tumors. We also found there was statistical difference in OS (Log-rank P = 0.039, Figure 2A) between grade I–II and grade III–IV tumors, but there was no statistical difference in PFS (Log-rank P = 0.12, Figure 2B).
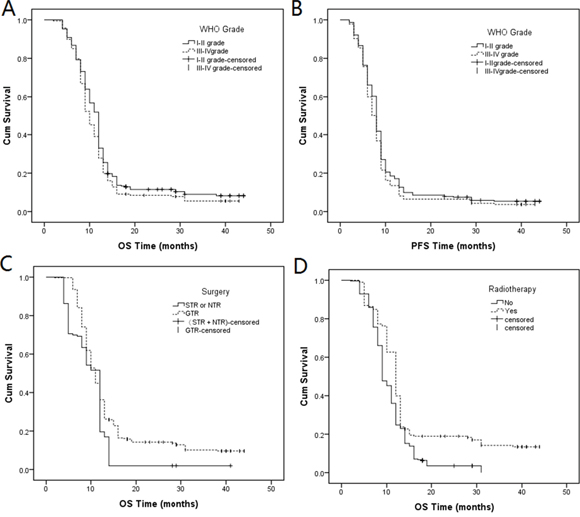
Figure 2: Kaplan-Meier curves of A. OS (log-rank P = 0.039) and B. PFS (log-rank P = 0.12) between grade I–II and grade III–IV tumors; Kaplan-Meier curves of the distribution of C. surgery (log-rank P = 0.000) and D. radiotherapy (log-rank P = 0.000) in OS.
Table 2: The distribution of variable between grade I–II and grade III–IV tumors
Variable |
N/% |
N/% |
P-valuea |
|---|---|---|---|
|
Grade I-II |
Grade III-IV |
|
Gender |
|
|
0.412 |
Male |
157/53.4 |
107/57.2 |
|
Female |
137/46.6 |
80/42.8 |
|
Age |
|
|
0.001* |
Mean(range)/year |
38.63(1-81) |
44.81 (2-79) |
|
<40 |
144/49 |
64/34.2 |
|
≥40 |
150/51 |
123/65.8 |
|
Surgery |
|
|
0.706 |
GTR |
197/67 |
131/70.1 |
|
NTR+STR |
97/33 |
56/29.9 |
|
Radiotherapy |
|
|
0.562 |
GK |
197/67 |
118/63.1 |
|
CRT |
73/24.8 |
4926.2 |
|
No |
24/8.2 |
2010.7 |
|
Chemotherapy |
|
|
0.637 |
Yes |
124/42.2 |
74/39.6 |
|
No |
170/57.8 |
113/60.4 |
|
Total |
294 |
187 |
|
|
|
|
P-value b |
OS |
|
|
0.039* |
Median, months |
12 |
10 |
|
Survival |
17/5.8 |
9/4.8 |
|
Loss to follow-up |
14/4.8 |
3/1.6 |
|
Death |
263/89.5 |
175/93.6 |
|
OS rate, % 1 year |
33 |
39 |
|
2 years |
11.5 |
8.5 |
|
3 years |
9 |
5.5 |
|
PFS |
|
|
0.12 |
Median, months |
8 |
8 |
|
Progression-free |
17/5.8 |
7/3.7 |
|
Progression |
275/93.5 |
178/95.2 |
|
Total |
292/99.3 |
185/98.9 |
|
Missing System |
2/0.7 |
2/1.1 |
|
PFS rate, % 1 year |
17.1 |
13.5 |
|
2 years |
7.9 |
6.5 |
|
3 years |
5.4 |
3.7 |
|
Notes: aP-values based on Pearson χ2 test; b P-values based on log-rank test; *p-value < 0.05 indicates statistical significance.
Abbreviations: GTR: gross-total resection; NTR: near-total resection; STR: sub-total resection; GK: Gamma Knife; CRT: Conformal Radiotherapy; OS: Overall Survival; PFS: Progression-free Survival.
In Table 3 indicated that the distribution of surgery and radiotherapy was the following: total OS (Figure 2C, Log-rank P = 0.000; Figure 2D, Log-rank P = 0.000), grade I–II OS (Figure 3A, Log-rank P = 0.001; Figure 3B, Log-rank P = 0.000) and grade III–IV OS (Figure 3C, Log-rank P = 0.002; Figure 3D, Log-rank P = 0.001). Compared with sub-total resection (STR) and near-total resection (NTR) surgery, gross-total resection (GTR) decreased the prognostic risk by 0.667-fold (95% CI: 0.545-0.817, P = 0.000), 0.677-fold (95% CI: 0.522-0.878, P = 0.003), and 0.617-fold (95% CI: 0.451-0.864, P = 0.004) in total OS, grade I–II OS and grade III–IV OS, respectively. Compared with no radiotherapy, radiotherapy treatment decreased the prognostic risk by 0.643-fold (95% CI: 0.528-0.782, P = 0.000), 0.665-fold (95% CI: 0.517-0.855, P = 0.001), and 0.617-fold (95% CI: 0.450-0.864, P = 0.003) in total OS, grade I–II OS and grade III–IV OS, respectively. Genotype “A/G” decreased the prognostic risk by 0.824-fold (P = 0.059) in total PFS; other genotypes were not statistically significant, when compared with genotype “G/G”.
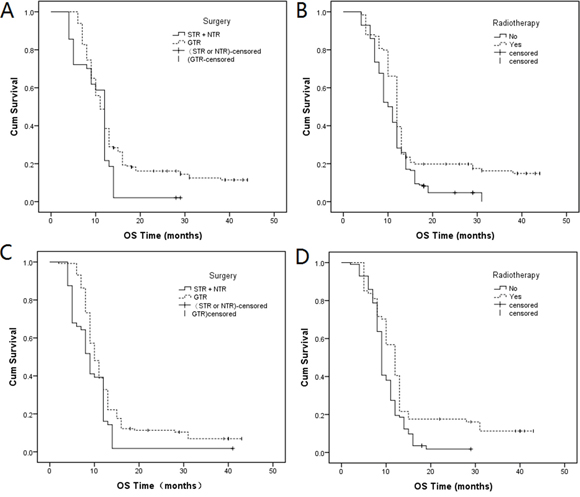
Figure 3: Kaplan-Meier curves of the distribution of A. surgery (log-rank P = 0.001) and B. radiotherapy (log-rank P = 0.000) in grade I–II OS; Kaplan-Meier curves of the distribution of C. surgery (log-rank P = 0.002) and D. radiotherapy (log-rank P =0.001) in grade III–IV OS.
Table 3: Univariate analysis of patient treatment outcome
|
|
|
|
N/Events |
Median |
P-valuea |
1 year |
2 years |
3 years |
HR (95% CI) |
P-valueb |
|---|---|---|---|---|---|---|---|---|---|---|---|
Total |
OS |
Surgery |
STR + NTR |
153/150 |
12 |
0.000* |
19.6 |
2 |
2 |
1 |
|
|
|
|
GTR |
328/288 |
11 |
|
36.3 |
14.2 |
10.2 |
0.667(0.545-0.817) |
0.000* |
|
|
Radiotherapy |
No |
283/270 |
9 |
0.000* |
24.7 |
3.5 |
3.5 |
1 |
|
|
|
|
Yes |
198/168 |
12 |
|
39.9 |
18.9 |
14.2 |
0.643(0.528-0.782) |
0.000* |
|
|
Genotype |
G/G |
301/276 |
11 |
0.207 |
28.2 |
9 |
6.8 |
1 |
|
|
|
|
A/G |
150/146 |
12 |
|
37.2 |
11.8 |
9.8 |
0.847(0691-1.038) |
0.11 |
|
|
|
A/A |
24/22 |
10 |
|
25 |
16.7 |
0 |
0.998(0.647-1.542) |
0.994 |
|
|
|
G/G |
301/276 |
11 |
0.108 |
28.2 |
9 |
6.8 |
1 |
|
|
|
|
A/A + A/G |
180/162 |
11 |
|
35.6 |
12.5 |
8.8 |
0.865(0.712-1.050) |
0.143 |
Total |
PFS |
Genotype |
G/G |
299/286 |
8 |
0.107 |
13 |
5.7 |
4.1 |
1 |
|
|
|
|
A/G |
154/143 |
8 |
|
20.8 |
10.4 |
6.5 |
0.824(0.674-1.088) |
0.059 |
|
|
|
A/A |
24/24 |
8 |
|
16.7 |
8.3 |
0 |
0.944(0.622-1.431) |
0.785 |
|
|
|
G/G |
299/286 |
8 |
0.044* |
13 |
5.7 |
4.1 |
1 |
|
|
|
|
A/A + A/G |
178/167 |
8 |
|
20.2 |
10.1 |
5.6 |
0.839(0.693-1.016) |
0.073 |
I-II grade |
OS |
Surgery |
STR + NTR |
97/95 |
12 |
0.001* |
21.6 |
14 |
14 |
1 |
|
|
|
|
GTR |
197/168 |
11 |
|
39.6 |
16.1 |
12.5 |
0.677(0.522-0.878) |
0.003* |
|
|
Radiotherapy |
No |
170/160 |
10 |
0.000* |
28.2 |
4.7 |
0 |
1 |
|
|
|
|
Yes |
124/103 |
12 |
|
39.5 |
19.8 |
16.3 |
0.665(0.517-0.855) |
0.001* |
III-IV grade |
OS |
Surgery |
STR + NTR |
56/55 |
9 |
0.002* |
16.1 |
1.8 |
1.8 |
1 |
|
|
|
|
GTR |
131/120 |
10 |
|
32.8 |
11.3 |
6.9 |
0.624(0.451-0.864) |
0.004* |
|
|
Radiotherapy |
No |
113/110 |
9 |
0.001* |
19.5 |
1.8 |
0 |
1 |
|
|
|
|
Yes |
74/65 |
12 |
|
40.5 |
17.6 |
11.3 |
0.617(0.450-0.864) |
0.003* |
Notes: a P-values based on the log-rank test; b P-values based on the Wald test; *p-value < 0.05 indicates statistical significance.
Abbreviations: GTR: gross-total resection; NTR: near-total resection; STR: sub-total resection; OS: Overall Survival; PFS: Progression-free Survival.
We found that both the genotype “A/G” (95% CI, 0.656-0.982; P = 0.032) and “A/A + A/G” (95% CI, 0.675-0.99; P = 0.040) decreased HR 0.8-fold compared to genotype G/G in total PFS by using a multivariate analysis. Other genotypes had no effect on the glioma prognosis. These results are shown in Table 4.
Table 4: The association between TERT rs2853676 polymorphism and prognosis outcome by multivariate analysis
|
|
Genotype |
HR |
95% CI |
P-value |
|---|---|---|---|---|---|
Grade I-II |
OS |
G/G |
1 |
|
|
|
|
A/G |
0.873 |
0.673 - 1.134 |
0.309 |
|
|
A/A |
0.913 |
0.493 - 1.689 |
0.772 |
|
PFS |
G/G |
1 |
|
|
|
|
A/G |
0.848 |
0.656 - 1.096 |
0.207 |
|
|
A/A |
0.916 |
0.519 - 1.617 |
0.762 |
|
OS |
G/G |
1 |
|
|
|
|
A/A + A/G |
0.878 |
0.682 - 1.128 |
0.309 |
|
PFS |
G/G |
1 |
|
|
|
|
A/A + A/G |
0.856 |
0.67 - 1.094 |
0.215 |
Grade III-IV |
OS |
G/G |
1 |
|
|
|
|
A/G |
0.735 |
0.528 - 1.024 |
0.068 |
|
|
A/A |
0.924 |
0.492 - 1.736 |
0.807 |
|
PFS |
G/G |
1 |
|
|
|
|
A/G |
0.716 |
0.515 - 0.995 |
0.047 |
|
|
A/A |
0.852 |
0.456 - 1.595 |
0.617 |
|
OS |
G/G |
1 |
|
|
|
|
A/A + A/G |
0.76 |
0.555 - 1.04 |
0.087 |
|
PFS |
G/G |
1 |
|
|
|
|
A/A + A/G |
0.735 |
0.538 - 1.004 |
0.053 |
Total |
OS |
G/G |
1 |
|
|
|
|
A/G |
0.817 |
0.666 - 1.002 |
0.052 |
|
|
A/A |
0.944 |
0.611 - 1.458 |
0.794 |
|
PFS |
G/G |
1 |
|
|
|
|
A/G |
0.803 |
0.656 - 0.982 |
0.032* |
|
|
A/A |
0.921 |
0.607 - 1.398 |
0.699 |
|
OS |
G/G |
1 |
|
|
|
|
A/A + A/G |
0.832 |
0.685 - 1.011 |
0.064 |
|
PFS |
G/G |
1 |
|
|
|
|
A/A + A/G |
0.818 |
0.675 - 0.99 |
0.040* |
Notes: P-values based on the Wald test; *p-value < 0.05 indicates statistical significance.
Abbreviations: HR: hazard ratios; CI: confidence intervals; OS: Overall Survival; PFS: Progression-free Survival.
DISCUSSION
Making a complete surgical removal is very difficult, due to the tumor cells invade deep into the brain itself. Epidemiological studies have identified several genetic polymorphism loci associated with increased cancer risk on chromosome 5p15.33 [18, 19], which contains two key genes, CLPTM1L (cleft lip and palate transmembrane 1-like) and TERT (telomerase reverse transcriptase). In previous genome-wide association studies, researchers have shown that genetic polymorphisms in the telomere-related genes TERC, TERT and RTEL1 are related to increased glioma susceptibility [20–22], suggesting that telomere may play an important role in glioma genesis [23].
TERT is the main catalytic subunit of telomerase, and it is essential to maintain of the telomere DNA length [24]. Telomerase is an RNA-dependent DNA polymerase that enrich TTAGGG repetitive sequences, which bind abundant specialized proteins onto the chromosome ends [25]. The telomeres not only prevent coding sequence erosion but also protect chromosomes from rearrangements, fusion and genome instability by conducting chromosomal complete replication and regulating gene expression [26]. It is a vital step for activing the telomerase in the process of cellular immortalization and the malignant transformation of human cells. This activation requires the TERT catalyst [27]. One meta-analysis indicated compelling evidence that rs2853676 increased the risk of CNS [28] and another meta-analysis suggested that rs2853676 polymorphism was associated with glioma susceptibility based on 76108 cases and 134215 controls [29]. Given that 60% of tumors being TERT promoter mutation, TERT is the most frequently mutated gene in gliomas identified thus far [30, 31]. TERT promoter mutation glioma patients are typically older [33–35]. In this study, we investigated the relationship between the TERT intron mutation and prognosis.
Based on the pathological features, gliomas can be classified as WHO grade I-IV. Almost all high-grade (WHO grade III-IV) gliomas recur after tumor resection. The median survivals of high grade glioma patients are 30-39 weeks [32]. In our study, the median survivals were 40 weeks; this is consistent with previous reports. The median survivals are 5-15 years for patients with WHO grade II glioma [33], while patients suffering from WHO grade III glioma have a median survival of 2-3 years [34, 35]. The antitumor treatment was performed by surgery, radiotherapy, and chemotherapy in combinations. Compared with high-grade patient, low-grade glioma patients have preferable survival, but all low-grade gliomas eventually progress to high-grade gliomas and death. The high rates of recurrence and inefficient treatments contribute to the poor prognosis of patients with gliomas. Especially, high grade gliomas are associated with poor survival, therefore, it is a urgent need for early adjuvant therapies and meticulous follow-up. Despite the development of multi-mode treatments that include surgery, radiotherapy, chemotherapy as well as the emergence of new biological therapies [3, 36], treatment efficacy is still unsatisfactory. In addition, drugs for symptom management are often prescribed for a prolonged period of time, such as corticosteroids and anticonvulsants [37, 38].
Gliomas are usually resistant to therapy even after external beam radiation therapy, aggressive surgical resection and the maximum tolerated chemotherapy dose with agents such as temozolomide or nitrosourea. One of the major strategies is enhancement of chemosensitivity, which can overcome the multidrug and undesirable influence of chemotherapy. The mechanism of chemoresistance is very complicated in tumor therapy and so far, it remains poorly understood [39].
In conclusion, our study indicates that TERT rs2853676 polymorphisms correlate with glioma survival and recurrence rates, suggesting that they may serve as diagnostic markers to improve glioma treatment. Further investigations using larger patient numbers and unabridged follow-up data should be carried out to validate this association. Although different symptoms sometimes require different treatment approaches, we recommend a comprehensive treatment approach, which contains pharmacological treatment and/or psychotherapy. To improve treatment efficiency, a better understanding of the molecular mechanisms responsible for glioma recurrence and survival is urgently needed.
MATERIALS AND METHODS
Human subjects
All human subjects were informed of the purpose and the experimental procedures of the study. The Human Research Committee of the Tangdu Hospital for Approval of Research Involving Human Subjects approved the use of human tissues in this study. We also obtained signed informed consent from each study participant.
From September 2010 to May 2014, a total of 481 glioma cancer patients (264 men and 217 women) were randomly enrolled at the Tangdu Hospital of the Fourth Military Medical University in Xi’an, China. Their ages ranged from 1 to 81 years, with an average age of 40.79. Patients’ blood samples were collected. Patients underwent a standard clinical examination and none of them had received any therapy before admission before surgery. The histologic diagnosis of tumors was made and agreed upon by at least two senior pathologists at the Department of Pathology of the Hospital. All cases were systematically classified by clinical stage and histological type according to the 2007 WHO classification of tumors of the CNS criteria. The medical records of the patients were reviewed to assess the patients’ characteristics, including age, gender, surgery, radiotherapy, chemotherapy, WHO grade, OS, PFS and final status on the last follow-up examination.
Clinical and follow-up data were collected from medical charts, central radiological systems of the hospitals, out-patient clinics and telephone interviews. PFS was defined as the time from the date of pathological diagnosis to the date of initial tumor recurrence or progression (radiologically or pathologically). OS was measured from the date of pathological diagnosis (September 2010) to the date of death or last follow-up visit (May 2014). The date of death was determined by cancellation of social ID. The survival time was defined as the date from surgery to the date of death. Cases of death patients were regarded as censored data and marked on the survival curves.
SNP selection and genotyping
The rs2853676 polymorphism has been mapped to intron 2 of the TERT gene, which was implicated in the increased risk of glioma in 2009 [21]. We extracted genomic DNA from peripheral blood samples using a GoldMag-Mini Whole Blood Genomic DNA Purification Kit (GoldMag Ltd. Xi'an, China) according to the manufacturer's protocol. Sequenom MassARRAY Assay Design 3.0 Software was used to design primers for amplification and extension reactions [40]. SNP genotyping was performed by Sequenom MassARRAY RS1000 using the standard protocol recommended by the manufacturer Sequenom Typer 4.0 Software was used for data management and analysis [40, 41].
Statistical analysis
In univariate analysis, differences in PFS and OS between subgroups of patients were evaluated performed by log-rank tests. Survival curves were drawn using the Kaplan-Meier method. A cox proportional hazards model was applied to estimate the risk by calculating hazard ratios (HR) and the 95% confidence intervals (CI) for categorical variables of exposure. Multivariate Cox regression analysis models were then developed that adjusted for the most important covariates, including age, gender, surgery, radiotherapy, WHO CNS classification, chemotherapy, and WHO grade. A multivariate analysis was used taking into account the variables that were found to be significant on univariate analysis. The SPSS statistical software package version 17.0 (SPSS Inc. Chicago, IL, USA) was used for all analyses. P-value less than 0.05 were considered statistically significant.
Abbreviations
OS: overall survival; PFS: progress-free survival; WHO: World Health Organization; CNS: central nervous system; HR: hazard ratios; CI: confidence intervals; GTR: gross-total resection; NTR: near-total resection; STR: sub-total resection; GK: Gamma Knife; CRT: Conformal Radiotherapy
ACKNOWLEDGMENTS
This work was funded by the key research and development plan of Shandong province of China (2015GSF121018). We are grateful to all the participants in our study, this study could not succeed without them. We would also like to thank the clinicians and hospital staff who contributed to the data collection for this study.
CONFLICTS OF INTEREST
The authors declare that they have no competing interests.
REFERENCES
1. Sciumè G, Santoni A, Bernardini G. Chemokines and glioma: invasion and more. Journal of Neuroimmunology. 2010; 224:8-12.
2. Sayegh ET, Kaur G, Bloch O, Parsa AT. Systematic review of protein biomarkers of invasive behavior in glioblastoma. Molecular Neurobiology. 2014; 49:1212-1244.
3. Ferguson SD. Malignant Gliomas: Diagnosis and Treatment. Disease-a-Month. 2011; 57:558-569.
4. Levine AJ, Puzio-Kuter AM. The control of the metabolic switch in cancers by oncogenes and tumor suppressor genes. Science. 2010; 330:1340-4.
5. Louis DN, Ohgaki H, Wiestler OD, Cavenee WK, Burger PC, Jouvet A, Scheithauer BW, Kleihues P. The 2007 WHO classification of tumours of the central nervous system. Acta neuropathologica. 2007; 114:97-109.
6. Albert L, Samir K, Pope WB, Anh T, Solis OE, Franklin P, Forrest WF, Kanan P, Carrillo JA, Ajay P. Evidence for sequenced molecular evolution of IDH1 mutant glioblastoma from a distinct cell of origin. Journal of Clinical Oncology. 2011; 29:4482-4490.
7. Dominik S, Hendrik W, Volker H, Dong-Anh KQ, Jones DTW, Carolin K, Elke P, Martje TN, Martin S, Sebastian B. Hotspot mutations in H3F3A and IDH1 define distinct epigenetic and biological subgroups of glioblastoma. Cancer Cell. 2012; 22:425-437.
8. Stupp R, Mason WP, Van dB, Martin J, Weller M, Fisher B, Taphoorn MJB, Belanger K, Brandes AA, Marosi C, Bogdahn U. Radiotherapy plus concomitant and adjuvant temozolomide for glioblastoma. New England Journal of Medicine. 2005; 352:987-996.
9. Patrick Y W, Santosh K. Malignant gliomas in adults. New England Journal of Medicine. 2008; 359:877.
10. Rizzo D, Ruggiero A, Martini M, Rizzo V, Maurizi P, Riccardi R. Molecular Biology in Pediatric High-Grade Glioma: Impact on Prognosis and Treatment. Biomed Research International. 2014; 2015.
11. Alberto B, Amar G. Supratentorial high-grade astrocytoma and diffuse brainstem glioma: two challenges for the pediatric oncologist. Oncologist. 2004; 9:197-206.
12. Sabha N, Knobbe CB, Maganti M, Al OS, Bernstein M, Cairns R, B Ç, Von DA, Capper D, Mak TW. Analysis of IDH mutation, 1p/19q deletion, and PTEN loss delineates prognosis in clinical low-grade diffuse gliomas. Neuro-Oncology. 2014; 16:914-923.
13. Tobias K, Gautschi OP, Kuhn SA, Hottinger AF, Gerhard H, Stienen MN. [Low-grade gliomas in adults]. Praxis. 2014; 103:1385-1396.
14. Cavaliere R, Lopes MBS, Schiff D. Low-grade gliomas: an update on pathology and therapy. Lancet Neurology. 2005; 4:760-770.
15. Wick M, Zubov D, Hagen G. Genomic organization and promoter characterization of the gene encoding the human telomerase reverse transcriptase (hTERT). Gene. 1999; 232:97-106.
16. Jones AM, Beggs AD, Carvajal-Carmona L, Farrington S, Tenesa A, Walker M, Howarth K, Ballereau S, Hodgson SV, Zauber A. TERC polymorphisms are associated both with susceptibility to colorectal cancer and with longer telomeres. Gut. 2011; 61:248-254.
17. Valls C, Piñol C, Reñé JM, Buenestado J, Viñas J. Telomere length is a prognostic factor for overall survival in colorectal cancer. Colorectal Disease. 2011; 13:1265-1272.
18. Freier K, Pungs S, Flechtenmacher C, Bosch FX, Lichter P, Joos S, Hofele C. Frequent high telomerase reverse transcriptase expression in primary oral squamous cell carcinoma. Journal of Oral Pathology & Medicine. 2007; 36:267-272.
19. Rafnar T, Sulem P, Sn, Geller F, Gudmundsson J, Sigurdsson A, Jakobsdottir M, Helgadottir H, Thorlacius S, Aben K, Blondal T. Sequence variants at the TERT-CLPTM1L locus associate with many cancer types. Nature Genetics. 2009; 41:535.
20. Wrensch M, Jenkins RB, Chang JS. Variants in the CDKN2B and RTEL1 regions are associated with high-grade glioma susceptibility. Nature Genetics. 2009; 41: 905-908.
21. Sanjay S, Hosking FJ, Robertson LB, Dobbins SE, Marc S, Beatrice M, Matthias S, Yannick M, Blandine B, Jean-Yves D. Genome-wide association study identifies five susceptibility loci for glioma. Nature Genetics. 2009; 41:168-175.
22. Walsh KM, Veryan C, Smirnov IV, Terri R, Decker PA, Hansen HM, Thomas K, Kosel ML, Molinaro AM, Mccoy LS. Variants near TERT and TERC influencing telomere length are associated with high-grade glioma risk. Nature Genetics. 2014; 46:731-735.
23. Codd V, Nelson CP, Albrecht E, Mangino M, Deelen J, Buxton JL, Hottenga JJ, Fischer K, Esko T, Surakka I. Identification of seven loci affecting mean telomere length and their association with disease. Nature Genetics. 2013; 45:422-427.
24. Young NS. Telomere biology and telomere diseases: implications for practice and research. Hematology. 2010; 2010:30-35.
25. Cong YS, Wright WE, Shay JW. Human Telomerase and Its Regulation. Microbiol Mol Biol Rev. 2002; 66:: 407-425.
26. Pooley KA, Sandhu MS, Jonathan T, Mitul S, Driver KE, Luben RN, Bingham SA, Ponder BAJ, Pharoah PDP and Kay-Tee K. Telomere length in prospective and retrospective cancer case-control studies. Cancer Research. 2010; 70:3170-3176.
27. Zhang A, Zheng C, Lindvall C, Hou M, Ekedahl J, Lewensohn R, Yan Z, Yang X, Henriksson M, Blennow E. Frequent amplification of the telomerase reverse transcriptase gene in human tumors. Cancer Research. 2000; 60:6230-6235.
28. Simone M, Daunia V, Pooley KA, Landi MT, Egan KM, Baird DM, Jennifer P, Immaculata DV, Donato N. Telomerase reverse transcriptase locus polymorphisms and cancer risk: a field synopsis and meta-analysis. Journal of the National Cancer Institute. 2012; 104:840-854.
29. Jin-Lin C, Ping Y, Abudumailamu A, Wang L, Yun-Hai Y, Jian H. Association between the TERT Genetic Polymorphism rs2853676 and Cancer Risk: Meta-Analysis of 76,108 Cases and 134,215 Controls. Plos One. 2015; 10(6).
30. Arita H, Narita Y, Fukushima S, Tateishi K, Matsushita Y, Yoshida A, Miyakita Y, Ohno M, Collins VP, Kawahara N. Upregulating mutations in the TERT promoter commonly occur in adult malignant gliomas and are strongly associated with total 1p19q loss. Acta neuropathologica. 2013; 126:267-276.
31. Killela PJ, Reitman ZJ, Yuchen J, Chetan B, Nishant A, Diaz LA, Friedman AH, Henry F, Gallia GL, Giovanella BC. TERT promoter mutations occur frequently in gliomas and a subset of tumors derived from cells with low rates of self-renewal. Proceedings of the National Academy of Sciences of the United States of America. 2013; 110:6021-6026.
32. Lamborn KR, Yung WK, Chang SM, Wen PY, Cloughesy TF, DeAngelis LM, Robins HI, Lieberman FS, Fine HA, Fink KL, Junck L, Abrey L, Gilbert MR, et al. Progression-free survival: an important end point in evaluating therapy for recurrent high-grade gliomas. Neuro Oncol. 2008; 10:162-170.
33. Bent MVD, Afra D, Witte OD, Hassel MB, Schraub S, Hoang-Xuan K, Malmström PO, Collette L, Piérart M, Mirimanoff R. Long-term efficacy of early versus delayed radiotherapy for low-grade astrocytoma and oligodendroglioma in adults: the EORTC 22845 randomised trial. Digest of the World Core Medical Journals. 2005; 366:985-990.
34. Ohgaki H, Kleihues P. Population-based studies on incidence, survival rates, and genetic alterations in astrocytic and oligodendroglial gliomas. Journal of Neuropathology & Experimental Neurology. 2005; 64:479-489.
35. Bent MJ, Van Den, Brandes AA, Taphoorn MJB, Kros JM, Kouwenhoven MCM, Jean-Yves D, Bernsen HJJA, Marc F, Tijssen CC, Wolfgang G. Adjuvant procarbazine, lomustine, and vincristine chemotherapy in newly diagnosed anaplastic oligodendroglioma: long-term follow-up of EORTC brain tumor group study 26951. Journal of Clinical Oncology. 2013; 31:344-350.
36. Tykocki T, Michalik R, Bonicki W, Nauman P. Fluorescence-guided resection of primary and recurrent malignant gliomas with 5-aminolevulinic acid. Preliminary results. Neurologia I Neurochirurgia Polska. 2012; 46:47-51.
37. Kostaras X, Cusano F, Kline GA, Roa W, Easaw J. Use of dexamethasone in patients with high-grade glioma: a clinical practice guideline. Current Oncology. 2014; 21:e493-503.
38. Taal W, Oosterkamp HM, Walenkamp AME, Dubbink HJ, Beerepoot LV, Hanse MCJ, Buter J, Honkoop AH, Boerman D, Vos FYFD. Single-agent bevacizumab or lomustine versus a combination of bevacizumab plus lomustine in patients with recurrent glioblastoma (BELOB trial): a randomised controlled phase 2 trial. Lancet Oncology. 2014; 15:943-953.
39. Guo YF, Wang XB, Tian XY, Li Y, Li B, Huang Q, Zhang M, Li Z. Tumor-derived hepatocyte growth factor is associated with poor prognosis of patients with glioma and influences the chemosensitivity of glioma cell line to cisplatin in vitro. World Journal of Surgical Oncology. 2012; 10:1-11.
40. Gabriel S, Ziaugra L, Tabbaa D. SNP genotyping using the Sequenom MassARRAY iPLEX platform. Curr Protoc Hum Genet. 2009; Chapter 2(Unit 2):2.12.11-12.12.16.
41. Thomas RK, Baker AC, Debiasi RM, Winckler W, Laframboise T, Lin WM, Wang M, Feng W, Zander T, Macconaill LE. High-throughput oncogene mutation profiling in human cancer. Nature Genetics. 2007; 39:347-351.