
INTRODUCTION
Breast cancer (BC), one of the most frequently encountered malignant tumors in women, has become the main reason of tumor-associated death in our word [1], whose incidence rate is increasing year by year and accompanied by younger trend in the world [2, 3]. The etiology of BC is very complex, many factors cause it’s occurrence and development, the specific mechanism has not been clarified. Epidemiology and basic etiology studies have shown that BC’s occurrence and progression is closely related to multiple factors interaction between genetic, endocrine and external environment [4-6].
The genetic markers of BC are mainly expressed in two forms, that is, the higher external rate mutation gene and the lower external rate polymorphism gene. Compared with familial BC, most sporadic BC is associated with lower external rate polymorphism genes [7, 8]. The distribution of these genes in the population is more than 1%, and the genetic variation of these genes (Single nucleotide polymorphism, SNP) is mainly by changing the expression level and function of the protein and the modified factor inside and outside the cell, thus affecting the genetic susceptibility of BC [8]. In recent years, many BC-associated gene loci have been demonstrated by GWAS, 8q24 (rs13281615 and rs6983267) is the gene mutation site selected by this technique [7].
Previous functional studies have reported the association between 8q24 (rs13281615 and rs6983267) polymorphism and BC risk [9-29]. Because of differences in race and region, studies of this site are not entirely consistent with the conclusion that whether the site is associated with the risk of BC. To clarify the role of 8q24 (rs13281615 and rs6983267) polymorphism in BC risk, five meta-analysis [30-34] on the associations between 8q24 (rs13281615 and rs6983267) polymorphism and BC had been carried out. However, the results remain inconclusive and number of their studies included in their meta-analysis about BC is small. In the subgroup of their analyses the sample size is extremely small, and some just no subgroup. Therefore, we decided to carry out this meta-analysis on all the included case-control researches to make a more accurate assessment of the relationship. Moreover, we performed a subgroup analysis stratified by ethnicity.
RESULTS
Characteristics of included papers
The specific search process is shown in Figure 1. A total of 447 references were preliminarily identified at first based on our selection strategy. We also identified 2 papers [11, 29] through other source. 347 records left after removing repeated studies. We refer to titles or abstracts of all the included literatures, and then removed obviously irrelevant papers. In the end, the whole of the rest of the papers were checked based on the inclusion and exclusion criteria. Finally, 21 studies [9-29] on 8q24 (rs13281615 and rs6983267) polymorphism and the occurrence of BC were eventually included in our study, including 52,683 cases and 64,672 controls. Characteristics of eligible analysis are shown in Table 1. The 21 case-control papers were published between 2008 and 2014, among them, 1 study was performed in African, 7 in Asian, 12 in Caucasians and 1 in both African and Caucasians. All studies were case-controlled.
Table 1: Characteristics of the studies included in the meta-analysis
First author |
Year |
Country |
Ethnicity |
Source of controls |
Number(case/control) |
HWE |
rs13281615 |
||||||
Antoniou[9] |
2009 |
Mixed |
Caucasians |
Nested |
7787/6662 |
0.100 |
Bai[10] |
2014 |
China |
Asian |
PB |
280/287 |
0.086 |
Barnholtz-Sloan[11] |
2010 |
United States |
Caucasians |
PB |
1223/1117 |
0.220 |
Barnholtz-Sloan[11] |
2010 |
United States |
African |
PB |
736/658 |
0.580 |
Campa[12] |
2011 |
USA and Europe |
Caucasians |
PB |
8302/11615 |
0.106 |
Chan[13] |
2012 |
Singapore |
Asian |
PB |
1174/1463 |
0.047 |
Elematore[14] |
2014 |
Chile |
Caucasians |
PB |
347/801 |
0.993 |
Fletcher[15] |
2008 |
United Kingdom |
Caucasians |
PB |
1470/1341 |
0.366 |
Garcia-Closas[16] |
2008 |
Mixed |
Caucasians |
Nested |
15084 /22105 |
0.672 |
Gorodnova[17] |
2010 |
Russian |
Caucasians |
PB |
140/174 |
0.710 |
Harlid[18] |
2012 |
European |
Caucasians |
PB |
3545/5007 |
0.045 |
Jiang[19] |
2011 |
China |
Asian |
PB |
493/510 |
1.000 |
Latif[20] |
2010 |
British |
Caucasians |
HB |
919/343 |
0.639 |
Li[29] |
2011 |
China |
Asian |
HB |
558/635 |
0.748 |
Long[21] |
2010 |
China |
Asian |
PB |
2945/2981 |
0.985 |
McInerney[22] |
2009 |
Ireland |
Caucasians |
PB |
917/993 |
0.096 |
Mizoo[23] |
2012 |
Japan |
Asian |
PB |
466/458 |
0.252 |
Shan[24] |
2012 |
Tunisia |
African |
PB |
639/365 |
0.497 |
Tamimi[25] |
2010 |
Sweden |
Caucasians |
PB |
661/711 |
<0.001 |
Teraoka[26] |
2011 |
Denmark and USA |
Caucasians |
PB |
606/1194 |
0.041 |
Zhang[28] |
2014 |
China |
Asian |
HB |
482/527 |
0.089 |
rs6983267 |
||||||
Fletcher[15] |
2008 |
United Kingdom |
Caucasians |
PB |
1480/1336 |
0.453 |
McInerney[22] |
2009 |
Ireland |
Caucasians |
PB |
945/957 |
0.349 |
Wokolorczyk[27] |
2008 |
Canada |
Caucasians |
PB |
1006/1910 |
0.266 |
Zhang[28] |
2014 |
China |
Asian |
HB |
478/522 |
0.046 |
HWE: Hardy-Weinberg equilibrium; PB: population based; HB: hospital-based; SNP: single nucleotide polymorphism.
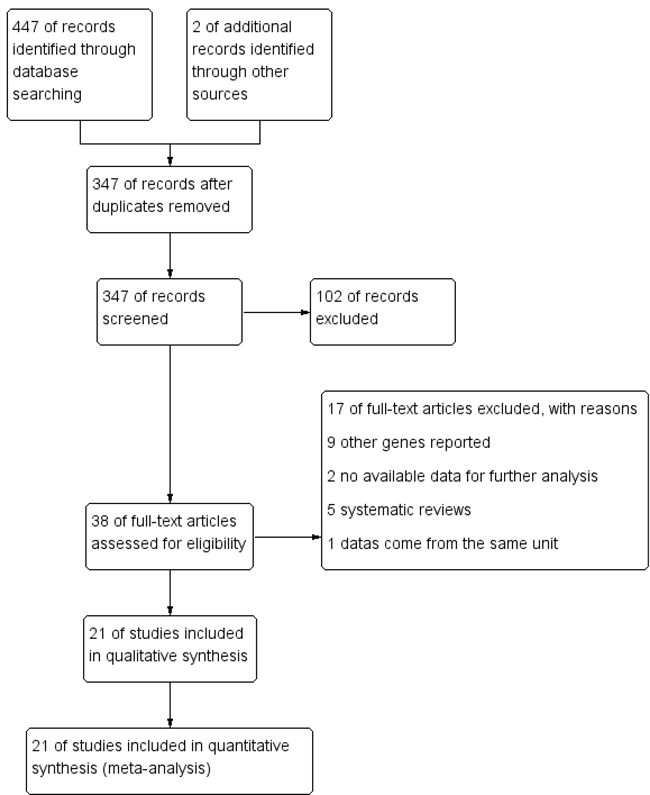
Figure 1: Flow chart of studies selection in this meta-analysis.
Meta-analysis results
Table 2 and Table 3 shows the 8q24 (rs13281615 and rs6983267) polymorphisms genotype distribution and allele frequencies in in case group and control group. Main results of our study were shown in Table 4. A total of 21 studies with 52,683 cases and 64,672 controls were included. As shown in Table 4, The pooled results indicated that the correlation between 8q24 rs13281615 polymorphism and the occurrence of BC was significant in any genetic model: Allele model (OR = 1.10, 95% CI = 1.07-1.13, P < 0.00001), dominant model (OR = 1.13, 95% CI = 1.08-1.18, P < 0.00001) recessive model (OR = 1.13, 95% CI = 1.08-1.18, P < 0.00001) homozygous genetic model (OR = 1.20, 95% CI = 1.13-1.27, P < 0.00001) heterozygote comparison (OR = 1.09, 95% CI = 1.06-1.12, P < 0.00001).
The subgroup study stratified by ethnicity showed an increased BC risk in Asians (Allele model: OR = 1.08, 95% CI = 1.03-1.14, P = 0.001; dominant model: OR = 1.11, 95% CI = 1.03-1.21, P = 0.009; recessive model: OR = 1.11, 95% CI = 1.03-1.20, P = 0.008; homozygous genetic model: OR = 1.17, 95% CI = 1.07-1.29, P = 0.001; heterozygote comparison: OR = 1.08, 95% CI = 1.00-1.18, P = 0.06) and Caucasians (Allele model: OR = 1.11, 95% CI = 1.06-1.16, P < 0.00001; dominant model: OR = 1.14, 95% CI = 1.07-1.21, P < 0.0001; recessive model: OR = 1.15, 95% CI = 1.08-1.22, P < 0.00001; homozygous genetic model: OR = 1.22, 95% CI = 1.12-1.32, P < 0.00001; heterozygote comparison: OR = 1.11, 95% CI = 1.05-1.17, P = 0.0005). While, there was not any genetic model attained statistical correlation in Africans. There was no association in any genetic model in rs6983267 (Table 4).
Table 2: rs13281615 polymorphisms genotype distribution and allele frequency in cases and controls
First author |
Genotype (N) |
Allele frequency (N) |
||||||||||
Case |
Control |
Case |
Control |
|||||||||
Total |
GG |
AG |
AA |
Total |
GG |
AG |
AA |
G |
A |
G |
A |
|
Antoniou |
7787 |
1396 |
3872 |
2519 |
6662 |
1158 |
3317 |
2187 |
6664 |
8910 |
5633 |
7691 |
Bai |
280 |
63 |
152 |
65 |
287 |
62 |
158 |
67 |
278 |
282 |
282 |
292 |
Barnholtz-Sloan |
1223 |
230 |
604 |
389 |
1117 |
194 |
519 |
404 |
1064 |
1382 |
907 |
1327 |
Barnholtz-Sloan |
736 |
130 |
387 |
219 |
658 |
123 |
331 |
204 |
647 |
825 |
577 |
739 |
Campa |
8302 |
1764 |
4044 |
2494 |
11615 |
2193 |
5609 |
3813 |
7572 |
9032 |
9995 |
13235 |
Chan |
1174 |
317 |
554 |
303 |
1463 |
364 |
693 |
406 |
1188 |
1160 |
1421 |
1505 |
Elematore |
347 |
131 |
148 |
68 |
801 |
255 |
394 |
152 |
410 |
284 |
904 |
698 |
Fletcher |
1470 |
305 |
730 |
435 |
1341 |
225 |
629 |
487 |
1340 |
1600 |
1079 |
1603 |
Garcia-Closas |
15084 |
2921 |
7284 |
4879 |
22105 |
3773 |
10682 |
7650 |
13126 |
17042 |
18228 |
25982 |
Gorodnova |
140 |
42 |
63 |
35 |
174 |
38 |
84 |
52 |
147 |
133 |
160 |
188 |
Harlid |
3545 |
719 |
1723 |
1103 |
5007 |
884 |
2357 |
1766 |
3161 |
3929 |
4125 |
5889 |
Jiang |
493 |
125 |
247 |
121 |
510 |
127 |
255 |
128 |
497 |
489 |
509 |
511 |
Latif |
919 |
185 |
464 |
270 |
343 |
56 |
160 |
127 |
834 |
1004 |
272 |
414 |
Li |
558 |
162 |
285 |
111 |
635 |
173 |
313 |
149 |
609 |
507 |
659 |
611 |
Long |
2945 |
796 |
1470 |
679 |
2981 |
745 |
1491 |
745 |
3062 |
2828 |
2981 |
2981 |
McInerney |
917 |
178 |
467 |
272 |
993 |
182 |
456 |
355 |
823 |
1011 |
820 |
1166 |
Mizoo |
466 |
180 |
211 |
75 |
458 |
177 |
206 |
75 |
571 |
361 |
560 |
356 |
Shan |
639 |
201 |
303 |
135 |
365 |
96 |
176 |
93 |
705 |
573 |
368 |
362 |
Tamimi |
661 |
223 |
263 |
175 |
711 |
273 |
277 |
161 |
709 |
613 |
823 |
599 |
Teraoka |
606 |
140 |
292 |
174 |
1194 |
213 |
623 |
358 |
572 |
640 |
1049 |
1339 |
Zhang |
482 |
143 |
248 |
91 |
527 |
124 |
283 |
120 |
534 |
430 |
531 |
523 |
Table 3: rs6983267 polymorphisms genotype distribution and allele frequency in cases and controls
First author |
Genotype (N) |
Allele frequency (N) |
||||||||||
Case |
Control |
Case |
Control |
|||||||||
Total |
GG |
AG |
AA |
Total |
GG |
AG |
AA |
G |
A |
G |
A |
|
Fletcher |
1480 |
338 |
734 |
408 |
1336 |
312 |
653 |
371 |
1410 |
1550 |
1277 |
1395 |
McInerney |
945 |
230 |
464 |
251 |
957 |
245 |
464 |
248 |
924 |
966 |
954 |
960 |
Wokolorczyk |
1006 |
254 |
507 |
245 |
1910 |
513 |
977 |
420 |
1015 |
997 |
2003 |
1817 |
Zhang |
478 |
151 |
218 |
109 |
522 |
183 |
233 |
106 |
520 |
436 |
599 |
445 |
Table 4: Meta-analysis results
Comparisons |
OR |
95%CI |
P value |
Heterogeneity |
Effects model |
|
I2 |
P value |
|||||
Allele model |
||||||
rs13281615 |
1.10 |
1.07-1.13 |
P < 0.00001 |
49% |
0.006 |
R |
African |
1.08 |
0.96-1.22 |
0.18 |
58% |
0.12 |
F |
Asian |
1.08 |
1.03-1.14 |
0.001 |
0% |
0.77 |
F |
Caucasians |
1.11 |
1.06-1.16 |
P < 0.00001 |
67% |
0.0004 |
R |
rs6983267 |
0.95 |
0.89-1.01 |
0.10 |
0% |
0.66 |
F |
Dominant model |
||||||
rs13281615 |
1.13 |
1.08-1.18 |
P < 0.00001 |
39% |
0.03 |
R |
African |
1.13 |
0.94-1.36 |
0.18 |
0% |
0.34 |
F |
Asian |
1.11 |
1.03-1.21 |
0.009 |
0% |
0.92 |
F |
Caucasians |
1.14 |
1.07-1.21 |
P < 0.0001 |
63% |
0.002 |
R |
rs6983267 |
0.94 |
0.85-1.04 |
0.24 |
0% |
0.63 |
F |
Recessive model |
||||||
rs13281615 |
1.13 |
1.08-1.18 |
P < 0.00001 |
30% |
0.10 |
R |
African |
1.09 |
0.89-1.32 |
0.40 |
60% |
0.11 |
F |
Asian |
1.11 |
1.03-1.20 |
0.008 |
0% |
0.79 |
F |
Caucasians |
1.15 |
1.08-1.22 |
P < 0.00001 |
50% |
0.02 |
R |
rs6983267 |
0.93 |
0.84-1.03 |
0.15 |
0% |
0.89 |
F |
Homozygous genetic model |
||||||
rs13281615 |
1.20 |
1.13-1.27 |
P < 0.00001 |
43% |
0.02 |
R |
African |
1.16 |
0.92-1.47 |
0.22 |
60% |
0.12 |
F |
Asian |
1.17 |
1.07-1.29 |
0.001 |
0% |
0.77 |
F |
Caucasians |
1.22 |
1.12-1.32 |
P < 0.00001 |
62% |
0.002 |
R |
rs6983267 |
0.90 |
0.80-1.02 |
0.10 |
0% |
0.69 |
F |
Heterozygote comparison |
||||||
rs13281615 |
1.09 |
1.06-1.12 |
P < 0.00001 |
22% |
0.17 |
F |
African |
1.12 |
0.93-1.36 |
0.24 |
0% |
0.68 |
F |
Asian |
1.08 |
1.00-1.18 |
0.06 |
0% |
0.98 |
F |
Caucasians |
1.11 |
1.05-1.17 |
0.0005 |
55% |
0.01 |
R |
rs6983267 |
0.96 |
0.86-1.07 |
0.45 |
0% |
0.74 |
F |
F-fixed effects model; R-random effects model.
Sensitivity analyses
As shown in Table 1, all the studies conformed to he balance of Hardy-Weinberg equilibrium (HWE) in controls except 5 studies (P < 0.05), however, after performing the sensitivity analyses, the overall outcomes were no statistically significant change when removing any of the articles, indicating that our study has good stability and reliability.
Detection for heterogeneity
Heterogeneity among studies was obtained by Q statistic. Random-effect models were applied if p-value of heterogeneity tests were less than 0.1 (p ≤ 0.1), otherwise, fixed-effect models were selected (Table 4).
Publication bias
We use Begg’s funnel plot and Egger test to evaluate the published bias. As Figure 2 (rs13281615) and Figure 3 (rs6983267) indicated, the funnel plot is symmetrical, indicating that there is no significant publication bias in the total population. In our study, no significant publication bias was found in the Begg’s test and Egger’s test (P > 0.05).
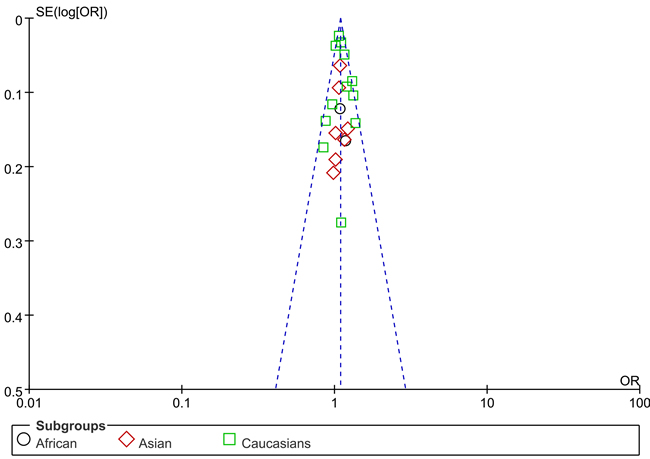
Figure 2: Funnel plot on the association of rs13281615 variant and breast cancer in a fixed-effect model (heterozygote comparison). Abbreviations: SE, standard error; OR, odds ratio; A vs. G, Allele model.
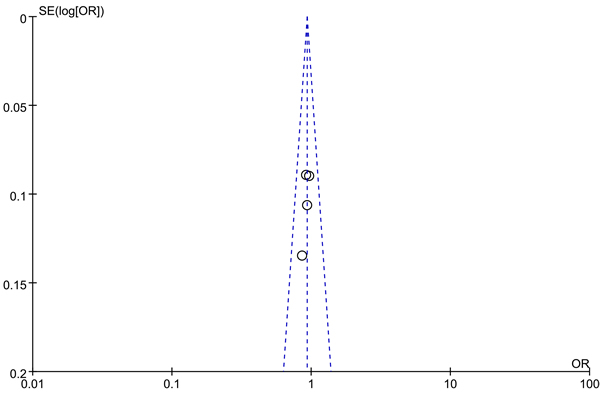
Figure 3: Funnel plot on the association of rs6983267 variant and breast cancer in a fixed-effect model (recessive model ). Abbreviations: SE, standard error; OR, odds ratio; A vs. G, Allele model.
DISCUSSION
A large amount of evidence suggests that genetics is important in determining the risk of cancer [35]. Related research is to search for the susceptibility genes associated with cancer. It is believed that SNP is the main cause of human genetic variation, which may increase individual risk to suffer cancer [14, 18, 22, 23]. With the development of medical science, hereditary susceptibility to cancer has caused people’s great interest, and the study on the genetic polymorphism of the tumor is increasing.
At present, BRCA1 and BRCA2 gene polymorphisms are generally considered to be associated with BC, but because of the low mutation rate, it can only be detected in the small part of BC patients [36]. In 2007, the whole genome association analysis identified many genetic polymorphisms that may be associated with the development of BC, which included rs6983267 and rs13281615 [37].
The 8q24 rs6983267 and rs13281615 bit is located in the non - base region of the dye - color 8q24, and Its function is not very clear. 8q24.12-24.13 location myelocytomatosis oncogene (MYC), MYC is a group of cancer genes, which are not expressed in normal cells, and expressed in some cancer cells. MYC can promote cell proliferation, immortalized, differentiation and transformation. It is an significant factor in the formation of BC, colon cancer and prostate cancer [38, 39]. Studies shown that the chromosome 8q24 region is related to the occurrence of prostate cancer and colon cancer, which can play a role in carcinogenesis through interacting with MYC gene amplification and over expression [40]. The change of some loci of a single gene may have limited impact on the ultimate effect of cancer, and it is needed to carry out large-scale studies in populations.
Recently, a growing number of epidemiological studies have been carried out to explore the relationship between 8q24 (rs13281615 and rs6983267) polymorphisms and the occurrence of BC. Nevertheless, the conclusions are still inconclusive. Therefore, we carried out the meta-analysis on the whole included case-control researches to make a more accurate assessment of the relationship.
In our study, 21 studies were eventually included, including 52,683 cases and 64,672 controls. And we assessed the relationship between 8q24 (rs13281615 and rs6983267) polymorphisms and the occurrence of BC. In the total population, the pooled results indicated that the correlation between 8q24 rs13281615 polymorphism and the occurrence of BC was significant in any genetic model (Table 4). It was partially consistent with the consequences of previous five meta-analysis [30-34], while the sample size was several times than theirs, make the results more convincing.
BC is a disease with a difference in the incidence and mortality among different ethnic groups. Each increase of 25% European descent, the risk of developing BC will increase by 1.79 times [41]. Easton [42] et al believes that the incidence of the European population is higher than that of other ethnic groups, which are consistent with the results of this study. The subgroup study stratified by ethnicity showed an increased BC risk in Asians and Caucasians (Table 4). While, there was not any genetic model attained statistical correlation in Africans. There was no association in any genetic model in rs6983267 (Table 4). It was partially consistent with the Dai(2013)’s study [30] ( with 11 papers containing 40,762 cases and 50,380 controls) and Pei(2013)’s [32] (with 12 eligible studies including 42,508 cases and 53,928 controls) findings. Another meta-analysis by Song(2012) [33] et al, including seven papers with 22,128 cases and 29,276 controls, they found no relationship between rs13281615 polymorphism and BC susceptibility in Asians. This contradiction may be caused by sample sizes and racial differences.
Our meta-analysis has some limitations in the following aspects. First, our study is a summary of the data. Due to the lack of the original data needed, we could not evaluate the cancer susceptibility stratified by age, Sex, environment, hormone level, menopause age and other risk factors. We also cannot analyze these studies to analyze the potential interaction of gene - environment and gene - gene. Secondly, we just included the published papers in our study, there may still be some published studies in line with the conditions. Moreover, our study is a summary of the data. We did not verify it from the level of basic experiments. Data from a large sample of multiple centers is still needed to confirm the relationship between 8q24 (rs13281615 and rs6983267) polymorphisms and BC risk.
In summary, our study suggests that 8q24 rs13281615 polymorphism could increase the risk of BC in Asians, Caucasians and in overall population, While, there was no association in Africans. The rs6983267 polymorphism has no relationship with the occurrence of BC in any genetic model. Data from a large sample of multiple centers is still needed to confirm our findings.
MATERIALS AND METHODS
Literature searching strategy
We searched PubMed, EMBASE, Web of science, the Cochrane Library for relevant studies published before August 13, 2015. The following keywords were used: rs6983267/rs13281615/8q24, variant*/genotype/polymorphism/SNP, breast AND (cancer or carcinom* or neoplasm* or tumor) and the combined phrases for all genetic studies on the association between the 8q24 (rs13281615 and rs6983267) polymorphism and BC risk. The reference lists of all articles were also manually screened for potential studies. Abstracts and citations were screened independently by two authors, all the agreed articles need a second screen for full-text reports. The searching was done without restriction on language.
Selection and exclusion criteria
Inclusion criteria: A study was included in this meta-analysis if it met the following criteria: i) independent case-control studies for humans; ii) the study evaluated the association between 8q24 (rs13281615 and rs6983267) polymorphism and BC risk; iii) has available genotype frequencies in cancer cases and control subjects for risk estimate. We excluded comments, editorials, systematic reviews or studies lacking sufficient data. If the publications were duplicated or shared in more than one study, the most recent publications were included. All identified studies were screened by two investigators independently. What’s more, there was no limitation for publication language.
Data extraction and synthesis
We used endnote bibliographic software to construct an electronic library of citations identified in the literature search. All the PubMed, EMBASE, Web of science and the Cochrane Library searches were performed using Endnote; duplicates were found automatically by endnote and deleted manually. All data extraction were checked and calculated twice according to the inclusion criteria listed above by two independent investigators. Data extracted from the included studies were as follows: First author, year of publication, country, ethnicity, Source of controls, Genotyping method, number of cases and controls and evidence of HWE in controls. A third reviewer would participate if some disagreements were emerged, and a final decision was made by the majority of the votes.
Statistical analysis
All statistical analyses were performed using STATA version 11.0 software (StataCorp LP, College Station, TX) and Review Manage version 5.2.0 (The Cochrane Collaboration, 2012). Hardy-Weinberg equilibrium (HWE) was assessed by χ2 test in the control group of each study [43]. The strength of associations between the 8q24 (rs13281615 and rs6983267) polymorphism and BC risk were measured by odds ratio (ORs) with 95% confidence interval (CIs). Z test was used to assess the significance of the ORs, I2 and Q statistics was used to determine the statistical heterogeneity among studies. A random-effect model was used if p value of heterogeneity tests was no more than 0.1 (p ≤ 0.1), otherwise, a fixed-effect model was selected [43, 44]. Sensitivity analyses were performed to assess the stability of the results. We used Begg’s funnel plot and Egger’s test to evaluate the publication bias [45, 46]. The strength of the association was estimated in the allele model, the dominant model, the recessive model, the homozygous genetic model, and the heterozygous genetic model, respectively. p < 0.05 was considered statistically significant. We performed subgroup according to Ethnicity.
CONFLICTS OF INTEREST
The authors have declared that no conflict of interest exists.
REFERENCES
1. Smigal C, Jemal A, Ward E, Cokkinides V, Smith R, Howe HL, Thun M. Trends in breast cancer by race and ethnicity: update 2006. CA Cancer J Clin. 2006; 56: 168-83.
2. Lee YC, Chuang JP, Hsieh PC, Chiou MJ, Li CY. A higher incidence rate of acute coronary syndrome following radiation therapy in patients with breast cancer and a history of coronary artery diseases. Breast Cancer Res Treat. 2015; 152: 429-35. doi: 10.1007/s10549-015-3481-5.
3. McPherson K. Publicity of NHS breast cancer screening programme is unfair. BMJ. 2011; 342: d791. doi: 10.1136/bmj.d791.
4. Tao Z, Shi A, Lu C, Song T, Zhang Z, Zhao J. Breast Cancer: Epidemiology and Etiology. Cell Biochem Biophys. 2014. doi: 10.1007/s12013-014-0459-6.
5. Cavalieri EL, Rogan EG. The etiology and prevention of breast cancer. Drug Discov Today Dis Mech. 2012; 9: e55-e69. doi: 10.1016/j.ddmec.2013.02.001.
6. Almendro V, Fuster G. Heterogeneity of breast cancer: etiology and clinical relevance. Clin Transl Oncol. 2011; 13: 767-73. doi: 10.1007/s12094-011-0731-9.
7. Shu XO, Long J, Lu W, Li C, Chen WY, Delahanty R, Cheng J, Cai H, Zheng Y, Shi J, Gu K, Wang WJ, Kraft P, et al. Novel genetic markers of breast cancer survival identified by a genome-wide association study. Cancer Res. 2012; 72: 1182-9. doi: 10.1158/0008-5472.CAN-11-2561.
8. Dunning AM, Healey CS, Pharoah PD, Teare MD, Ponder BA, Easton DF. A systematic review of genetic polymorphisms and breast cancer risk. Cancer Epidemiol Biomarkers Prev. 1999; 8: 843-54.
9. Antoniou AC, Sinilnikova OM, McGuffog L, Healey S, Nevanlinna H, Heikkinen T, Simard J, Spurdle AB, Beesley J, Chen X, Neuhausen SL, Ding YC, Couch FJ, et al. Common variants in LSP1, 2q35 and 8q24 and breast cancer risk for BRCA1 and BRCA2 mutation carriers. Hum Mol Genet. 2009; 18: 4442-56. doi: 10.1093/hmg/ddp372.
10. Bai X, Jiang Y, Liu T, Wu H, Zhang J, Pang D. Relationship between single nucleotide polymorphisms in 2q35 rs13387042 and 8q24 rs13281615 and breast cancer risk of Han premenopausal women in Northern China. China Oncology. 2014; 24: 669-75.
11. Barnholtz-Sloan JS, Shetty PB, Guan X, Nyante SJ, Luo J, Brennan DJ, Millikan RC. FGFR2 and other loci identified in genome-wide association studies are associated with breast cancer in African-American and younger women. Carcinogenesis. 2010; 31: 1417-23. doi: 10.1093/carcin/bgq128.
12. Campa D, Kaaks R, Le Marchand L, Haiman CA, Travis RC, Berg CD, Buring JE, Chanock SJ, Diver WR, Dostal L, Fournier A, Hankinson SE, Henderson BE, et al. Interactions between genetic variants and breast cancer risk factors in the breast and prostate cancer cohort consortium. J Natl Cancer Inst. 2011; 103: 1252-63. doi: 10.1093/jnci/djr265.
13. Chan M, Ji SM, Liaw CS, Yap YS, Law HY, Yoon CS, Wong CY, Yong WS, Wong NS, Ng R, Ong KW, Madhukumar P, Oey CL, et al. Association of common genetic variants with breast cancer risk and clinicopathological characteristics in a Chinese population. Breast Cancer Res Treat. 2012; 136: 209-20. doi: 10.1007/s10549-012-2234-y.
14. Elematore I, Gonzalez-Hormazabal P, Reyes JM, Blanco R, Bravo T, Peralta O, Gomez F, Waugh E, Margarit S, Ibanez G, Romero C, Pakomio J, Roizen G, et al. Association of genetic variants at TOX3, 2q35 and 8q24 with the risk of familial and early-onset breast cancer in a South-American population. Mol Biol Rep. 2014; 41: 3715-22. doi: 10.1007/s11033-014-3236-0.
15. Fletcher O, Johnson N, Gibson L, Coupland B, Fraser A, Leonard A, dos Santos Silva I, Ashworth A, Houlston R, Peto J. Association of genetic variants at 8q24 with breast cancer risk. Cancer Epidemiol Biomarkers Prev. 2008; 17: 702-5. doi: 10.1158/1055-9965.epi-07-2564.
16. Garcia-Closas M, Hall P, Nevanlinna H, Pooley K, Morrison J, Richesson DA, Bojesen SE, Nordestgaard BG, Axelsson CK, Arias JI, Milne RL, Ribas G, González-Neira A, et al. Heterogeneity of breast cancer associations with five susceptibility loci by clinical and pathological characteristics. PLoS Genetics. 2008; 4.
17. Gorodnova TV, Kuligina E, Yanus GA, Katanugina AS, Abysheva SN, Togo AV, Imyanitov EN. Distribution of FGFR2, TNRC9, MAP3K1, LSP1, and 8q24 alleles in genetically enriched breast cancer patients versus elderly tumor-free women. Cancer Genet Cytogenet. 2010; 199: 69-72. doi: 10.1016/j.cancergencyto.2010.01.020.
18. Harlid S, Ivarsson MI, Butt S, Grzybowska E, Eyfjord JE, Lenner P, Forsti A, Hemminki K, Manjer J, Dillner J, Carlson J. Combined effect of low-penetrant SNPs on breast cancer risk. Br J Cancer. 2012; 106: 389-96. doi: 10.1038/bjc.2011.461.
19. Jiang Y, Han J, Liu J, Zhang G, Wang L, Liu F, Zhang X, Zhao Y, Pang D. Risk of genome-wide association study newly identified genetic variants for breast cancer in Chinese women of Heilongjiang Province. Breast Cancer Res Treat. 2011; 128: 251-7. doi: 10.1007/s10549-010-1327-8.
20. Latif A, Hadfield KD, Roberts SA, Shenton A, Lalloo F, Black GC, Howell A, Evans DG, Newman WG. Breast cancer susceptibility variants alter risks in familial disease. J Med Genet. 2010; 47: 126-31. doi: 10.1136/jmg.2009.067256.
21. Long J, Shu XO, Cai Q, Gao YT, Zheng Y, Li G, Li C, Gu K, Wen W, Xiang YB, Lu W, Zheng W. Evaluation of breast cancer susceptibility loci in Chinese women. Cancer Epidemiol Biomarkers Prev. 2010; 19: 2357-65. doi: 10.1158/1055-9965.epi-10-0054.
22. McInerney N, Colleran G, Rowan A, Walther A, Barclay E, Spain S, Jones AM, Tuohy S, Curran C, Miller N, Kerin M, Tomlinson I, Sawyer E. Low penetrance breast cancer predisposition SNPs are site specific. Breast Cancer Res Treat. 2009; 117: 151-9. doi: 10.1007/s10549-008-0235-7.
23. Mizoo T, Taira N, Nishiyama K, Nogami T, Iwamoto T, Motoki T, Shien T, Matuoka J, Doihara H, Ishihara S, Kawai N, Kawasaki K, Ishibe Y, et al. Effect of lifestyle and single nucleotide polymorphisms on breast cancer risk: A case-control study in Japanese women. Cancer Research. 2012; 72.
24. Shan J, Mahfoudh W, Dsouza SP, Hassen E, Bouaouina N, Abdelhak S, Benhadjayed A, Memmi H, Mathew RA, Aigha, II, Gabbouj S, Remadi Y, Chouchane L. Genome-Wide Association Studies (GWAS) breast cancer susceptibility loci in Arabs: susceptibility and prognostic implications in Tunisians. Breast Cancer Res Treat. 2012; 135: 715-24. doi: 10.1007/s10549-012-2202-6.
25. Tamimi RM, Lagiou P, Czene K, Liu J, Ekbom A, Hsieh CC, Adami HO, Trichopoulos D, Hall P. Birth weight, breast cancer susceptibility loci, and breast cancer risk. Cancer Causes Control. 2010; 21: 689-96. doi: 10.1007/s10552-009-9496-7.
26. Teraoka SN, Bernstein JL, Reiner AS, Haile RW, Bernstein L, Lynch CF, Malone KE, Stovall M, Capanu M, Liang X, Smith SA, Mychaleckyj J, Hou X, et al. Single nucleotide polymorphisms associated with risk for contralateral breast cancer in the Women’s Environment, Cancer, and Radiation Epidemiology (WECARE) Study. Breast cancer research. 2011; 13: R114.
27. Wokolorczyk D, Gliniewicz B, Sikorski A, Zlowocka E, Masojc B, Debniak T, Matyjasik J, Mierzejewski M, Medrek K, Oszutowska D, Suchy J, Gronwald J, Teodorczyk U, et al. A range of cancers is associated with the rs6983267 marker on chromosome 8. Cancer Res. 2008; 68: 9982-6. doi: 10.1158/0008-5472.can-08-1838.
28. Zhang Y, Yi P, Chen W, Ming J, Zhu B, Li Z, Shen N, Shi W, Ke J, Zhao Q, Lu X, Xun X, Liu L, et al. Association between polymorphisms within the susceptibility region 8q24 and breast cancer in a Chinese population. Tumour Biol. 2014; 35: 2649-54. doi: 10.1007/s13277-013-1348-0.
29. Li L, Guo Z, Hua D, He J, Hang Z, Zhou X. Association of the 8q24 rs13281615 polymorphisms with breast cancer risk and clinical and pathological characteristics in Chinese Han women. Chin J Lab Med. 2011; 34: 73-6. doi: 10.3760/cma.j.issn.1009-9158.2011.01.020.
30. Dai G, Guo Z, Yang X, Yu B, Li L. Association of 8q24 rs13281615A > G polymorphism with breast cancer risk: evidence from 40,762 cases and 50,380 controls. Mol Biol Rep. 2013; 40: 4065-73. doi: 10.1007/s11033-012-2484-0.
31. Gong WF, Zhong JH, Xiang BD, Ma L, You XM, Zhang QM, Li LQ. Single nucleotide polymorphism 8q24 rs13281615 and risk of breast cancer: meta-analysis of more than 100,000 cases. PLoS One. 2013; 8: e60108. doi: 10.1371/journal.pone.0060108.
32. Pei Y-L, Zhang H-L, Han H-G. Polymorphism of 8q24 rsl3281615 and breast cancer risk. Tumor Biology. 2013; 34: 421-8. doi: 10.1007/s13277-012-0566-1.
33. Song J, Zhang L, Zheng H, Chen K. Association between a single nucleotide polymorphism in 8q24 rs13281615 and breast cancer risk:a Meta-analysis. Tumor. 2012; 32: 38-41,64.
34. Zhang Q, Gong W, Huang X, Weng G, Zou Y, Liao J, Zhong J. Relationship between 8q24 rs13281615 Gene Polymorphism and Risk of Breast Cancer. Cancer Research on Prevention and Treatment. 2014; 41: 400-4.
35. Risch N, Merikangas K. The future of genetic studies of complex human diseases. Science. 1996; 273: 1516-7. doi:
36. Walsh T, Casadei S, Coats KH, Swisher E, Stray SM, Higgins J, Roach KC, Mandell J, Lee MK, Ciernikova S, Foretova L, Soucek P, King MC. Spectrum of mutations in BRCA1, BRCA2, CHEK2, and TP53 in families at high risk of breast cancer. Jama. 2006; 295: 1379-88. doi: 10.1001/jama.295.12.1379.
37. Cha Y, Ahn KS, Park J, Kim BS, Bang SM, Kim IH, Yoon SS, Lee D, Lee JS, Lee YY, Park S, Kim BK. Whole genome association study in acute myeloid leukemia with a normal karyotype, using a single-nucleotide polymorphism (SNP) analysis. Blood. 2007; 110: 131b-b.
38. Sugimachi K, Niida A, Yamamoto K, Shimamura T, Imoto S, Iinuma H, Shinden Y, Eguchi H, Sudo T, Watanabe M, Tanaka J, Kudo S, Hase K, et al. Allelic Imbalance at an 8q24 Oncogenic SNP is Involved in Activating MYC in Human Colorectal Cancer. Annals of Surgical Oncology. 2014; 21: S515-S21. doi: 10.1245/s10434-013-3468-6.
39. Fromont G, Godet J, Peyret A, Irani J, Celhay O, Rozet F, Cathelineau X, Cussenot O. 8q24 amplification is associated with Myc expression and prostate cancer progression and is an independent predictor of recurrence after radical prostatectomy. Human Pathology. 2013; 44: 1617-23. doi: 10.1016/j.humpath.2013.01.012.
40. Ahmadiyeh N, Pomerantz MM, Grisanzio C, Herman P, Jia L, Almendro V, He HH, Brown M, Liu XS, Davis M, Caswell JL, Beckwith CA, Hills A, et al. 8q24 prostate, breast, and colon cancer risk loci show tissue-specific long-range interaction with MYC. Proceedings of the National Academy of Sciences of the United States of America. 2010; 107: 9742-6. doi: 10.1073/pnas.0910668107.
41. Ziv E, John EM, Choudhry S, Kho J, Lorizio W, Perez-Stable EJ, Burchard EG. Genetic ancestry and risk factors for breast cancer among Latinas in the San Francisco Bay Area. Cancer Epidemiology Biomarkers & Prevention. 2006; 15: 1878-85. doi: 10.1158/1055-9965.EPI-06-0092.
42. Easton DF, Pooley KA, Dunning AM, Pharoah PD, Thompson D, Ballinger DG, Struewing JP, Morrison J, Field H, Luben R, Wareham N, Ahmed S, Healey CS, et al. Genome-wide association study identifies novel breast cancer susceptibility loci. Nature. 2007; 447: 1087-93. doi: 10.1038/nature05887.
43. Mantel N, Haenszel W. Statistical aspects of the analysis of data from retrospective studies of disease. J Natl Cancer Inst. 1959; 22: 719-48.
44. DerSimonian R, Laird N. Meta-analysis in clinical trials. Control Clin Trials. 1986; 7: 177-88.
45. Begg CB, Mazumdar M. Operating characteristics of a rank correlation test for publication bias. Biometrics. 1994; 50: 1088-101.
46. Egger M, Davey Smith G, Schneider M, Minder C. Bias in meta-analysis detected by a simple, graphical test. BMJ. 1997; 315: 629-34.