
INTRODUCTION
Overexpression and mutations of epidermal growth factor receptor (EGFR) are associated with tumor cell growth, differentiation, proliferation, apoptosis and cellular invasiveness [1]. Clinical treatment options for KRAS wild-type EGFR in head and neck squamous cell carcinoma (HNSCC) and metastatic colorectal cancer (mCRC), encompass monoclonal antibodies (mAbs) cetuximab and panitumumab. Mutant EGFR expressing tumors, including non-small cell lung cancer (NSCLC), are treated with the tyrosine kinase inhibitors erlotinib and gefitinib [2–4].
EGFR-targeted therapy might be improved by optimizing antibody-dependent cell-mediated cytoxicity (ADCC) responses. Imgatuzumab (GA201) is a novel humanized anti-EGFR IgG1 isotype mAb, glycoengineered for enhanced ADCC, as well as inhibiting ligand-dependent signaling of EGFR. Imgatuzumab recognizes human EGFR and is not cross-reactive with murine EGFR [5]. It showed superior in vivo efficacy compared to cetuximab and non-glycoengineered imgatuzumab in both KRAS-mutant and KRAS-wild type tumor models. In phase 1 studies imgatuzumab demonstrated promising efficacy in heavily pretreated patients with advanced EGFR-positive solid tumors and KRAS-mutant EGFR-positive advanced colorectal cancer [6, 7].
Whole body determination of EGFR expression in lesions using molecular imaging could support decision making during clinical development and clinical practice. Antibody biodistribution can be visualized by labeling mAbs with the PET isotope Zirconium-89 (89Zr, t½ = 78.4 h). We previously developed and successfully tested 89Zr-labeled antibody-based tracers targeting human epidermal growth factor receptor 2 (HER2), vascular endothelial growth factor (VEGF) and HER3 in the preclinical and clinical setting [8–12]. 89Zr-labeled antibodies have also been developed for preclinical EGFR imaging [13–15]. Furthermore, clinical EGFR imaging has been performed with 89Zr-cetuximab in advanced colorectal cancer patient [16,17]. Additional clinical studies are currently ongoing for both 89Zr-cetuximab and 89Zr-panitumumab (ClinicalTrial.gov identifiers NCT01691391, NCT02117466 and NCT02192541).
Unfortunately, preclinical EGFR antibody-based imaging studies revealed a mismatch between in vivo EGFR protein expression and tumor tracer uptake [13, 17]. Many factors have been suggested for this mismatch, including perfusion rates, vascularity, vascular permeability, interstitial pressure and mAb plasma half-life [17]. Circulating HER2 extracellular domain (ECD) and trastuzumab are known to form complexes, which are swiftly cleared by the liver [18]. Underscoring the possibility of shed ECD to significantly influence kinetics of antibodies, shed HER2 serum levels over 500 ng/mL extensively influenced trastuzumab kinetics in patients at weekly doses of 100 mg trastuzumab [19]. For EGFR and EGFR-targeting mAbs this relation is less clear. However, some studies show extensive levels of circulating soluble EGFR extracellular domain (sEGFR) in patients and healthy volunteers [20]. sEGFR might therefore also influence kinetics and tumor uptake of tracer doses used for 89Zr-labeled EGFR targeting antibodies.
In order to optimize EGFR imaging and visualize EGFR expression in vivo we developed the EGFR PET tracer 89Zr-imgatuzumab and examined the influence of sEGFR on 89Zr-imgatuzumab tracer kinetics and tumor uptake in multiple xenograft models using microPET imaging.
RESULTS
89Zr-imgatuzumab tracer development and quality control
Df-imgatuzumab conjugate bound up to 500 MBq 89Zr/mg Df-imgatuzumab at a radiochemical purity (RCP) ≥ 95% after radiolabeling, without further purification (Supplementary Figure S1A). SE-HPLC revealed absence of aggregates and fragments in Df-imgatuzumab conjugates. The immunoreactive fraction of Df-imgatuzumab conjugate was assessed by competition assay at 68.9 ± 6.3% compared to unmodified imgatuzumab (Supplementary Figure S1B). 89Zr-imgatuzumab was stable in vitro, the maximum observed decrease in RCP was from 99.4 ± 0.1% to 93.4 ± 0.8% in 0.5 M HEPES buffer pH 7.2 after 14 days at 37°C (Supplementary Figure S1C). All batches of 89Zr-imgatuzumab used as tracer had a RCP ≥ 95% by TCA precipitation, while 111In-IgG batches had a RCP ≥ 90% by ITLC.
MicroPET imaging and biodistribution in different tumor models
MicroPET analysis showed preferential tumor uptake of 89Zr-imgatuzumab in A431, A549 and H441 xenografts models (Figure 1A). For A549 and H441, the highest 89Zr-imgatuzumab tumor uptake was observed for the 10 μg dose 6 days pi (Figure 1B), while higher doses lowered tumor uptake. An opposite pattern was observed in A431 tumors, where 89Zr-imgatuzumab tumor uptake increased with increasing tracer dose (Figure 1B). Blood levels of 89Zr-imgatuzumab were highest for the 160 μg tracer dose at day 1 pi for all tested models and decreased gradually over time (Figure 1B). 89Zr-imgatuzumab blood levels were significantly lower in A431 tumor bearing mice compared to both A549 and H441 at 10 μg and 25 μg (P < 0.001) and at 160 μg (A549: P < 0.01, H441: P < 0.05). High liver accumulation was observed in A431 compared to both A549 and H441 tumor bearing mice at 10 μg (P < 0.001) and at 25 μg (P < 0.01), but not in the 160 μg tracer dose group (Figure 1A, 1B).
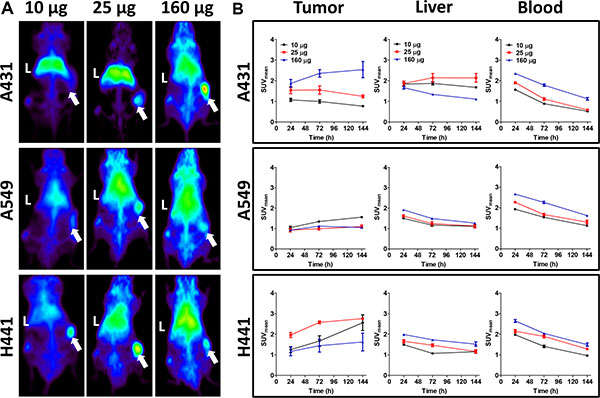
Figure 1: (A) Representative maximal intensity projections of microPET scans 144 h after tracer injection for 10, 25 and 160 μg doses of 89Zr-imgatuzumab in A431, A549 and H441 xenograft bearing mice. Livers are marked with L, while xenografts are marked with an arrow. (B) MicroPET quantification for tumor, liver and blood pool at 24, 72 and 144 h after tracer injection for 10, 25 and 160 μg tracer dose in A431, A549 and H441 xenograft bearing mice. Data are expressed as SUVmean ± SEM.
Biodistribution studies showed that 89Zr-imgatuzumab uptake in A431 tumors was not different from 111In-IgG uptake in the 10 μg dose group (8.4 ± 1.0 vs. 7.7 ± 0.7%ID/g, P = 0.50), but after increasing the dose to 25, 100 and 160 μg, significant tumor uptake was observed. Highest A431 tumor uptake was observed at 160 μg tracer dose, with 29.8 ± 5.4 %ID/g for 89Zr-imgatuzumab, compared to 9.8 ± 1.1 %ID/g for 111In-IgG uptake (P < 0.05) (Figure 2). Tumor-to-blood ratios of all tracer doses in A431 tumor bearing mice were consistently higher for 89Zr-imgatuzumab compared to 111In-IgG, revealing absolute tracer uptake in A431 tumors was limited by blood pool availability of 89Zr-imgatuzumab (Figure 3). Tracer uptake in A549 in tumors was the highest for the 10 μg dose group at 12.2 ± 2.1%ID/g for 89Zr-imgatuzumab vs. 7.2 ± 1.5 %ID/g for 111In-IgG (P = 0.13), while tumor-to-blood values for 10 and 25 μg were significantly higher for 89Zr-imgatuzumab compared to 111In-IgG. The highest specific tumor uptake in H441 tumors was observed with 10 μg 89Zr-imgatuzumab (28.0 ± 1.6%ID/g) compared to 111In-IgG (9.8 ± 1.6%ID/g, P < 0.01), whereas at 160 μg 89Zr-imgatuzumab tumor uptake (14.2 ± 1.7%ID/g) was similar to 111In-IgG (19.2 ± 5.0%ID/g, Figure 2). Both A549 and H441 tumors showed target saturation at the 160 μg dose (Figures 2, 3). Tumor-to-blood ratios for both A549 and H441 showed a similar pattern to absolute uptake data, denoting uptake of 89Zr-imgatuzumab in these tumors was not limited by blood pool availability (Figure 3).
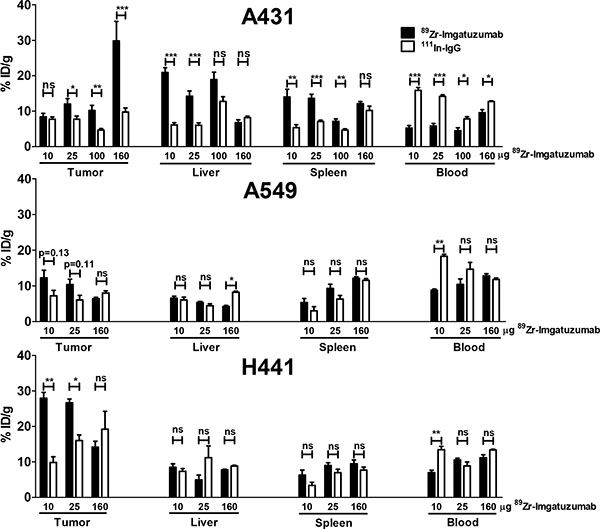
Figure 2: Ex vivo uptake data for tumor, liver, spleen and blood, presented as % ID/g 89Zr-imgatuzumab and 111In-IgG non-specific control, for 10, 25 and 160 μg doses in A431, A549 and H441 xenograft bearing mice.
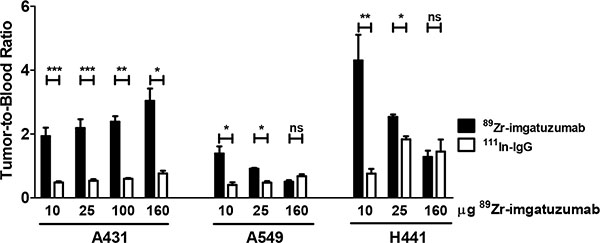
Figure 3: Tumor-to-blood ratios of 89Zr-imgatuzumab and 111In-IgG for indicated doses in A431, A549 and H441 xenograft bearing mice.
High liver uptake of 20.9 ± 1.3%ID/g was observed in mice bearing A431 tumors at 10 μg 89Zr-imgatuzumab, this was higher than for A549 (6.5 ± 0.5%ID/g, P < 0.0001) and H441 (8.5 ± 1.0%ID/g, P < 0.001) bearing mice at equal dose. Liver uptake in A431 bearing mice could be blocked by increasing the tracer antibody dose, as can be seen by the decreasing differences between 89Zr-imgatuzumab and 111In-IgG liver uptake (Figure 2). Specific spleen uptake of 89Zr-imgatuzumab was observed in all tumor models, which was saturable at higher doses, as shown by decreasing differences between 89Zr-imgatuzumab and 111In-IgG spleen uptake at higher tracer doses (Figure 2).
EGFR expression analysis and immunohistochemistry
EGFR cell surface expressions in vitro by flow cytometric analysis (Figure 4B) and ex vivo by ELISA in tumor lysates (Figure 4C) were concordant. Expression level of EGFR per gram protein based upon ELISA was highest in A431, followed in declining order by A549 and H441 xenografts. All xenograft tumors expressed EGFR as determined by IHC (Figure 4A). Highest EGFR H-score was found in A431, followed by H441 and the least amount of staining was found in A549 xenografts (Figure 4A and 4D). A549 tumor cell density was markedly lower compared with A431 and H441 tumors (Figure 4A). Microvascular density was found to be similar in all three xenograft models (Figure 4E).
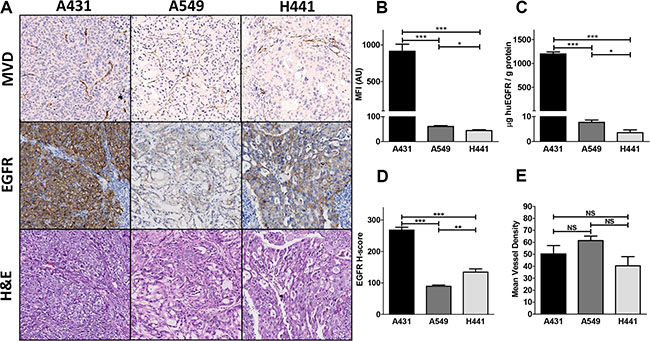
Figure 4: (A) Ex vivo tissue analysis. Mean vessel density (MVD), EGFR and hematoxylin and eosin immunohistochemical staining of A431, A549 and H441 tumors. (B) In vitro flow cytometric analysis of EGFR membrane expression in A431, A549 and H441 cells. (C) Ex vivo human EGFR extracellular domain levels in A431, A549 and H441 tumor tissue lysates. (D) EGFR histo-score (H-score) for A431, A549 and H441 tumors. (E) Mean vessel density score for A431, A549 and H441 tumors.
sEGFR analysis of plasma, liver and cell lysates
ELISA showed high sEGFR levels (831 ± 71 ng/mL) in plasma of A431 tumor bearing, which were three magnitudes higher than observed in A549, H441 and non-tumor bearing control mice (P < 0.01). A549 and H441 sEGFR plasma levels did not deviate from background measurement in plasma of non-tumor bearing control mice (Figure 5A). sEGFR levels were also elevated at 790 ± 109 ng/g protein sEGFR in liver lysates of A431 xenograft bearing mice (P < 0.01), but not in A549 and H441 when compared to non-tumor bearing control mice (Figure 5B). To confirm the shedding potential of A431 in vitro, confluent cell cultures serum-free supernates were tested for sEGFR. sEGFR levels in A431 supernates (999 ± 21 ng/ml) were approximately 1000-fold higher (P < 0.001) compared to A549 and H441 (0.06 ± 0.004, respectively 0.87 ± 0.03 ng/ml) (Figure 5C). sEGFR in supernates from serum-containing media cultures showed a similar pattern and equal magnitude, indicating inhibition of proteolytical cleavage by serum did not influence the amount of sEGFR shedding in these cell lines (Figure 5D). Serum-free and serum-containing media controls were negative for sEGFR.
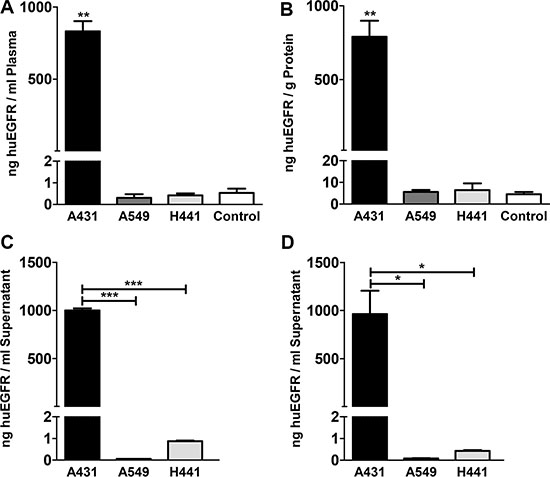
Figure 5: (A) Human EGFR extracellular domain concentration in plasma of A431, A549 and H441 xenograft bearing and non-tumor bearing control mice. (B) Human EGFR extracellular domain level in liver tissue lysates of A431, A549 and H441 xenograft bearing and non-tumor bearing control mice. (C) Human EGFR extracellular domain concentration in serum-free supernates of confluent cell cultures of A431, A549 and H441 cells. (D) Human EGFR extracellular domain concentration in serum-containing supernates of confluent cell cultures of A431, A549 and H441 cells, only statistical significances against A431 are shown for clarity.
DISCUSSION
This is the first paper showing tumor uptake of an EGFR-targeted antibody tracer can be affected by EGFR shedding. High levels of sEGFR acted as antigen sink, redirecting 89Zr-imgatuzumab to the liver, which reduced tumor uptake at lower tracer doses in A431 xenografts. Contrarily, in A549 and H441 xenografts models, lacking detectable EGFR shedding, low liver uptake was observed and tumor uptake could be saturated by 89Zr-imgatuzumab dose increments.
A431 xenografts showed the highest tumor uptake at the highest tracer dose used. Specific liver uptake of 89Zr-imgatuzumab was observed, which decreased with dose increments in A431 bearing mice. In previous preclinical EGFR antibody-based imaging studies revealing mismatch between xenograft EGFR expression and tracer uptake, a large role was postulated for vascularity and vascular permeability for tracer delivery in the tumor [13, 17]. Our results show that in addition to vascular differences between xenografts, circulating sEGFR can act as antigen sink and decrease tumor tracer uptake. Complexation of 89Zr-imgatuzumab and sEGFR, followed by liver sequestration as shown by ELISA, resulted in high 89Zr-imgatuzumab liver uptake, low blood pool availability and consequently relatively low uptake in A431 xenograft tumors at low tracer protein doses.
In contrast, in A549 and H441 xenografts low 89Zr-imgatuzumab liver uptake and sEGFR plasma levels were observed. In these models 89Zr-imgatuzumab tumor uptake was dose dependent, with highest uptake observed for low tracer protein doses, comparable to earlier findings for various antibody-based tracers targeting HER family members [8, 10, 15]. Higher 89Zr-imgatuzumab tumor uptake was found in H441 compared to A549 xenografts in our study, despite lower in vitro and ex vivo EGFR expression based upon ELISA. No difference in microvascular density was found between all models. Therefore, differences in 89Zr-imgatuzumab uptake in A549 and H441 are most likely explained by the lower EGFR expression based upon EGFR histoscore, combined with lower tumor cell density on H&E in A549. Furthermore, vascular permeability in the H441 is higher, as shown by the high accumulation of 111In-IgG control at higher doses, which was also seen in an earlier study [10]. Specific spleen uptake of 89Zr-imgatuzumab was observed in all tumor models, which decreased with 89Zr-imgatuzumab dose increments. Spleen targeting of 89Zr-imgatuzumab can be explained by its affinity, through glycoengineering, for the murine analog of the FcyRIIIA receptor, FcγRIV, on macrophages and monocytes [5] and resembles our experience with similarly glycoengineered HER3 mAb 89Zr-RG7116 [10].
Several isoforms of circulating sEGFR have been found in ovarian, metastatic breast and non-small cell lung cancer patients and healthy volunteers [21–24]. All sEGFR isoforms contain subdomain III of the EGFR extracellular domain, to which EGFR mAbs imgatuzumab, cetuximab and panitumumab bind [25, 26], but lack the transmembrane and cytoplasmic domains of the EGFR receptor [21, 22]. While cetuximab is known to inhibit sEGFR shedding in vitro (27), it is currently unknown whether imgatuzumab has potential to inhibit sEGFR shedding. sEGFR is commonly shed by proteolytic cleavage from human carcinoma cells expressing over 7 × 10⁵ EGFR receptors [27]. Of the present cell panel, only A431 is known to shed a ~105 kDa sEGFR isoform, due to an aberrant transcript, as well as a 110 kDa sEGFR isoform [29–31]. Because of its aberrant sEGFR shedding potential, the A431 cell line was used to reliable induce human sEGFR shedding in a murine system and served as a model for the interaction between the endogenous sEGFR isoforms and EGFR monoclonal antibody tracers. Besides proteolytic cleavage, alternate splicing events in normal tissues result in mRNA transcripts encoding for 60-kDa, 80-kDa and 110-kDa sEGFR isoforms, that are the major source of sEGFR in patients and healthy volunteers [22].
sEGFR levels in A431 tumor-bearing mice were 837 ± 71 ng/mL plasma, corresponding to ~2.5 sEGFR for each 89Zr-imgatuzumab molecule in circulation for the 10 μg tracer dose, reflecting a high degree of competition of sEGFR with tumor-bound EGFR. Increasing the 89Zr-imgatuzumab dose to 160 μg, mitigated sEGFR competition for tumor bound EGFR, resulting in higher tumor uptake. A limited number of preclinical imaging studies have included shed or circulating antigen measurements. c-MET tracer 89Zr-onartuzumab kinetics were not influenced by 14.1 ± 5.2 ng/mL per gram tumor shed c-MET in MKN-45 xenografts at high tracer doses of 64 to 128 μg [31]. However, similar to our results, high CA19.9 mAb 89Zr-5B1 liver uptake and decreasing tumor uptake over time was observed for in Colo205-Luc xenografts secreting large amounts CA19.9 (2500 ± 1033 U/mL), but not in DMS79 and BcPC3 xenograft bearing mice with no detectable serum CA19.9 [32]. Free prostate specific antigen (PSA) targeting 89Zr-5A10 showed a similar principle, liver uptake was 24.6 ± 4.9%ID/g for 89Zr-5A10 in LNCaP-AR xenograft bearing mice in presence of 18.35 ± 2.7 ng/mL free PSA in serum. Liver uptake was 2.5 fold lower for both 89Zr-5A10 in PSA-negative PC3 tumor bearing mice and 89Zr-IgG control in LNCaP-AR tumor bearing mice [33], confirming the ability of circulating antigen to direct antibody tracers to the liver.
In transgenic mice developing mutant and KRAS mutated NSCLC, murine endogenous plasma sEGFR and EGFR liver expression decreased after carcinogenesis [33]. Lower concentrations circulating sEGFR were also found in humans with NSCLC, when compared to healthy controls [22]. However, reported clinical sEGFR serum concentrations vary greatly depending on detection method and between patients and matched control groups [23]. sEGFR concentrations in cancer patients ranged between 25.5 ± 4.5 (19.4–40.1) in NSCLC vs. 35.9 ± 5.2 (20.6–44.2) ng/mL in controls based upon a commercial ELISA kit (22), to 545 ± 503 (ND-2139) in metastatic breast cancer vs. 546 ± 706 ng/mL (12–3461) in matched controls based upon an acridinium-linked immunosorbent assay (ALISA) assay [24]. In healthy volunteers sEGFR serum concentrations ranged between 0.0125 and 5 μg/mL based upon ALISA [23], corresponding to a 140,000-fold or only 5-fold molar excess of cetuximab at peak and through concentrations compared to sEGFR [30]. In one patient with ovarium cancer up to 9.1 μg/mL sEGFR was measured [20]. It is therefore conceivable that EGFR targeting tracer kinetics could be influenced in a subset of patients with high sEGFR levels. This might be especially true when patient are treatment-naïve, considering many immunoPET agents use microdosing. If patients received multiple doses of EGFR antibody prior to tracer injection, sEGFR could already have been depleted and the sEGFR effect will most likely not be seen.
Strikingly, high liver uptake and rapid blood clearance was shown for 89Zr-cetuximab PET in a recent clinical study [17, [37]. 89Zr-cetuximab liver radiation burden in patients was up to two-fold higher [34] compared to antibody-based tracers anti-CD20 89Zr-ibritumumab tiuxetan [35] and anti-CD44v6 89Zr-cmAb U36 [36]. Liver uptake of up to 40 mg was also seen for murine cetuximab analog 111In-mAb225 in patients, while dose escalation up to 300 mg increased blood availability and tumor uptake of 111In-mAb225. [37]. Both mouse and human liver tissues are known to express EGFR [38], although liver uptake in the present study cannot be explained by presence of murine EGFR in liver, as imgatuzumab is not cross-reactive [5]. Our findings suggest that in addition to hepatic EGFR expression, part of the liver accumulation of EGFR antibody tracers in humans might be explained by sEGFR-tracer complexation and subsequent liver sequestration. This would suggest incorporating sEGFR analyses in preclinical and clinical EGFR imaging studies to assess the influence of sEGFR on EGFR tracer kinetics.
Concluding, 89Zr-imgatuzumab accumulates in and visualizes EGFR-expressing tumors. High shed sEGFR levels in blood can reduce 89Zr-imgatuzumab blood pool availability and lower tumor uptake, due to redirection of tracer-sEGFR complex to the liver. Higher tracer protein dose increased 89Zr-imgatuzumab tumor uptake by saturating sEGFR-mediated liver uptake. Combined, these findings could improve interpretation of (pre)clinical EGFR imaging by taking sEGFR levels into account. Furthermore, this phenomenon could possibly also apply to imaging of other antigens with soluble isoforms or which are heavily shed.
MATERIALS AND METHODS
Cell Lines
Human cancer cell lines with varying levels of EGFR expression were used. The NSCLC cell lines H441 and A549 and the epidermoid carcinoma cell line A431 were obtained from the American Type Culture Collection (ATCC, Manassas, VA, USA). Cells were quarantined until screening for microbial contamination and mycoplasm was performed and proven to be negative. Cells were tested and authenticated in April 2015 by Baseclear (Leiden, The Netherlands) using STR profiling. Cells were subcultured twice weekly, using Roswell Park Memorial Institute-1640 (RPMI-1640, Gibco, Paisley, UK)/2 mM L-glutamine (Gibco) supplemented with 10% fetal calf serum (FCS, Bodinco, Alkmaar, The Netherlands) for H441, RPMI-1640, with 10% FCS for A549 and high glucose Dulbecco’s Modified Eagle’s Medium (DMEM, Gibco) with 10% FCS for A431. All cell lines were cultured in a fully humidified atmosphere at 37°C and 5% pCO2. Flow cytometric analysis was performed on a BD Accuri™ C6 flow cytometer (BD Biosciences, Breda, The Netherlands) to assess EGFR protein expression status using imgatuzumab (25.3 mg/mL, Roche Glycart AG, Schlieren, Switzerland) as primary antibody and mouse anti-human Fc-specific FITC conjugated secondary antibody (clone HP-6017, Sigma-Aldrich, Zwijndrecht, The Netherlands).
89Zr-imgatuzumab tracer development and quality control
Imgatuzumab was incubated with a 5-fold molar excess of TFP-N-Suc-desferal-Fe (Df, ABX GmbH, Hamburg, Germany) and subsequent 89Zr-labeling was performed as described earlier [8], using clinical grade 89Zr (Perkin Elmer, Groningen, The Netherlands). Maximal attainable specific activity was determined using varying amounts of 89Zr per mg antibody between 50 and 1000 MBq/mg. Radiochemical purity (RCP) was assessed by trichloroacetic acid (TCA) precipitation test [39]. Df-imgatuzumab conjugates were checked for aggregation and fragmentation by size exclusion high performance liquid chromatography (SE-HPLC). The Waters SE-HPLC system was equipped with a dual wavelength absorbance detector, in-line radioactivity detector and TSK-GEL G3000SWXL column (JSB, Eindhoven, The Netherlands). Phosphate buffered saline (PBS; 140 mmol/l NaCl, 9 mmol/l Na2HPO4, 1.3 mmol/L NaH2PO4; pH = 7.4) was used as mobile phase. Stability of 89Zr-imgatuzumab was tested for 2 weeks in 0.9% NaCl at 4°C, human serum at 37°C and 0.5 M HEPES pH 7.2 buffer at 37°C.
Immunoreactive fraction of Df-imgatuzumab conjugates was assessed by competition assay. In short, NUNC BreakApart 96-well plates were coated overnight at 4°C with 100 μL 100 ng/mL EGFR ECD (Roche Glycart AG) in 0.1 M Na2CO3 buffer pH 9.6. 89Zr-imgatuzumab was diluted to 4000 ng/mL in assay diluent which consisted out of PBS, 0.5% bovine serum albumin Fraction V and 0.05% Tween 20. Plates were washed with washing buffer (PBS with 0.05% Tween 20) and blocked by 200 μL assay diluent for 1 h at room temperature (RT) and washed again. 0.004 to 156.25-fold molar excess unmodified imgatuzumab was pre-mixed 1:1 with diluted 89Zr-imgatuzumab solution and 100 μL of the mixtures were incubated in wells for 1 hour at RT. After washing, wells were broken apart and counted using a calibrated well-type LKB-1282-Compu-gamma system (LKB WALLAC). Counts were plotted against concentration competing unmodified imgatuzumab and the half maximal inhibitory concentration (IC50) was calculated using Graphpad 5.0 (GraphPad Software, Inc., La Jolla, CA, USA). The IC50-value was divided by the final tracer concentration (2000 ng/mL) to yield the immunoreactive fraction.
Indium-111 labeling IgG control
Human IgG (Nanogam®, Sanquin, Amsterdam, The Netherlands) was used as aspecific control. IgG was conjugated with p-SCN-Bn-DTPA (Macrocyclics, Dallas, TX, USA) as described earlier [40]. Radiolabeling was performed using indium-111 (111In) chloride (Mallinckrodt, Prague, Czech Republic).
Radiochemical purity of 111In-IgG labeling was checked by instant thin layer chromatography (ITLC) using 0.1 M citrate buffer pH 6.0 as eluent.
Animal studies
Male nude mice (BALB/cOlaHsd-Foxn1nu, Harlan, Boxmeer, The Netherlands) were inoculated with A431, H441 (both 5*106 cells in 200 μL PBS) or A549 (3*106 in 300 μL 1:1 PBS and high growth factor Matrigel (BD Biosciences, Breda, The Netherlands) subcutaneously (sc). Xenografts were allowed to grow to at least 100–200 mm3. For microPET imaging, A431, A549 and H441 xenograft-bearing mice (n = 3–6 per group) were injected intravenously (iv) via the penile vein with ~10, 25 and 160 μg 89Zr-imgatuzumab (effective injected protein doses were 9.6 ± 0.08, 23.8 ± 0.11 and 151.2 ± 1.1 μg, labeled with 4.60 ± 0.06, 3.99 ± 0.13 and 5.64 ± 0.11 MBq 89Zr respectively for the 10, 25 and 160 μg dose groups). MicroPET scans were made 1, 3 and 6 days post injection (pi) using a Focus 220 PET scanner (CTI Siemens), followed by ex vivo biodistribution analysis after the final scan. Some A431 bearing mice received ~10, 25 or 100 μg 89Zr-imgatuzumab (effective injected protein doses were 9.5 ± 0.05, 23.3 ± 0.26 and 86.0 ± 4.0, labeled with 1.11 ± 0.03, 0.99 ± 0.06 and 0.91 ± 0.09 MBq 89Zr respectively for the 10, 25 and 100 μg dose groups) only for ex vivo biodistribution analysis 6 days pi. Ex vivo results of biodistribution-only A431 tumor bearing mice were pooled with mice used for the microPET imaging study, A431 tumor bearing group size was therefore 6 to 12 animals. All mice received an equal amount of 111In-IgG control (1 MBq) as aspecific control. For all tracer injections 10 μg 89Zr-imgatuzumab and an equal amount of 111In-IgG was used, with cold imgatuzumab and IgG added to reach the total stated protein doses.
Scans were reconstructed and in vivo quantification was performed using AMIDE (v1.0.4, Stanford University, Stanford, CA, USA) [41]. MicroPET data are presented as mean standardized uptake value (SUVmean). Region of interests (ROI) were drawn for tumor based upon ex vivo weight, assuming 1 g/ml tissue density. For blood pool measurements, a fixed-sized sphere was drawn in the center of the heart, for liver and spleen a fixed-sized ellipsoid ROI was drawn in representative parts of the organs. After the final scan, mice were sacrificed and organs of interest collected for biodistribution studies. Organs and standards of the injected tracer were counted in a calibrated well type LKB-1282-Compu-gamma system (LKB WALLAC) and weighed. After decay correction, ex vivo tissue activity was expressed as the percentage of injected dose per gram tissue (%ID/g). Xenograft tumors were partly formalin-fixed and paraffin embedded for immunohistochemistry (IHC) and partly frozen for subsequent sEGFR ELISA analysis. Plasma of xenograft and non-xenograft bearing (control) mice was used for sEGFR ELISA analysis, based upon shed c-MET analysis by Jagoda et al. [31]. Plasma was obtained by heart puncture and subsequent centrifugation of blood in lithium heparin blood collection tubes (BD Vacutainer, Plymouth, UK). All animal experiments were approved by the Institutional Animal Care and Use Committee of the University of Groningen.
sEGFR ELISA analysis
Near-confluent A431, A549 and H441 cell cultures were washed with PBS and incubated for 72 h in fetal calf serum free growth media, as well as serum-containing growth media, as described earlier [26], after which supernates were removed and centrifuged to remove cell debris. Cells of confluent cell cultures were washed with PBS and harvested using trypsin. Lysates of cells, xenograft tumors and liver tissue of A431, A549 and H441 xenograft bearing mice were obtained by mechanical disruption in M-PER Mammalian Protein Extraction Reagent (Thermo Scientific, Bleiswijk, The Netherlands) supplemented with EDTA-free protease/phosphatase inhibitor cocktail (Thermo Scientific). Protein concentrations of cell, tumor and liver lysates were determined by Bradford assay [42]. sEGFR was detected using a human extracellular domain EGFR ELISA (SEK10001, Sino Biological, Beijing, China), according to manufacturer’s instructions.
Immunohistochemistry
Formalin fixed, paraffin-embedded tissue slices were stained for EGFR with a rabbit mAb (clone D38B1 XP®, Cell Signaling Technology, Leiden, The Netherlands) and for microvessel density using a rat anti-murine CD31 mAb (clone SZ31, Dianova GmbH, Hamburg, Germany). Hematoxylin & eosin (H&E) staining was performed regularly to assess tissue viability and morphology. Digital scans of slides were acquired by a NanoZoomer 2.0-HT multi slide scanner (Hamamatsu) and analyzed with NanoZoomer Digital Pathology viewer software. A 0–300 EGFR staining histo-score was assessed as follows no staining 0+, weak cytoplasmic staining 1+, strong cytoplasmic staining 2+ and strong membrane and cytoplasmic staining 3+, with H-score calculated using the formula 1 × (% of 1 + cells) + 2 × (% of 2 + cells) + 3 × (% of 3 + cells). Microvessel density was scored in 3 areas, defined as hot spot areas with the maximum number of microvessels as described earlier [39].
Statistical analysis
Data are presented as mean ± SEM. Statistical analyses were performed using the Mann-Whitney test (Graphpad 5.0) or One-way ANOVA with a Bonferroni post test for multiple comparisons. P-values ≤ 0.05 were considered significant.
ACKNOWLEDGMENTS
The authors thank Joost J. van Raaij and Danique Giesen for their technical assistance.
CONFLICTS OF INTEREST
Christian A. Gerdes is an employee of Roche.
GRANT SUPPORT
This work was partly funded by the Roche Innovation Fund and European Research Council (ERC) grant OnQview.
REFERENCES
1. Mendelsohn J, Baselga J. Epidermal growth factor receptor targeting in cancer. Semin Oncol. 2006; 33:369–385.
2. Arteaga CL, Engelman JA. ERBB receptors: From oncogene discovery to basic science to mechanism-based cancer therapeutics. Cancer Cell. 2014; 25:282–303.
3. Lièvre A, Bachet JB, Le Corre D, Boige V, Landi B, Emile JF, Cote JF, Tomasic G, Christophe P, Ducreux P, Rougier P, Penault-Llorca F, Laurent-Puig P. KRAS mutation status is predictive of response to cetuximab therapy in colorectal cancer. Cancer Res. 2006; 66:3992–3995.
4. Pao W, Wang TY, Riely GJ, Miller VA, Pan Q, Ladanyi M, Zakowski MF, Heelan RT, Kris MG, Varmus HE. KRAS mutations and primary resistance of lung adenocarcinomas to gefitinib or erlotinib. PLoS Med. 2005; 2:57–61.
5. Gerdes CA, Nicolini VG, Herter S, van Puijenbroek E, Lang S, Roemmele M, Moessner E, Freytag O, Friess T, Ries CH, Bossenmaier B, Mueller HJ, Umana P. GA201 (RG7160): a novel, humanized, glycoengineered anti-EGFR antibody with enhanced ADCC and superior in vivo efficacy compared with cetuximab. Clin Cancer Res. 2013; 19:1126–1138.
6. Paz-Ares LG, Gomez-Roca C, Delord J-P, Cervantes A, Markman B, Corral J, Soria JC, Berge Y, Roda D, Russel-Yarde F, Hollingsworth S, Baselga J, Umana P, et al. Phase I pharmacokinetic and pharmacodynamic dose-escalation study of RG7160 (GA201), the first glycoengineered monoclonal antibody against the epidermal growth factor receptor, in patients with advanced solid tumors. J Clin Oncol. 2011; 29:3783–3790.
7. Delord JP, Tabernero J, García-Carbonero R, Cervantes A, Gomez-Roca C, Bergé Y, Capdevila J, Paz-Ares L, Roda D, Delmar P, Oppenheim D, Soehrman Brossard S, Farzaneh F, et al. Open-label, multicentre expansion cohort to evaluate imgatuzumab in pre-treated patients with KRAS-mutant advanced colorectal carcinoma. Eur J Cancer. 2014; 50:496–505.
8. Dijkers ECF, Kosterink JGW, Rademaker AP, Perk LR, van Dongen GAMS, Bart J, de Jong JR, de Vries EGE, Lub-de Hooge MN. Development and characterization of clinical-grade 89Zr-trastuzumab for HER2/neu immunoPET imaging. J Nucl Med. 2009; 50:974–981.
9. Dijkers EC, Oude Munnink TH, Kosterink JG, Brouwers AH, Jager PL, de Jong JR, van Dongen GA, Schroder CP, Lub-de Hooge MN, de Vries EGE. Biodistribution of 89Zr-trastuzumab and PET imaging of HER2-positive lesions in patients with metastatic breast cancer. Clin Pharmacol Ther. 2010; 87:586–592.
10. Terwisscha van Scheltinga AGT, Lub-de Hooge MN, Abiraj K, Schröder CP, Pot L, Bossenmaier B, Thomas M, Hölzlwimmer G, Friess T, Kosterink JGW, de Vries EGE. ImmunoPET and biodistribution with human epidermal growth factor receptor 3 targeting antibody 89Zr-RG7116. MAbs. 2014; 6:1051–1058.
11. Nagengast WB, de Korte MA, Oude Munnink TH, Timmer-Bosscha H, den Dunnen WF, Hollema H, de Jong JR, Jensen MR, Quadt C, Garcia-Echeverria C, van Dongen GA, Lub-de Hooge MN, Schröder CP, et al. 89Zr-bevacizumab PET of early antiangiogenic tumor response to treatment with HSP90 inhibitor NVP-AUY922. J Nucl Med. 2010; 51:761–767.
12. Gaykema SBM, Schröder CP, Vitfell-Rasmussen J, Chua S, Oude Munnink TH, Brouwers AH, Bongaerts AH, Akimov M, Fernandez-Ibarra C, Lub-de Hooge MN, de Vries EGE, Swanton C, Banerji U. 89Zr-trastuzumab and 89Zr-bevacizumab PET to evaluate the effect of the HSP90 inhibitor NVP-AUY922 in metastatic breast cancer patients. Clin Cancer Res. 2014; 20:3945–3954.
13. Aerts HJWL, Dubois L, Perk L, Vermaelen P, van Dongen GAMS, Wouters BG, Lambin P. Disparity between in vivo EGFR expression and 89Zr-labeled cetuximab uptake assessed with PET. J Nucl Med. 2009; 50:123–131.
14. Cai W, Chen K, He L, Cao Q, Koong A, Chen X. Quantitative PET of EGFR expression in xenograft-bearing mice using 64Cu-labeled cetuximab, a chimeric anti-EGFR monoclonal antibody. Eur J Nucl Med Mol Imaging. 2007; 34:850–858.
15. Hoeben BAW, Molkenboer-Kuenen JDM, Oyen WJG, Peeters WJM, Kaanders JHAM, Bussink J, Boerman OC. Radiolabeled cetuximab:dose optimization for epidermal growth factor receptor imaging in a head-and-neck squamous cell carcinoma model. Int J Cancer. 2011; 129:870–878.
16. Makris NE, Boellaard R, van Lingen A, Lammertsma A, van Dongen GAMS, Verheul HM, Menke CW, Huisman MC. PET/CT-Derived Whole-Body and Bone Marrow Dosimetry of 89Zr-Cetuximab. J Nucl Med. 2015; 56:249–254.
17. Menke-van der Houven van Oordt CA, Gootjes EC, Huisman MC, Vugts DJ, Roth C, Luik AM, Mulder ER, Schuit RC, Boellaard R, Hoekstra OS, van Dongen GA, Verheul HM. 89Zr-cetuximab PET imaging in patients with advanced colorectal cancer. Oncotarget. 2015; 6:30384–30394. doi: 10.18632/oncotarget.4672.
18. Niu G, Sun X, Cao Q, Courter D, Koong A, Le QT, Gambhir SS, Chen X. Cetuximab-based immunotherapy and radioimmunotherapy of head and neck squamous cell carcinoma. Clin Cancer Res. 2010; 16:2095–2105.
19. Bruno R, Washington CB, Lu JF, Lieberman G, Banken L, Klein P. Population pharmacokinetics of trastuzumab in patients with HER2+ metastatic breast cancer. Cancer Chemother Pharmacol. 2005; 56:361–369.
20. Baselga J, Tripathy D, Mendelsohn J, Baughman S, Benz CC, Dantis L, Sklarin NT, Seidman AD, Hudis CA, Moore J, Rosen PP, Twaddell T, Henderson IC, et al. Phase II study of weekly intravenous recombinant humanized anti-p185HER2 monoclonal antibody in patients with HER2/neu-overexpressing metastatic breast cancer. J Clin Oncol. 1996; 14:737–744.
21. Baron AT, Cora EM, Lafky JM, Boardman CH, Buenafe MC, Rademaker A, Liu D, Fishman DA, Podratz KC, Maihle NJ. Soluble epidermal growth factor receptor (sEGFR/sErbB1) as a potential risk, screening, and diagnostic serum biomarker of epithelial ovarian cancer. Cancer Epidemiol Biomarkers Prev. 2003; 12:103–113.
22. Lemos-González Y, Rodríguez-Berrocal FJ, Cordero OJ, Gómez C, Páez de la Cadena M. Alteration of the serum levels of the epidermal growth factor receptor and its ligands in patients with non-small cell lung cancer and head and neck carcinoma. Br J Cancer. 2007; 96:1569–1578.
23. Lafky JM, Wilken JA, Baron AT, Maihle NJ. Clinical implications of the ErbB/epidermal growth factor (EGF) receptor family and its ligands in ovarian cancer. Biochim Biophys Acta. 2008; 1785:232–265.
24. Baron AT, Lafky JM, Suman VJ, Hillman DW, Buenafe MC, Boardman CH, Podratz KC, Perez EA, Maihle NJ. A preliminary study of serum concentrations of soluble epidermal growth factor receptor (sErbB1), gonadotropins, and steroid hormones in healthy men and women. Cancer Epidemiol Biomarkers Prev. 2001; 10:1175–1185.
25. Lafky JM, Baron AT, Cora EM, Hillman DW, Suman VJ, Perez EA, Ingle JN, Maihle NJ. Serum soluble epidermal growth factor receptor concentrations decrease in postmenopausal metastatic breast cancer patients treated with letrozole. Cancer Res. 2005; 65:3059–3062.
26. Baron AT, Huntley BK, Lafky JM, Reiter JL, Liebenow J, McCormick DJ, Ziesmer SC, Roche PC, Maihle NJ. Monoclonal antibodies specific for peptide epitopes of the epidermal growth factor receptor’s extracellular domain. Hybridoma. 1997; 16:259–271.
27. Wilken JA, Perez-Torres M, Nieves-Alicea R, Cora EM, Christensen TA, Baron AT, Maihle NJ. Shedding of soluble epidermal growth factor receptor (sEGFR) is mediated by a metalloprotease/fibronectin/integrin axis and inhibited by cetuximab. Biochemistry. 2013; 52:4531–4540.
28. Perez-Torres M, Valle BL, Maihle NJ, Negron-Vega L, Nieves-Alicea R, Cora EM. Shedding of epidermal growth factor receptor is a regulated process that occurs with overexpression in malignant cells. Exp Cell Res. 2008; 314:2907–2918.
29. Weber W, Gill GN, Spiess J. Production of an epidermal growth factor receptor-related protein. Science. 1984; 224:294–297.
30. Zhen Y, Caprioli RM, Staros JV. Characterization of glycosylation sites of the epidermal growth factor receptor. Biochemistry. 2003; 42:5478–5492.
31. Reiter JL, Threadgill DW, Eley GD, Strunk KE, Danielsen AJ, Sinclair CS, Pearsall RS, Green PJ, Yee D, Lampland AL, Balasubramaniam S, Crossley TD, Magnuson TR, et al. Comparative genomic sequence analysis and isolation of human and mouse alternative EGFR transcripts encoding truncated receptor isoforms. Genomics. 2001; 71:1–20.
32. Jagoda EM, Lang L, Bhadrasetty V, Histed S, Williams M, Kramer-Marek G, Mena E, Rosenblum L, Marik J, Tinianow JN, Merchant M, Szajek L, Paik C, et al. Immuno-PET of the hepatocyte growth factor receptor Met using the 1-armed antibody onartuzumab. J Nucl Med. 2012; 53:1592–1600.
33. Viola-Villegas NT, Rice SL, Carlin S, Wu X, Evans MJ, Sevak KK, Drobjnak M, Ragupathi G, Sawada R, Scholz WW, Livingston PO, Lewis JS. Applying PET to broaden the diagnostic utility of the clinically validated CA19.9 serum biomarker for oncology. J Nucl Med. 2013; 54:1876–1882.
34. Ulmert D, Evans MJ, Holland JP, Rice SL, Wongvipat J, Pettersson K, Abrahamsson PA, Scardino PT, Larson SM, Lilja H, Lewis JS, Sawyers CL. Imaging androgen receptor signaling with a radiotracer targeting free prostate-specific antigen. Cancer Discov. 2012; 2:320–327.
35. Taguchi A, Politi K, Pitteri SJ, Lockwood WW, Faça VM, Kelly-Spratt K, Wong CH, Zhang Q, Chin A, Park KS, Goodman G, Gazdar AF, Sage J, et al. Lung cancer signatures in plasma based on proteome profiling of mouse tumor models. Cancer Cell. 2011; 20:289–299.
36. Wilken JA, Baron AT, Maihle NJ. The epidermal growth factor receptor conundrum. Cancer. 2011; 117:2358–2360.
37. Rizvi SNF, Visser OJ, Vosjan MJWD, Van Lingen A, Hoekstra OS, Zijlstra JM, Huijgens PC, van Dongen GA, Lubberink M. Biodistribution, radiation dosimetry and scouting of 90Y-ibritumomab tiuxetan therapy in patients with relapsed B-cell non-Hodgkin’s lymphoma using 89Zr-ibritumomab tiuxetan and PET. Eur J Nucl Med Mol Imaging. 2012; 39:512–520.
38. Börjesson PKE, Jauw YWS, de Bree R, Roos JC, Castelijns JA, Leemans CR, van Dongen GA, Boellaard R. Radiation dosimetry of 89Zr-labeled chimeric monoclonal antibody U36 as used for immuno-PET in head and neck cancer patients. J Nucl Med. 2009; 50:1828–1836.
39. Divgi C, Welt S, Kris M. Phase I and imaging trial of indium-111-labeled anti-epidermal growth factor receptor monoclonal antibody 225 in patients with squamous cell lung carcinoma. J Natl Cancer Inst. 1991; 83:97–104.
40. Real FX, Rettig WJ, Chesa PG, Melamed MR, Old LJ, Mendelsohn J. Expression of epidermal growth factor receptor in human cultured cells and tissues: Relationship to cell lineage and stage of differentiation. Cancer Res. 1986; 46:4726–3471.
41. Nagengast WB, de Vries EG, Hospers GA, Mulder NH, de Jong JR, Hollema H, Brouwers AH, van Dongen GA, Perk LR, Lub-de Hooge MN. In vivo VEGF imaging with radiolabeled bevacizumab in a human ovarian tumor xenograft. J Nucl Med. 2007; 48:1313–1319.
42. Ruegg CL, Anderson-Berg WT, Brechbiel MW, Mirzadeh S, Gansow OA, Strand M. Improved in vivo stability and tumor targeting of bismuth-labeled antibody. Cancer Res. 1990; 5:4221–4226.
43. Loening AM, Gambhir SS. AMIDE: a free software tool for multimodality medical image analysis. Mol Imaging. 2003; 2:131–137.
44. Bradford M. A rapid and sensitive method for the quantitation of microgram quantities of protein utilizing the principle of protein-dye binding. Anal Biochem. 1976; 72:248–254.